2013 Global Health and Wellness Report - Kantar Health
2013 Global Health and Wellness Report - Kantar Health
2013 Global Health and Wellness Report - Kantar Health

Create successful ePaper yourself
Turn your PDF publications into a flip-book with our unique Google optimized e-Paper software.
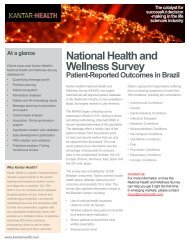
National <strong>Health</strong> <strong>and</strong> <strong>Wellness</strong> Survey 2Table of ContentsAbout <strong>Kantar</strong> <strong>Health</strong>............................................................................................... 3The National <strong>Health</strong> <strong>and</strong> <strong>Wellness</strong> Survey........................................................... 4Countries Included in NHWS................................................................................ 6Therapeutic Areas Covered by NHWS................................................................. 6Data by CountryCountry Comparisons..................................................................................... 9Brazil ................................................................................................................ 36China ................................................................................................................ 65France .............................................................................................................. 94Germany .......................................................................................................... 123Italy ................................................................................................................... 152Japan ................................................................................................................ 181Russia .............................................................................................................. 210Spain ................................................................................................................ 239United Kingdom .............................................................................................. 268United States ................................................................................................... 297Appendix ................................................................................................................ 326Introductionwww.<strong>Kantar</strong><strong>Health</strong>.com
CountryComparisonswww.<strong>Kantar</strong><strong>Health</strong>.com
National <strong>Health</strong> <strong>and</strong> <strong>Wellness</strong> Survey | Country Comparisons | Autoimmune Conditions 10Autoimmune ConditionsAutoimmune conditions include the adult population suffering from Ankylosing Spondylitis, Connective TissueDisease, Idiopathic Thrombocytopenia Purpura (ITP), Inflammatory Bowel Disease (Crohn’s Disease or UlcerativeColitis), ITP, Lupus, Psoriasis, Psoriatic Arthritis, Rheumatoid Arthritis <strong>and</strong> Sjögren’s Syndrome.% of adult population with Autoimmune conditionsGeographyBrazil China 5EU Japan Russia U.S.Self-<strong>Report</strong>ed (% total population) 3% 10% 9% 2% 7% 7%Male 37% 57% 44% 53% 46% 44%Female 63% 43% 56% 47% 54% 56%Diagnosed (% total population) 3% 8% 9% 2% 5% 7%Male 35% 57% 44% 53% 44% 43%Female 65% 43% 56% 47% 56% 57%140,086,000* 444,643,000** 258,576,000* 106,460,000* 87,171,000* 233,806,000*Total adult populations: Brazil: 140,806,000 5EU: 258,576,000 Japan: 106,460,000 U.S.: 233,806,000Total urban adult populations: China: 444,643,000 Russia: 87,171,000Medication usageGeography% of sufferers Brazil China 5EU Japan Russia U.S.Prescription only 25% 16% 42% 42% 22% 38%OTC only* 16% 27% 11% 9% 24% 18%Prescription <strong>and</strong> OTC 20% 39% 8% 5% 26% 16%No product 39% 19% 39% 44% 28% 27%*Any product used to treat condition other than prescription medication.Autoimmune Conditionswww.<strong>Kantar</strong><strong>Health</strong>.com
National <strong>Health</strong> <strong>and</strong> <strong>Wellness</strong> Survey | Country Comparisons | Autoimmune Conditions 11LifestyleGeography% of sufferers Brazil China 5EU Japan Russia U.S.Exercise* 55% 69% 57% 48% 56% 59%Smoke 23% 31% 29% 23% 39% 24%Drink alcohol 50% 79% 76% 73% 75% 64%Obese (BMI ≥ 30) 26% 8% 23% 3% 21% 39%*At least one day per month of vigorous exercise lasting 20 minutes or more.Quality of life6050403047.2 48.542.0 41.745.543.649.145.547.042.243.045.220100Brazil China 5EU Japan Russia U.S.Physical summary scoreMental summary scoreWork productivity <strong>and</strong> activity impairmentGeographyBrazil China 5EU Japan Russia U.S.Work Productivity Loss: % overallwork impairment due to health(Base: Employed Full-time)31.6 40.5 30.2 33.7 29.1 28.9Activity Impairment: % activity impairmentdue to health40.1 36.3 38.9 32.4 34.0 41.2Sufferers are self-reported.Autoimmune Conditionswww.<strong>Kantar</strong><strong>Health</strong>.com
National <strong>Health</strong> <strong>and</strong> <strong>Wellness</strong> Survey | Country Comparisons | Cancer Conditions 13LifestyleGeography% of sufferers Brazil China 5EU Japan Russia U.S.Exercise* 53% 63% 52% 51% 53% 57%Smoke 24% 37% 24% 16% 29% 16%Drink alcohol 46% 73% 76% 67% 73% 64%Obese (BMI ≥ 30) 18% 7% 21% 2% 22% 33%*At least one day per month of vigorous exercise lasting 20 minutes or more.Quality of life6050403047.844.9 46.2 45.540.045.750.349.446.6 45.643.250.220100Brazil China 5EU Japan Russia U.S.Physical summary scoreMental summary scoreWork productivity <strong>and</strong> activity impairmentGeographyBrazil China 5EU Japan Russia U.S.Work Productivity Loss: % overallwork impairment due to health(Base: Employed Full-time)37.4 50.6 34.3 27.3 31.5 22.1Activity Impairment: % activity impairmentdue to health34.0 40.5 37.2 26.0 33.3 30.9Sufferers are self-reported.Cancer Conditionswww.<strong>Kantar</strong><strong>Health</strong>.com
National <strong>Health</strong> <strong>and</strong> <strong>Wellness</strong> Survey | Country Comparisons | Cardiovascular Conditions 14Cardiovascular ConditionsCardiovascular conditions include the adult population suffering from Angina Pectoris, Arrhythmia, Atherosclerosis,Atrial Fibrillation, Congestive Heart Failure (CHF), Deep Vein Thrombosis, Deep Vein Thrombosis (DVT), HeartAttack, Heart Murmur, High Cholesterol, Hypertension, Left Ventricular Hypertrophy (LVH), Peripheral ArterialDisease (PAD), Peripheral Vascular Disease (PVD), Pulmonary Embolism, Stroke or Mini-Stroke/TransientIschemia <strong>and</strong> Unstable Angina.% of adult population with Cardiovascular conditionsGeographyBrazil China 5EU Japan Russia U.S.Self-<strong>Report</strong>ed (% total population) 32% 29% 39% 22% 43% 45%Male 44% 52% 50% 55% 41% 50%Female 56% 48% 50% 45% 59% 50%Diagnosed (% total population) 29% 26% 37% 21% 37% 43%Male 43% 52% 50% 55% 40% 50%Female 57% 48% 50% 45% 60% 50%Total adult populations: Brazil: 140,806,000 5EU: 258,576,000 Japan: 106,460,000 U.S.: 233,806,000Total urban adult populations: China: 444,643,000 Russia: 87,171,000Medication usageGeography% of sufferers Brazil China 5EU Japan Russia U.S.Prescription only 34% 32% 53% 69% 33% 48%OTC only* 17% 12% 5% 2% 12% 6%Prescription <strong>and</strong> OTC 18% 35% 9% 4% 28% 24%No product 32% 22% 33% 25% 27% 22%*Any product used to treat condition other than prescription medication.Cardiovascular Conditionswww.<strong>Kantar</strong><strong>Health</strong>.com
National <strong>Health</strong> <strong>and</strong> <strong>Wellness</strong> Survey | Country Comparisons | Cardiovascular Conditions 15LifestyleGeography% of sufferers Brazil China 5EU Japan Russia U.S.Exercise* 50% 61% 56% 52% 52% 60%Smoke 20% 24% 25% 18% 31% 19%Drink alcohol 49% 67% 77% 70% 73% 63%Obese (BMI ≥ 30) 26% 9% 25% 4% 28% 41%*At least one day per month of vigorous exercise lasting 20 minutes or more.Quality of life60504048.9 48.2 47.744.9 43.545.850.749.147.9 46.943.348.33020100Brazil China 5EU Japan Russia U.S.Physical summary scoreMental summary scoreWork productivity <strong>and</strong> activity impairmentGeographyBrazil China 5EU Japan Russia U.S.Work Productivity Loss: % overallwork impairment due to health(Base: Employed Full-time)26.4 37.1 25.0 24.8 25.0 18.7Activity Impairment: % activity impairmentdue to health30.0 33.4 31.8 25.7 31.2 29.7Sufferers are self-reported.Cardiovascular Conditionswww.<strong>Kantar</strong><strong>Health</strong>.com
National <strong>Health</strong> <strong>and</strong> <strong>Wellness</strong> Survey | Country Comparisons | Gastrointestinal Conditions 16Gastrointestinal ConditionsGastrointestinal conditions include the adult population suffering from Chronic Constipation, Diarrhea, Diverticulitis,Gastroesophageal Reflux Disease (GERD), Heartburn <strong>and</strong> Irritable Bowel Syndrome (IBS).% of adult population with Gastrointestinal conditionsGeographyBrazil China 5EU Japan Russia U.S.Self-<strong>Report</strong>ed (% total population) 25% 16% 33% 16% 37% 35%Male 44% 51% 43% 41% 44% 46%Female 56% 49% 57% 59% 56% 54%Diagnosed (% total population) 17% 11% 22% 7% 12% 21%Male 42% 54% 40% 42% 39% 42%Female 58% 46% 60% 58% 61% 58%Total adult populations: Brazil: 140,806,000 5EU: 258,576,000 Japan: 106,460,000 U.S.: 233,806,000Total urban adult populations: China: 444,643,000 Russia: 87,171,000Medication usageGeography% of sufferers Brazil China 5EU Japan Russia U.S.Prescription only 15% 18% 28% 18% 26% 19%OTC only* 39% 27% 25% 25% 24% 40%Prescription <strong>and</strong> OTC 15% 24% 10% 8% 24% 12%No product 31% 31% 38% 48% 26% 29%*Any product used to treat condition other than prescription medication.Gastrointestinal Conditionswww.<strong>Kantar</strong><strong>Health</strong>.com
National <strong>Health</strong> <strong>and</strong> <strong>Wellness</strong> Survey | Country Comparisons | Gastrointestinal Conditions 17LifestyleGeography% of sufferers Brazil China 5EU Japan Russia U.S.Exercise* 54% 62% 58% 44% 54% 63%Smoke 20% 25% 27% 22% 37% 23%Drink alcohol 56% 75% 78% 70% 79% 67%Obese (BMI ≥ 30) 23% 9% 21% 3% 22% 38%*At least one day per month of vigorous exercise lasting 20 minutes or more.Quality of life60504050.0 50.0 48.751.0 49.743.9 42.5 43.6 44.5 42.847.745.93020100Brazil China 5EU Japan Russia U.S.Physical summary scoreMental summary scoreWork productivity <strong>and</strong> activity impairmentGeographyBrazil China 5EU Japan Russia U.S.Work Productivity Loss: % overallwork impairment due to health(Base: Employed Full-time)26.0 33.7 24.6 29.9 24.1 19.5Activity Impairment: % activity impairmentdue to health27.6 31.4 31.8 31.3 28.9 30.2Sufferers are self-reported.Gastrointestinal Conditionswww.<strong>Kantar</strong><strong>Health</strong>.com
National <strong>Health</strong> <strong>and</strong> <strong>Wellness</strong> Survey | Country Comparisons | Infectious Diseases 18Infectious DiseasesInfectious Diseases include the adult population suffering from AIDS, C. Difficile, Community-Acquired Pneumonia(CAP), Genital Herpes, Genital Warts, Hospital-Acquired Pneumonia (HAP), Hepatitis A, Hepatitis B, Hepatitis C,HIV, Tuberculosis <strong>and</strong> Yeast Infection.% of adult population with Infectious DiseasesGeographyBrazil China 5EU Japan Russia U.S.Self-<strong>Report</strong>ed (% total population) 8% 9% 9% 4% 17% 9%Male 53% 54% 39% 48% 43% 33%Female 47% 46% 61% 53% 57% 67%Diagnosed (% total population) 6% 8% 8% 3% 12% 8%Male 53% 53% 39% 47% 47% 35%Female 47% 47% 61% 53% 53% 65%Total adult populations: Brazil: 140,806,000 5EU: 258,576,000 Japan: 106,460,000 U.S.: 233,806,000Total urban adult populations: China: 444,643,000 Russia: 87,171,000Medication usageGeography% of sufferers Brazil China 5EU Japan Russia U.S.Using prescription 21% 40% 24% 17% 18% 25%Not using prescription 79% 60% 76% 83% 82% 75%*Any product used to treat condition other than prescription medication.Infectious Diseaseswww.<strong>Kantar</strong><strong>Health</strong>.com
National <strong>Health</strong> <strong>and</strong> <strong>Wellness</strong> Survey | Country Comparisons | Infectious Diseases 19LifestyleGeography% of sufferers Brazil China 5EU Japan Russia U.S.Exercise* 58% 63% 61% 49% 53% 63%Smoke 25% 27% 30% 22% 38% 26%Drink alcohol 59% 75% 78% 69% 80% 67%Obese (BMI ≥ 30) 17% 7% 18% 3% 22% 35%*At least one day per month of vigorous exercise lasting 20 minutes or more.Quality of life60504050.5 49.7 48.242.9 42.5 43.150.7 49.146.242.447.044.73020100Brazil China 5EU Japan Russia U.S.Physical summary scoreMental summary scoreWork productivity <strong>and</strong> activity impairmentGeographyBrazil China 5EU Japan Russia U.S.Work Productivity Loss: % overallwork impairment due to health(Base: Employed Full-time)24.9 35.3 28.0 32.8 23.9 23.2Activity Impairment: % activity impairmentdue to health29.5 31.6 33.7 31.1 29.7 33.4Sufferers are self-reported.Infectious Diseaseswww.<strong>Kantar</strong><strong>Health</strong>.com
National <strong>Health</strong> <strong>and</strong> <strong>Wellness</strong> Survey | Country Comparisons | Metabolic Conditions 20Metabolic ConditionsMetabolic conditions include the adult population suffering from High Cholesterol, Hypertension, Obesity, ThyroidCondition, Type 1 Diabetes <strong>and</strong> Type 2 Diabetes.% of adult population with Metabolic conditionsGeographyBrazil China 5EU Japan Russia U.S.Self-<strong>Report</strong>ed (% total population) 36% 29% 43% 23% 43% 57%Male 43% 53% 48% 55% 38% 48%Female 57% 47% 52% 45% 62% 52%Diagnosed (% total population) 26% 23% 35% 20% 31% 43%Male 42% 53% 48% 54% 36% 49%Female 58% 47% 52% 46% 64% 51%Total adult populations: Brazil: 140,806,000 5EU: 258,576,000 Japan: 106,460,000 U.S.: 233,806,000Total urban adult populations: China: 444,643,000 Russia: 87,171,000Medication usageGeography% of sufferers Brazil China 5EU Japan Russia U.S.Prescription only 30% 30% 54% 69% 31% 42%OTC only* 12% 9% 3% 2% 10% 4%Prescription <strong>and</strong> OTC 16% 32% 7% 4% 22% 19%No product 42% 30% 37% 24% 37% 35%*Any product used to treat condition other than prescription medication.Metabolic Conditionswww.<strong>Kantar</strong><strong>Health</strong>.com
National <strong>Health</strong> <strong>and</strong> <strong>Wellness</strong> Survey | Country Comparisons | Musculoskeletal Conditions 22Musculoskeletal ConditionsMusculoskeletal conditions include the adult population suffering from Gout, Muscular Dystrophy, Osteoarthritis,Osteopenia, Osteoporosis <strong>and</strong> Paget’s Disease.% of adult population with Musculoskeletal conditionsGeographyBrazil China 5EU Japan Russia U.S.Self-<strong>Report</strong>ed (% total population) 6% 16% 14% 7% 15% 20%Male 36% 45% 36% 46% 34% 39%Female 64% 55% 64% 54% 66% 61%Diagnosed (% total population) 6% 14% 14% 7% 13% 19%Male 34% 44% 36% 45% 33% 38%Female 66% 56% 64% 55% 67% 62%Total adult populations: Brazil: 140,806,000 5EU: 258,576,000 Japan: 106,460,000 U.S.: 233,806,000Total urban adult populations: China: 444,643,000 Russia: 87,171,000Medication usageGeography% of sufferers Brazil China 5EU Japan Russia U.S.Prescription only 19% 10% 30% 38% 26% 21%OTC only* 17% 30% 16% 13% 24% 40%Prescription <strong>and</strong> OTC 31% 49% 23% 17% 32% 20%No product 32% 11% 32% 33% 17% 19%*Any product used to treat condition other than prescription medication.Musculoskeletal Conditionswww.<strong>Kantar</strong><strong>Health</strong>.com
National <strong>Health</strong> <strong>and</strong> <strong>Wellness</strong> Survey | Country Comparisons | Musculoskeletal Conditions 23LifestyleGeography% of sufferers Brazil China 5EU Japan Russia U.S.Exercise* 48% 65% 53% 52% 54% 55%Smoke 21% 24% 22% 18% 30% 18%Drink alcohol 47% 69% 73% 71% 67% 61%Obese (BMI ≥ 30) 28% 9% 25% 4% 29% 41%*At least one day per month of vigorous exercise lasting 20 minutes or more.Quality of life60504045.245.247.443.243.945.549.248.445.643.543.549.03020100Brazil China 5EU Japan Russia U.S.Physical summary scoreMental summary scoreWork productivity <strong>and</strong> activity impairmentGeographyBrazil China 5EU Japan Russia U.S.Work Productivity Loss: % overallwork impairment due to health(Base: Employed Full-time)36.7 38.7 32.3 27.5 29.7 23.2Activity Impairment: % activity impairmentdue to health41.5 35.2 39.5 29.8 36.0 36.3Sufferers are self-reported.Musculoskeletal Conditionswww.<strong>Kantar</strong><strong>Health</strong>.com
National <strong>Health</strong> <strong>and</strong> <strong>Wellness</strong> Survey | Country Comparisons | Neurological Conditions 24Neurological ConditionsNeurological conditions include the adult population suffering from Epilepsy, Hemiplegia, Migraine, MultipleSclerosis, Parkinson’s Disease <strong>and</strong> Restless Legs Syndrome (RLS).% of adult population with Neurological conditionsGeographyBrazil China 5EU Japan Russia U.S.Self-<strong>Report</strong>ed (% total population) 22% 16% 21% 9% 17% 18%Male 35% 46% 36% 32% 29% 36%Female 65% 54% 64% 68% 71% 64%Diagnosed (% total population) 14% 11% 14% 5% 6% 12%Male 29% 47% 34% 31% 27% 33%Female 71% 53% 66% 69% 73% 67%Total adult populations: Brazil: 140,806,000 5EU: 258,576,000 Japan: 106,460,000 U.S.: 233,806,000Total urban adult populations: China: 444,643,000 Russia: 87,171,000Medication usageGeography% of sufferers Brazil China 5EU Japan Russia U.S.Prescription only 20% 11% 31% 14% 30% 25%OTC only* 34% 32% 30% 43% 16% 35%Prescription <strong>and</strong> OTC 15% 24% 8% 6% 12% 11%No product 32% 33% 31% 37% 42% 29%*Any product used to treat condition other than prescription medication.Neurological Conditionswww.<strong>Kantar</strong><strong>Health</strong>.com
National <strong>Health</strong> <strong>and</strong> <strong>Wellness</strong> Survey | Country Comparisons | Neurological Conditions 25LifestyleGeography% of sufferers Brazil China 5EU Japan Russia U.S.Exercise* 57% 65% 59% 41% 56% 63%Smoke 19% 25% 28% 23% 35% 24%Drink alcohol 51% 76% 75% 67% 77% 66%Obese (BMI ≥ 30) 21% 9% 19% 3% 22% 36%*At least one day per month of vigorous exercise lasting 20 minutes or more.Quality of life6050403049.8 49.1 48.850.943.3 41.7 42.5 43.248.0 47.240.744.020100Brazil China 5EU Japan Russia U.S.Physical summary scoreMental summary scoreWork productivity <strong>and</strong> activity impairmentGeographyBrazil China 5EU Japan Russia U.S.Work Productivity Loss: % overallwork impairment due to health(Base: Employed Full-time)30.5 37.2 26.6 33.4 29.0 23.7Activity Impairment: % activity impairmentdue to health32.1 34.0 33.3 34.2 33.7 33.9Sufferers are self-reported.Neurological Conditionswww.<strong>Kantar</strong><strong>Health</strong>.com
National <strong>Health</strong> <strong>and</strong> <strong>Wellness</strong> Survey | Country Comparisons | Ophthalmic Conditions 26Ophthalmic ConditionsOphthalmic conditions include the adult population suffering from Cataracts, Dry Eye, Glaucoma <strong>and</strong> MacularDegeneration.% of adult population with Ophthalmic conditionsGeographyBrazil China 5EU Japan Russia U.S.Self-<strong>Report</strong>ed (% total population) 6% 8% 10% 13% 11% 16%Male 42% 53% 39% 40% 35% 40%Female 58% 47% 61% 60% 65% 60%Diagnosed (% total population) 4% 6% 9% 11% 5% 13%Male 39% 52% 38% 39% 34% 38%Female 61% 48% 62% 61% 66% 62%Total adult populations: Brazil: 140,806,000 5EU: 258,576,000 Japan: 106,460,000 U.S.: 233,806,000Total urban adult populations: China: 444,643,000 Russia: 87,171,000Medication usageGeography% of sufferers Brazil China 5EU Japan Russia U.S.Prescription only 36% 17% 31% 37% 34% 19%OTC only* 16% 31% 18% 15% 18% 28%Prescription <strong>and</strong> OTC 12% 27% 7% 6% 20% 8%No product 36% 26% 44% 42% 28% 45%*Any product used to treat condition other than prescription medication.Ophthalmic Conditionswww.<strong>Kantar</strong><strong>Health</strong>.com
National <strong>Health</strong> <strong>and</strong> <strong>Wellness</strong> Survey | Country Comparisons | Ophthalmic Conditions 27LifestyleGeography% of sufferers Brazil China 5EU Japan Russia U.S.Exercise* 61% 65% 59% 51% 61% 58%Smoke 19% 26% 22% 16% 29% 16%Drink alcohol 54% 77% 77% 69% 75% 61%Obese (BMI ≥ 30) 17% 8% 22% 2% 16% 35%*At least one day per month of vigorous exercise lasting 20 minutes or more.Quality of life60504049.0 48.942.4 42.246.545.650.847.648.941.345.548.93020100Brazil China 5EU Japan Russia U.S.Physical summary scoreMental summary scoreWork productivity <strong>and</strong> activity impairmentGeographyBrazil China 5EU Japan Russia U.S.Work Productivity Loss: % overallwork impairment due to health(Base: Employed Full-time)36.2 39.0 29.5 29.9 27.0 22.1Activity Impairment: % activity impairmentdue to health33.0 34.2 35.0 28.4 32.9 31.9Sufferers are self-reported.Ophthalmic Conditionswww.<strong>Kantar</strong><strong>Health</strong>.com
National <strong>Health</strong> <strong>and</strong> <strong>Wellness</strong> Survey | Country Comparisons | Pain Conditions 29LifestyleGeography% of sufferers Brazil China 5EU Japan Russia U.S.Exercise* 50% 62% 56% 44% 56% 60%Smoke 20% 25% 28% 23% 36% 23%Drink alcohol 54% 76% 77% 71% 77% 64%Obese (BMI ≥ 30) 23% 8% 23% 4% 19% 39%*At least one day per month of vigorous exercise lasting 20 minutes or more.Quality of life6050403048.0 49.042.9 42.546.148.9 47.444.4 45.141.545.546.520100Brazil China 5EU Japan Russia U.S.Physical summary scoreMental summary scoreWork productivity <strong>and</strong> activity impairmentGeographyBrazil China 5EU Japan Russia U.S.Work Productivity Loss: % overallwork impairment due to health(Base: Employed Full-time)28.1 35.8 26.8 31.1 28.3 22.1Activity Impairment: % activity impairmentdue to health32.4 33.2 36.1 33.6 34.1 34.2Sufferers are self-reported.Pain Conditionswww.<strong>Kantar</strong><strong>Health</strong>.com
National <strong>Health</strong> <strong>and</strong> <strong>Wellness</strong> Survey | Country Comparisons | Psychiatric Conditions 30Psychiatric ConditionsPsychiatric conditions include the adult population suffering from Anxiety, Attention Deficit/Hyperactivity Disorder(ADHD), Bipolar Disorder, Depression, Generalized Anxiety Disorder (GAD), Obsessive Compulsive Disorder(OCD), Phobias, Post Traumatic Stress Disorder (PTSD), Schizophrenia <strong>and</strong> Social Anxiety Disorder (SAD).% of adult population with Psychiatric conditionsGeographyBrazil China 5EU Japan Russia U.S.Self-<strong>Report</strong>ed (% total population) 33% 13% 25% 5% 28% 32%Male 40% 55% 39% 47% 37% 44%Female 60% 45% 61% 53% 63% 56%Diagnosed (% total population) 20% 7% 18% 5% 5% 23%Male 35% 56% 37% 47% 41% 42%Female 65% 44% 63% 53% 59% 58%Total adult populations: Brazil: 140,806,000 5EU: 258,576,000 Japan: 106,460,000 U.S.: 233,806,000Total urban adult populations: China: 444,643,000 Russia: 87,171,000Medication usageGeography% of sufferers Brazil China 5EU Japan Russia U.S.Prescription only 17% 6% 31% 62% 9% 40%OTC only* 29% 36% 15% 4% 42% 9%Prescription <strong>and</strong> OTC 12% 18% 7% 7% 16% 5%No product 42% 39% 47% 26% 33% 46%*Any product used to treat condition other than prescription medication.Psychiatric Conditionswww.<strong>Kantar</strong><strong>Health</strong>.com
National <strong>Health</strong> <strong>and</strong> <strong>Wellness</strong> Survey | Country Comparisons | Psychiatric Conditions 31LifestyleGeography% of sufferers Brazil China 5EU Japan Russia U.S.Exercise* 55% 67% 57% 42% 56% 64%Smoke 22% 29% 32% 27% 38% 26%Drink alcohol 57% 83% 75% 67% 80% 68%Obese (BMI ≥ 30) 22% 9% 21% 7% 15% 36%*At least one day per month of vigorous exercise lasting 20 minutes or more.Quality of life60504030201050.5 49.4 48.8 50.4 50.3 48.640.638.6 37.237.634.040.50Brazil China 5EU Japan Russia U.S.Physical summary scoreMental summary scoreWork productivity <strong>and</strong> activity impairmentGeographyBrazil China 5EU Japan Russia U.S.Work Productivity Loss: % overallwork impairment due to health(Base: Employed Full-time)31.1 42.3 32.9 48.3 28.5 24.7Activity Impairment: % activity impairmentdue to health31.7 37.4 39.3 48.1 33.0 34.3Sufferers are self-reported.Psychiatric Conditionswww.<strong>Kantar</strong><strong>Health</strong>.com
National <strong>Health</strong> <strong>and</strong> <strong>Wellness</strong> Survey | Country Comparisons | Respiratory Conditions 32Respiratory ConditionsRespiratory conditions include the adult population suffering from Asthma, Chronic Bronchitis, Chronic ObstructivePulmonary Disease (COPD), Cystic Fibrosis, Emphysema, Hay Fever <strong>and</strong> Nasal Allergies.% of adult population with Respiratory conditionsGeographyBrazil China 5EU Japan Russia U.S.Self-<strong>Report</strong>ed (% total population) 26% 14% 24% 25% 23% 31%Male 41% 58% 47% 47% 38% 42%Female 59% 42% 53% 53% 62% 58%Diagnosed (% total population) 23% 12% 21% 19% 15% 26%Male 39% 58% 45% 46% 34% 41%Female 61% 42% 55% 54% 66% 59%Total adult populations: Brazil: 140,806,000 5EU: 258,576,000 Japan: 106,460,000 U.S.: 233,806,000Total urban adult populations: China: 444,643,000 Russia: 87,171,000Medication usageGeography% of sufferers Brazil China 5EU Japan Russia U.S.Prescription only 17% 14% 37% 18% 20% 26%OTC only* 39% 33% 23% 33% 24% 39%Prescription <strong>and</strong> OTC 19% 39% 15% 7% 26% 19%No product 25% 15% 25% 42% 30% 17%*Any product used to treat condition other than prescription medication.Respiratory Conditionswww.<strong>Kantar</strong><strong>Health</strong>.com
National <strong>Health</strong> <strong>and</strong> <strong>Wellness</strong> Survey | Country Comparisons | Respiratory Conditions 33LifestyleGeography% of sufferers Brazil China 5EU Japan Russia U.S.Exercise* 59% 63% 61% 47% 56% 65%Smoke 19% 27% 26% 17% 35% 21%Drink alcohol 56% 78% 79% 73% 78% 66%Obese (BMI ≥ 30) 20% 8% 19% 3% 21% 36%*At least one day per month of vigorous exercise lasting 20 minutes or more.Quality of life6050403051.1 50.1 49.044.5 43.3 44.652.347.049.2 47.841.947.020100Brazil China 5EU Japan Russia U.S.Physical summary scoreMental summary scoreWork productivity <strong>and</strong> activity impairmentGeographyBrazil China 5EU Japan Russia U.S.Work Productivity Loss: % overallwork impairment due to health(Base: Employed Full-time)25.7 34.5 24.0 25.2 25.5 18.2Activity Impairment: % activity impairmentdue to health26.6 31.2 30.4 25.8 31.1 29.0Sufferers are self-reported.Respiratory Conditionswww.<strong>Kantar</strong><strong>Health</strong>.com
National <strong>Health</strong> <strong>and</strong> <strong>Wellness</strong> Survey | Country Comparisons | Urologic Conditions 34Urologic ConditionsUrologic conditions include the adult population suffering from Benign Prostatic Hyperplasia (BPH), ErectileDysfunction, Overactive Bladder (OAB), Premature Ejaculation, Stress Urinary Incontinence (SUI) <strong>and</strong> Urinary TractInfection.% of adult population with Urologic conditionsGeographyBrazil China 5EU Japan Russia U.S.Self-<strong>Report</strong>ed (% total population) 24% 26% 31% 22% 23% 30%Male 81% 90% 69% 91% 66% 66%Female 19% 10% 31% 9% 34% 34%Diagnosed (% total population) 3% 6% 12% 3% 4% 14%Male 42% 67% 48% 74% 52% 50%Female 58% 33% 52% 26% 48% 50%Total adult populations: Brazil: 140,806,000 5EU: 258,576,000 Japan: 106,460,000 U.S.: 233,806,000Total urban adult populations: China: 444,643,000 Russia: 87,171,000Medication usageGeography% of sufferers Brazil China 5EU Japan Russia U.S.Prescription only 4% 7% 14% 9% 6% 18%OTC only* 15% 18% 3% 1% 15% 4%Prescription <strong>and</strong> OTC 3% 7% 2% 1% 4% 2%No product 79% 68% 81% 89% 76% 76%*Any product used to treat condition other than prescription medication.Urologic Conditionswww.<strong>Kantar</strong><strong>Health</strong>.com
National <strong>Health</strong> <strong>and</strong> <strong>Wellness</strong> Survey | Country Comparisons | Urologic Conditions 35LifestyleGeography% of sufferers Brazil China 5EU Japan Russia U.S.Exercise* 57% 62% 58% 49% 51% 61%Smoke 20% 35% 27% 27% 39% 22%Drink alcohol 60% 83% 80% 79% 80% 67%Obese (BMI ≥ 30) 21% 7% 22% 4% 24% 37%*At least one day per month of vigorous exercise lasting 20 minutes or more.Quality of life60504050.5 50.2 48.444.943.1 44.851.747.248.5 46.843.746.43020100Brazil China 5EU Japan Russia U.S.Physical summary scoreMental summary scoreWork productivity <strong>and</strong> activity impairmentGeographyBrazil China 5EU Japan Russia U.S.Work Productivity Loss: % overallwork impairment due to health(Base: Employed Full-time)23.5 34.0 26.8 27.7 24.2 24.4Activity Impairment: % activity impairmentdue to health26.1 31.7 31.7 26.7 29.0 32.5Sufferers are self-reported.Urologic Conditionswww.<strong>Kantar</strong><strong>Health</strong>.com
Brazilwww.<strong>Kantar</strong><strong>Health</strong>.com
National <strong>Health</strong> <strong>and</strong> <strong>Wellness</strong> Survey | Brazil 37Population profileJJBrazil has the largest population in South America(198.7 million people); however, it also has thesecond-lowest birth rate <strong>and</strong> population growth ratein South America (female mean fertility 1.8 sons).JJAbout 85% of Brazil’s population lives in urbancenters.JJBrazil has an aging population. It is estimated thatby 2020 close to 30 million people will be older than60.Life expectancy <strong>and</strong> causes of deathJJBrazil’s life expectancy is 74.JJCardiovascular disease is the leading cause ofdeath <strong>and</strong> disability among both men <strong>and</strong> women inBrazil. Predictions for the next two decades includenear tripling of ischemic heart disease (IHD) <strong>and</strong>stroke mortality.JJCancer is the second leading cause of death.JJBrazil’s government has cited deaths caused byexternal factors, such as transportation, violence<strong>and</strong> suicide, as a critical health problem. Deathcaused by external factors is the leading cause ofmortality for males between the ages of 5 <strong>and</strong> 49.<strong>Health</strong>care systemJJThe Ministry of <strong>Health</strong> is the coordinator of thecountry’s overall health policy.JJThe Public <strong>Health</strong>care System (SUS) in theory offersfull coverage for every citizen, but the coverage isseverely limited due to budgetary restrictions. Publichospitals <strong>and</strong> primary care services are free ofcharge.JJThere is a large variation in healthcare in publicsector, with some high-quality, world-class hospitals<strong>and</strong> many low-quality hospitals around the country.JJIn addition to the public sector, there is a large<strong>and</strong> wide private health network in Brazil, whichcomplements the services provided by thegovernment.JJAround 25% to 30% of Brazilians have privatehealth insurance due to the low quality of servicesprovided by the government. It comprises about 50million people, <strong>and</strong> the number of people with healthinsurance grows approximately 5% each year.Reimbursement policiesJJPrivate insurance fully reimburses hospitals.JJSome health insurances (covering about 20% of theinsured) partially reimburse for drug prescriptions.Brazilwww.<strong>Kantar</strong><strong>Health</strong>.com
National <strong>Health</strong> <strong>and</strong> <strong>Wellness</strong> Survey | Brazil 38General statisticsJJGross national income per capita (Intl $ 1 , 2009): 11,630JJLife expectancy at birth male/female (years): 70/77JJTotal expenditure on health per capita (Intl $, 2006): 1,109JJTotal expenditure on health as % of GDP (2006): 9.3%JJInternet penetration: Total population: 51.6%Lifestyle statistics 3JJTotal % of adult population that:18.0%56.6%49.3%17.4%Smokes Exercises 2 Drinks Alcohol Is Obese (BMI ≥ 30)DemographicsJJTotal population: 198,656,000JJArea size: 8,504,535 km 2JJDoctors (per 10,000 population): 15.1JJHospital beds (per 10,000 population): 23Rank City % Population1 San Paulo 5.0%2 Rio de Janeiro 3.0%433 Salvador 1.3%4 Fortaleza 1.2%5 Belo Horizonte 1.2%1521The international $ is a currency unit that is calculated using purchasing power parities (PPP), which are rates ofcurrency conversion constructed to account for differences in price level between countries.2At least one day per month of vigorous exercise lasting 20 minutes or more.3Adult population: 140,086,000Brazilwww.<strong>Kantar</strong><strong>Health</strong>.com
National <strong>Health</strong> <strong>and</strong> <strong>Wellness</strong> Survey | Brazil | Autoimmune Conditions 39Autoimmune ConditionsAutoimmune conditions include the adult population suffering from Ankylosing Spondylitis, Connective TissueDisease, Idiopathic Thrombocytopenia Purpura (ITP), Inflammatory Bowel Disease (Crohn’s Disease or UlcerativeColitis), Lupus, Psoriasis, Psoriatic Arthritis, Rheumatoid Arthritis <strong>and</strong> Sjögren’s Syndrome.% of adult population with Autoimmune conditions in BrazilAge GroupTotal 18-34 35-44 45-54 55-64 65 +Self-<strong>Report</strong>ed (% total population) 3% 3% 3% 5% 6% 1%Male 37% 37% 46% 36% 29% 32%Female 63% 63% 54% 64% 71% 68%Diagnosed (% total population) 3% 2% 3% 4% 6% 1%Male 35% 34% 43% 35% 30% 31%Female 65% 66% 57% 65% 70% 69%Total adult population: 140,086,000Medication usageAge Group% of sufferers Total 18-34 35-44 45-54 55-64 65 +Prescription only 25% 20% 35% 22% 21% 69%OTC only* 16% 12% 18% 26% 11% 4%Prescription <strong>and</strong> OTC 20% 18% 13% 12% 44% 14%No product 39% 50% 34% 40% 23% 13%*Functional foods, popular medicine, herbal products <strong>and</strong> medications purchased without a physician prescription.AttitudesJJ11% of sufferers prefer to treat themselves with an over-the-counter medication than to depend on a doctor togive them a prescription medication.JJ55% of sufferers are willing to make any lifestyle changes necessary to avoid having to take a prescriptionmedication.Autoimmune Conditionswww.<strong>Kantar</strong><strong>Health</strong>.com
National <strong>Health</strong> <strong>and</strong> <strong>Wellness</strong> Survey | Brazil | Autoimmune Conditions 40LifestyleAge Group% of sufferers Total 18-34 35-44 45-54 55-64 65 +Exercise* 55% 68% 58% 44% 49% 14%Smoke 23% 18% 21% 27% 30% 10%Drink alcohol 50% 58% 56% 51% 34% 23%Obese (BMI ≥ 30) 26% 18% 35% 44% 13% 13%*At least one day per month of vigorous exercise lasting 20 minutes or more.Quality of life6050403047.250.242.0 41.444.9 45.038.847.443.4 43.541.847.920100Total Population Age 18-34 Age 35-44 Age 45-54 Age 55-64 Age 65 +Physical summary scoreMental summary scoreWork productivity <strong>and</strong> activity impairmentAge GroupTotal 18-34 35-44 45-54 55-64 65 +Work Productivity Loss: % overallwork impairment due to health(Base: Employed Full-time)31.6 33.7 39.7 24.2 22.4 25.2Activity Impairment: % activity impairmentdue to health40.1 33.6 43.3 39.2 48.7 51.5Sufferers are self-reported.Autoimmune Conditionswww.<strong>Kantar</strong><strong>Health</strong>.com
National <strong>Health</strong> <strong>and</strong> <strong>Wellness</strong> Survey | Brazil | Cancer Conditions 41Cancer ConditionsCancer conditions include the adult population suffering from Breast Cancer, Cervical Cancer, Colorectal Cancer,Leukemia, Lymphoma, Metastatic Solid Tumor, Non-Small Cell Lung Cancer, Prostate Cancer, Skin Cancer, Small-Cell Lung Cancer, Uterine Cancer <strong>and</strong> Other Cancer.% of adult population with Cancer conditions in BrazilAge GroupTotal 18-34 35-44 45-54 55-64 65 +Self-<strong>Report</strong>ed (% total population) 2% 1% 2% 2% 3% 3%Male 44% 61% 29% 26% 39% 58%Female 56% 39% 71% 74% 61% 42%Diagnosed (% total population) 2% 1% 2% 2% 3% 3%Male 43% 59% 28% 27% 37% 61%Female 57% 41% 72% 73% 63% 39%Total adult population: 140,086,000Medication usageAge Group% of sufferers Total 18-34 35-44 45-54 55-64 65 +Using prescription 26% 26% 16% 20% 17% 54%Not using prescription 74% 74% 84% 80% 83% 46%Functional foods, popular medicine, herbal products <strong>and</strong> medications purchased without a physician prescriptionwere not captured for Cancer.AttitudesJJ10% of sufferers prefer to treat themselves with an over-the-counter medication than to depend on a doctor togive them a prescription medication.JJ52% of sufferers are willing to make any lifestyle changes necessary to avoid having to take a prescriptionmedication.Cancer Conditionswww.<strong>Kantar</strong><strong>Health</strong>.com
National <strong>Health</strong> <strong>and</strong> <strong>Wellness</strong> Survey | Brazil | Cancer Conditions 42LifestyleAge Group% of sufferers Total 18-34 35-44 45-54 55-64 65 +Exercise* 53% 71% 58% 50% 49% 24%Smoke 24% 21% 31% 16% 40% 15%Drink alcohol 46% 59% 42% 54% 42% 22%Obese (BMI ≥ 30) 18% 13% 24% 18% 29% 6%*At least one day per month of vigorous exercise lasting 20 minutes or more.Quality of life6050403047.849.944.8 43.346.9 47.5 49.145.440.446.543.851.220100Total Population Age 18-34 Age 35-44 Age 45-54 Age 55-64 Age 65 +Physical summary scoreMental summary scoreWork productivity <strong>and</strong> activity impairmentAge GroupTotal 18-34 35-44 45-54 55-64 65 +Work Productivity Loss: % overallwork impairment due to health(Base: Employed Full-time)37.4 41.2 54.6 29.8 18.7 3.7Activity Impairment: % activity impairmentdue to health34.0 25.8 43.2 37.1 36.7 32.8Sufferers are self-reported.Cancer Conditionswww.<strong>Kantar</strong><strong>Health</strong>.com
National <strong>Health</strong> <strong>and</strong> <strong>Wellness</strong> Survey | Brazil | Cardiovascular Conditions 43Cardiovascular ConditionsCardiovascular conditions include the adult population suffering from Angina Pectoris, Arrhythmia, Atherosclerosis,Atrial Fibrillation, Congestive Heart Failure (CHF), Deep Vein Thrombosis (DVT), Heart Attack, High Cholesterol,Hypertension, Left Ventricular Hypertrophy (LVH), Peripheral Arterial Disease (PAD), Peripheral Vascular Disease(PVD), Pulmonary Arterial Hypertension (PAH), Pulmonary Embolism, Stroke or Mini-Stroke/Transient Ischemia<strong>and</strong> Unstable Angina.% of adult population with Cardiovascular conditions in BrazilAge GroupTotal 18-34 35-44 45-54 55-64 65 +Self-<strong>Report</strong>ed (% total population) 32% 23% 33% 40% 49% 42%Male 44% 40% 44% 48% 49% 36%Female 56% 60% 56% 52% 51% 64%Diagnosed (% total population) 29% 17% 29% 37% 48% 41%Male 43% 39% 44% 46% 49% 35%Female 57% 61% 56% 54% 51% 65%Total adult population: 140,086,000Medication usageAge Group% of sufferers Total 18-34 35-44 45-54 55-64 65 +Prescription only 34% 14% 27% 34% 49% 71%OTC only* 17% 23% 23% 16% 11% 3%Prescription <strong>and</strong> OTC 18% 10% 17% 26% 24% 18%No product 32% 54% 34% 25% 16% 8%*Functional foods, popular medicine, herbal products <strong>and</strong> medications purchased without a physician prescription.AttitudesJJ14% of sufferers prefer to treat themselves with an over-the-counter medication than to depend on a doctor togive them a prescription medication.JJ55% of sufferers are willing to make any lifestyle changes necessary to avoid having to take a prescriptionmedication.Cardiovascular Conditionswww.<strong>Kantar</strong><strong>Health</strong>.com
National <strong>Health</strong> <strong>and</strong> <strong>Wellness</strong> Survey | Brazil | Cardiovascular Conditions 44LifestyleAge Group% of sufferers Total 18-34 35-44 45-54 55-64 65 +Exercise* 50% 65% 55% 45% 41% 28%Smoke 20% 15% 18% 29% 27% 11%Drink alcohol 49% 58% 54% 49% 52% 20%Obese (BMI ≥ 30) 26% 22% 34% 30% 24% 18%*At least one day per month of vigorous exercise lasting 20 minutes or more.Quality of life6050403048.9 50.7 49.844.940.447.8 48.544.6 45.948.8 49.745.720100Total Population Age 18-34 Age 35-44 Age 45-54 Age 55-64 Age 65 +Physical summary scoreMental summary scoreWork productivity <strong>and</strong> activity impairmentAge GroupTotal 18-34 35-44 45-54 55-64 65 +Work Productivity Loss: % overallwork impairment due to health(Base: Employed Full-time)26.4 31.1 29.5 21.9 16.4 15.7Activity Impairment: % activity impairmentdue to health30.0 30.9 29.3 31.0 27.7 29.6Sufferers are self-reported.Cardiovascular Conditionswww.<strong>Kantar</strong><strong>Health</strong>.com
National <strong>Health</strong> <strong>and</strong> <strong>Wellness</strong> Survey | Brazil | Gastrointestinal Conditions 45Gastrointestinal ConditionsGastrointestinal conditions include the adult population suffering from Chronic Constipation, Diarrhea, Diverticulitis,Gastroesophageal Reflux Disease (GERD), Heartburn <strong>and</strong> Irritable Bowel Syndrome (IBS).% of adult population with Gastrointestinal conditions in BrazilAge GroupTotal 18-34 35-44 45-54 55-64 65 +Self-<strong>Report</strong>ed (% total population) 25% 27% 27% 28% 24% 6%Male 44% 43% 48% 44% 44% 39%Female 56% 57% 52% 56% 56% 61%Diagnosed (% total population) 17% 18% 18% 19% 17% 4%Male 42% 41% 44% 44% 44% 43%Female 58% 59% 56% 56% 56% 57%Total adult population: 140,086,000Medication usageAge Group% of sufferers Total 18-34 35-44 45-54 55-64 65 +Prescription only 15% 15% 12% 17% 22% 18%OTC only* 39% 36% 44% 41% 39% 34%Prescription <strong>and</strong> OTC 15% 15% 14% 15% 16% 12%No product 31% 34% 30% 27% 24% 36%*Functional foods, popular medicine, herbal products <strong>and</strong> medications purchased without a physician prescription.AttitudesJJ13% of sufferers prefer to treat themselves with an over-the-counter medication than to depend on a doctor togive them a prescription medication.JJ56% of sufferers are willing to make any lifestyle changes necessary to avoid having to take a prescriptionmedication.Gastrointestinal Conditionswww.<strong>Kantar</strong><strong>Health</strong>.com
National <strong>Health</strong> <strong>and</strong> <strong>Wellness</strong> Survey | Brazil | Gastrointestinal Conditions 46LifestyleAge Group% of sufferers Total 18-34 35-44 45-54 55-64 65 +Exercise* 54% 63% 54% 41% 44% 24%Smoke 20% 14% 19% 33% 29% 16%Drink alcohol 56% 58% 56% 57% 46% 35%Obese (BMI ≥ 30) 23% 17% 30% 27% 27% 15%*At least one day per month of vigorous exercise lasting 20 minutes or more.Quality of life60504050.0 51.549.6 48.3 48.343.9 42.9 43.7 44.246.744.853.03020100Total Population Age 18-34 Age 35-44 Age 45-54 Age 55-64 Age 65 +Physical summary scoreMental summary scoreWork productivity <strong>and</strong> activity impairmentAge GroupTotal 18-34 35-44 45-54 55-64 65 +Work Productivity Loss: % overallwork impairment due to health(Base: Employed Full-time)26.0 28.5 26.0 20.4 20.7 19.3Activity Impairment: % activity impairmentdue to health27.6 26.2 29.4 27.9 30.8 25.0Sufferers are self-reported.Gastrointestinal Conditionswww.<strong>Kantar</strong><strong>Health</strong>.com
National <strong>Health</strong> <strong>and</strong> <strong>Wellness</strong> Survey | Brazil | Infectious Diseases 47Infectious DiseasesInfectious Diseases include the adult population suffering from AIDS, C. Difficile, Community-Acquired Pneumonia(CAP), Genital Herpes, Genital Warts, Hospital-Acquired Pneumonia (HAP), Hepatitis A, Hepatitis B, Hepatitis C,HIV <strong>and</strong> Tuberculosis.% of adult population with Infectious Diseases in BrazilAge GroupTotal 18-34 35-44 45-54 55-64 65 +Self-<strong>Report</strong>ed (% total population) 8% 7% 9% 8% 10% 2%Male 53% 49% 53% 62% 49% 70%Female 47% 51% 47% 38% 51% 30%Diagnosed (% total population) 6% 6% 7% 7% 8% 2%Male 53% 46% 49% 64% 59% 71%Female 47% 54% 51% 36% 41% 29%Total adult population: 140,086,000Medication usageAge Group% of sufferers Total 18-34 35-44 45-54 55-64 65 +Using prescription 21% 20% 23% 24% 12% 29%Not using prescription 79% 80% 77% 76% 88% 71%Functional foods, popular medicine, herbal products <strong>and</strong> medications purchased without a physician prescriptionwere not captured for Infectious Diseases.AttitudesJJ11% of sufferers prefer to treat themselves with an over-the-counter medication than to depend on a doctor togive them a prescription medication.JJ55% of sufferers are willing to make any lifestyle changes necessary to avoid having to take a prescriptionmedication.Infectious Diseaseswww.<strong>Kantar</strong><strong>Health</strong>.com
National <strong>Health</strong> <strong>and</strong> <strong>Wellness</strong> Survey | Brazil | Infectious Diseases 48LifestyleAge Group% of sufferers Total 18-34 35-44 45-54 55-64 65 +Exercise* 58% 68% 65% 46% 40% 24%Smoke 25% 18% 20% 40% 39% 17%Drink alcohol 59% 60% 58% 70% 49% 13%Obese (BMI ≥ 30) 17% 11% 29% 22% 10% 5%*At least one day per month of vigorous exercise lasting 20 minutes or more.Quality of life60504050.552.449.9 49.5 48.642.9 41.2 42.6 43.146.544.950.03020100Total Population Age 18-34 Age 35-44 Age 45-54 Age 55-64 Age 65 +Physical summary scoreMental summary scoreWork productivity <strong>and</strong> activity impairmentAge GroupTotal 18-34 35-44 45-54 55-64 65 +Work Productivity Loss: % overallwork impairment due to health(Base: Employed Full-time)24.9 26.7 30.9 20.2 13.3 36.3Activity Impairment: % activity impairmentdue to health29.5 25.6 34.1 32.2 29.8 30.3Sufferers are self-reported.Infectious Diseaseswww.<strong>Kantar</strong><strong>Health</strong>.com
National <strong>Health</strong> <strong>and</strong> <strong>Wellness</strong> Survey | Brazil | Metabolic Conditions 49Metabolic ConditionsMetabolic conditions include the adult population suffering from Diabetes, High Cholesterol, Hypertension, Obesity<strong>and</strong> Thyroid Condition.% of adult population with Metabolic conditions in BrazilAge GroupTotal 18-34 35-44 45-54 55-64 65 +Self-<strong>Report</strong>ed (% total population) 36% 25% 39% 44% 54% 48%Male 43% 44% 42% 45% 48% 36%Female 57% 56% 58% 55% 52% 64%Diagnosed (% total population) 26% 13% 26% 35% 47% 44%Male 42% 38% 43% 44% 49% 34%Female 58% 62% 57% 56% 51% 66%Total adult population: 140,086,000Medication usageAge Group% of sufferers Total 18-34 35-44 45-54 55-64 65 +Prescription only 30% 11% 22% 35% 45% 63%OTC only* 12% 15% 15% 11% 9% 3%Prescription <strong>and</strong> OTC 16% 8% 14% 22% 25% 19%No product 42% 66% 48% 32% 21% 16%*Functional foods, popular medicine, herbal products <strong>and</strong> medications purchased without a physician prescription.AttitudesJJ14% of sufferers prefer to treat themselves with an over-the-counter medication than to depend on a doctor togive them a prescription medication.JJ54% of sufferers are willing to make any lifestyle changes necessary to avoid having to take a prescriptionmedication.Metabolic Conditionswww.<strong>Kantar</strong><strong>Health</strong>.com
National <strong>Health</strong> <strong>and</strong> <strong>Wellness</strong> Survey | Brazil | Metabolic Conditions 50LifestyleAge Group% of sufferers Total 18-34 35-44 45-54 55-64 65 +Exercise* 50% 63% 57% 45% 42% 29%Smoke 17% 14% 17% 23% 24% 10%Drink alcohol 48% 56% 51% 50% 49% 18%Obese (BMI ≥ 30) 48% 56% 60% 48% 35% 25%*At least one day per month of vigorous exercise lasting 20 minutes or more.Quality of life60504049.3 51.0 50.246.242.848.1 49.145.2 46.949.5 50.246.03020100Total Population Age 18-34 Age 35-44 Age 45-54 Age 55-64 Age 65 +Physical summary scoreMental summary scoreWork productivity <strong>and</strong> activity impairmentAge GroupTotal 18-34 35-44 45-54 55-64 65 +Work Productivity Loss: % overallwork impairment due to health(Base: Employed Full-time)23.4 26.0 26.1 20.5 16.7 14.3Activity Impairment: % activity impairmentdue to health27.4 26.5 28.0 27.9 26.1 28.7Sufferers are self-reported.Metabolic Conditionswww.<strong>Kantar</strong><strong>Health</strong>.com
National <strong>Health</strong> <strong>and</strong> <strong>Wellness</strong> Survey | Brazil | Musculoskeletal Conditions 51Musculoskeletal ConditionsMusculoskeletal conditions include the adult population suffering from Gout, Muscular Dystrophy, Osteoarthritis,Osteopenia, Osteoporosis <strong>and</strong> Paget’s Disease.% of adult population with Musculoskeletal conditions in BrazilAge GroupTotal 18-34 35-44 45-54 55-64 65 +Self-<strong>Report</strong>ed (% total population) 6% 2% 5% 9% 17% 12%Male 36% 54% 60% 35% 25% 23%Female 64% 46% 40% 65% 75% 77%Diagnosed (% total population) 6% 2% 4% 9% 16% 11%Male 34% 41% 62% 33% 26% 21%Female 66% 59% 38% 67% 74% 79%Total adult population: 140,086,000Medication usageAge Group% of sufferers Total 18-34 35-44 45-54 55-64 65 +Prescription only 19% 19% 27% 16% 14% 25%OTC only* 17% 15% 27% 16% 19% 10%Prescription <strong>and</strong> OTC 31% 18% 19% 30% 36% 45%No product 32% 48% 27% 38% 30% 20%*Functional foods, popular medicine, herbal products <strong>and</strong> medications purchased without a physician prescription.AttitudesJJ13% of sufferers prefer to treat themselves with an over-the-counter medication than to depend on a doctor togive them a prescription medication.JJ53% of sufferers are willing to make any lifestyle changes necessary to avoid having to take a prescriptionmedication.Musculoskeletal Conditionswww.<strong>Kantar</strong><strong>Health</strong>.com
National <strong>Health</strong> <strong>and</strong> <strong>Wellness</strong> Survey | Brazil | Musculoskeletal Conditions 52LifestyleAge Group% of sufferers Total 18-34 35-44 45-54 55-64 65 +Exercise* 48% 69% 53% 52% 42% 31%Smoke 21% 17% 32% 23% 28% 5%Drink alcohol 47% 63% 60% 51% 52% 14%Obese (BMI ≥ 30) 28% 21% 41% 28% 31% 21%*At least one day per month of vigorous exercise lasting 20 minutes or more.Quality of life6050403045.245.248.240.542.943.745.6 44.3 45.947.2 48.942.820100Total Population Age 18-34 Age 35-44 Age 45-54 Age 55-64 Age 65 +Physical summary scoreMental summary scoreWork productivity <strong>and</strong> activity impairmentAge GroupTotal 18-34 35-44 45-54 55-64 65 +Work Productivity Loss: % overallwork impairment due to health(Base: Employed Full-time)36.7 48.0 33.5 27.1 34.7 47.0Activity Impairment: % activity impairmentdue to health41.5 42.7 53.3 41.9 36.2 38.5Sufferers are self-reported.Musculoskeletal Conditionswww.<strong>Kantar</strong><strong>Health</strong>.com
National <strong>Health</strong> <strong>and</strong> <strong>Wellness</strong> Survey | Brazil | Neurological Conditions 53Neurological ConditionsNeurological conditions include the adult population suffering from Epilepsy, Hemiplegia, Migraine, MultipleSclerosis, Parkinson’s Disease <strong>and</strong> Restless Legs Syndrome (RLS).% of adult population with Neurological conditions in BrazilAge GroupTotal 18-34 35-44 45-54 55-64 65 +Self-<strong>Report</strong>ed (% total population) 17% 19% 19% 17% 15% 3%Male 30% 29% 29% 31% 34% 44%Female 70% 71% 71% 69% 66% 56%Diagnosed (% total population) 9% 11% 11% 9% 7% 1%Male 21% 18% 23% 23% 28% 50%Female 79% 82% 77% 77% 72% 50%Total adult population: 140,086,000Medication usageAge Group% of sufferers Total 18-34 35-44 45-54 55-64 65 +Prescription only 18% 18% 20% 15% 21% 21%OTC only* 27% 28% 26% 25% 29% 8%Prescription <strong>and</strong> OTC 13% 14% 11% 15% 5% 2%No product 43% 40% 43% 45% 45% 68%*Functional foods, popular medicine, herbal products <strong>and</strong> medications purchased without a physician prescription.AttitudesJJ14% of sufferers prefer to treat themselves with an over-the-counter medication than to depend on a doctor togive them a prescription medication.JJ53% of sufferers are willing to make any lifestyle changes necessary to avoid having to take a prescriptionmedication.Neurological Conditionswww.<strong>Kantar</strong><strong>Health</strong>.com
National <strong>Health</strong> <strong>and</strong> <strong>Wellness</strong> Survey | Brazil | Neurological Conditions 54LifestyleAge Group% of sufferers Total 18-34 35-44 45-54 55-64 65 +Exercise* 55% 63% 51% 46% 51% 31%Smoke 21% 14% 24% 32% 27% 6%Drink alcohol 52% 56% 50% 50% 41% 26%Obese (BMI ≥ 30) 20% 16% 27% 21% 21% 21%*At least one day per month of vigorous exercise lasting 20 minutes or more.Quality of life6050403049.8 51.2 49.742.0 40.447.342.4 43.049.346.6 47.042.420100Total Population Age 18-34 Age 35-44 Age 45-54 Age 55-64 Age 65 +Physical summary scoreMental summary scoreWork productivity <strong>and</strong> activity impairmentAge GroupTotal 18-34 35-44 45-54 55-64 65 +Work Productivity Loss: % overallwork impairment due to health(Base: Employed Full-time)30.9 33.2 28.5 29.5 20.1 23.2Activity Impairment: % activity impairmentdue to health32.2 32.4 31.4 31.8 32.8 40.4Sufferers are self-reported.Neurological Conditionswww.<strong>Kantar</strong><strong>Health</strong>.com
National <strong>Health</strong> <strong>and</strong> <strong>Wellness</strong> Survey | Brazil | Ophthalmic Conditions 55Ophthalmic ConditionsOphthalmic conditions include the adult population suffering from Dry Eye, Glaucoma <strong>and</strong> Macular Degeneration.% of adult population with Ophthalmic conditions in BrazilAge GroupTotal 18-34 35-44 45-54 55-64 65 +Self-<strong>Report</strong>ed (% total population) 6% 5% 6% 6% 8% 3%Male 42% 48% 48% 40% 30% 21%Female 58% 52% 52% 60% 70% 79%Diagnosed (% total population) 4% 3% 4% 5% 6% 3%Male 39% 47% 46% 35% 29% 21%Female 61% 53% 54% 65% 71% 79%Total adult population: 140,086,000Medication usageAge Group% of sufferers Total 18-34 35-44 45-54 55-64 65 +Prescription only 36% 27% 38% 35% 48% 76%OTC only* 16% 23% 12% 13% 9% 2%Prescription <strong>and</strong> OTC 12% 12% 12% 17% 8% 3%No product 36% 39% 38% 35% 35% 18%*Functional foods, popular medicine, herbal products <strong>and</strong> medications purchased without a physician prescription.AttitudesJJ18% of sufferers prefer to treat themselves with an over-the-counter medication than to depend on a doctor togive them a prescription medication.JJ59% of sufferers are willing to make any lifestyle changes necessary to avoid having to take a prescriptionmedication.Ophthalmic Conditionswww.<strong>Kantar</strong><strong>Health</strong>.com
National <strong>Health</strong> <strong>and</strong> <strong>Wellness</strong> Survey | Brazil | Ophthalmic Conditions 56LifestyleAge Group% of sufferers Total 18-34 35-44 45-54 55-64 65 +Exercise* 61% 73% 69% 53% 43% 27%Smoke 19% 11% 21% 34% 17% 16%Drink alcohol 54% 61% 51% 59% 49% 18%Obese (BMI ≥ 30) 17% 13% 21% 19% 25% 5%*At least one day per month of vigorous exercise lasting 20 minutes or more.Quality of life6050403049.042.451.639.049.341.647.444.246.448.8 47.142.120100Total Population Age 18-34 Age 35-44 Age 45-54 Age 55-64 Age 65 +Physical summary scoreMental summary scoreWork productivity <strong>and</strong> activity impairmentAge GroupTotal 18-34 35-44 45-54 55-64 65 +Work Productivity Loss: % overallwork impairment due to health(Base: Employed Full-time)36.2 40.6 36.2 27.5 25.1 29.6Activity Impairment: % activity impairmentdue to health33.0 33.2 34.2 33.0 31.0 32.0Sufferers are self-reported.Ophthalmic Conditionswww.<strong>Kantar</strong><strong>Health</strong>.com
National <strong>Health</strong> <strong>and</strong> <strong>Wellness</strong> Survey | Brazil | Pain Conditions 57Pain ConditionsPain conditions include the adult population suffering from Arthritis, Back Problems, Broken Bones, Cancer,Dental Pain, Fibromyalgia, Headache, Herpes Zoster/Shingles, Joint Pain, Menstrual Cycle, Migraine, Neck Pain,Neuropathic Pain, Phantom Limb Pain, Post-Herpetic Neuralgia, Shoulder Pain or Stiffness, Sprains or Strains,Surgery or Other Medical Procedure <strong>and</strong> Other Pain.% of adult population with Pain conditions in BrazilAge GroupTotal 18-34 35-44 45-54 55-64 65 +Self-<strong>Report</strong>ed (% total population) 25% 26% 25% 29% 24% 15%Male 44% 47% 47% 46% 34% 29%Female 56% 53% 53% 54% 66% 71%Diagnosed (% total population) 20% 20% 20% 23% 20% 12%Male 43% 46% 45% 42% 33% 27%Female 57% 54% 55% 58% 67% 73%Total adult population: 140,086,000Medication usageAge Group% of sufferers Total 18-34 35-44 45-54 55-64 65 +Prescription only 23% 19% 19% 26% 35% 36%OTC only* 33% 36% 31% 33% 22% 28%Prescription <strong>and</strong> OTC 15% 14% 23% 11% 12% 8%No product 30% 31% 27% 30% 31% 27%*Functional foods, popular medicine, herbal products <strong>and</strong> medications purchased without a physician prescription.AttitudesJJ14% of sufferers prefer to treat themselves with an over-the-counter medication than to depend on a doctor togive them a prescription medication.JJ54% of sufferers are willing to make any lifestyle changes necessary to avoid having to take a prescriptionmedication.Pain Conditionswww.<strong>Kantar</strong><strong>Health</strong>.com
National <strong>Health</strong> <strong>and</strong> <strong>Wellness</strong> Survey | Brazil | Pain Conditions 58LifestyleAge Group% of sufferers Total 18-34 35-44 45-54 55-64 65 +Exercise* 50% 61% 51% 39% 31% 22%Smoke 20% 14% 22% 29% 34% 8%Drink alcohol 54% 59% 59% 52% 49% 14%Obese (BMI ≥ 30) 23% 17% 29% 30% 31% 19%*At least one day per month of vigorous exercise lasting 20 minutes or more.Quality of life6050403048.050.447.7 46.242.944.841.5 42.6 43.446.2 47.442.120100Total Population Age 18-34 Age 35-44 Age 45-54 Age 55-64 Age 65 +Physical summary scoreMental summary scoreWork productivity <strong>and</strong> activity impairmentAge GroupTotal 18-34 35-44 45-54 55-64 65 +Work Productivity Loss: % overallwork impairment due to health(Base: Employed Full-time)28.1 29.3 26.9 23.5 33.7 45.9Activity Impairment: % activity impairmentdue to health32.4 29.6 35.1 31.6 38.2 38.1Sufferers are self-reported.Pain Conditionswww.<strong>Kantar</strong><strong>Health</strong>.com
National <strong>Health</strong> <strong>and</strong> <strong>Wellness</strong> Survey | Brazil | Psychiatric Conditions 59Psychiatric ConditionsPsychiatric conditions include the adult population suffering from Anxiety, Attention Deficit/Hyperactivity Disorder(ADHD), Bipolar Disorder, Depression, Generalized Anxiety Disorder (GAD), Obsessive Compulsive Disorder(OCD), Phobias, Post Traumatic Stress Disorder (PTSD), Schizophrenia <strong>and</strong> Social Anxiety Disorder (SAD).% of adult population with Psychiatric conditions in BrazilAge GroupTotal 18-34 35-44 45-54 55-64 65 +Self-<strong>Report</strong>ed (% total population) 33% 39% 35% 34% 25% 7%Male 40% 41% 38% 45% 35% 30%Female 60% 59% 62% 55% 65% 70%Diagnosed (% total population) 20% 21% 24% 23% 20% 5%Male 35% 33% 33% 42% 31% 28%Female 65% 67% 67% 58% 69% 72%Total adult population: 140,086,000Medication usageAge Group% of sufferers Total 18-34 35-44 45-54 55-64 65 +Prescription only 17% 14% 16% 19% 25% 40%OTC only* 29% 29% 28% 31% 33% 25%Prescription <strong>and</strong> OTC 12% 10% 15% 13% 16% 9%No product 42% 47% 41% 37% 25% 26%*Functional foods, popular medicine, herbal products <strong>and</strong> medications purchased without a physician prescription.AttitudesJJ13% of sufferers prefer to treat themselves with an over-the-counter medication than to depend on a doctor togive them a prescription medication.JJ55% of sufferers are willing to make any lifestyle changes necessary to avoid having to take a prescriptionmedication.Psychiatric Conditionswww.<strong>Kantar</strong><strong>Health</strong>.com
National <strong>Health</strong> <strong>and</strong> <strong>Wellness</strong> Survey | Brazil | Psychiatric Conditions 60LifestyleAge Group% of sufferers Total 18-34 35-44 45-54 55-64 65 +Exercise* 55% 64% 53% 43% 38% 35%Smoke 22% 17% 22% 31% 34% 18%Drink alcohol 57% 60% 55% 57% 49% 22%Obese (BMI ≥ 30) 22% 17% 30% 23% 25% 27%*At least one day per month of vigorous exercise lasting 20 minutes or more.Quality of life60504030201050.5 52.1 50.348.2 48.440.6 39.8 40.6 41.343.6 44.943.00Total Population Age 18-34 Age 35-44 Age 45-54 Age 55-64 Age 65 +Physical summary scoreMental summary scoreWork productivity <strong>and</strong> activity impairmentAge GroupTotal 18-34 35-44 45-54 55-64 65 +Work Productivity Loss: % overallwork impairment due to health(Base: Employed Full-time)31.1 33.2 31.5 26.9 18.7 25.9Activity Impairment: % activity impairmentdue to health31.7 30.0 32.3 33.2 35.7 41.8Sufferers are self-reported.Psychiatric Conditionswww.<strong>Kantar</strong><strong>Health</strong>.com
National <strong>Health</strong> <strong>and</strong> <strong>Wellness</strong> Survey | Brazil | Respiratory Conditions 61Respiratory ConditionsRespiratory conditions include the adult population suffering from Asthma, Chronic Bronchitis, Chronic ObstructivePulmonary Disease (COPD), Cystic Fibrosis, Emphysema, Hay Fever <strong>and</strong> Nasal Allergies.% of adult population with Respiratory conditions in BrazilAge GroupTotal 18-34 35-44 45-54 55-64 65 +Self-<strong>Report</strong>ed (% total population) 26% 34% 26% 24% 20% 6%Male 41% 42% 38% 43% 41% 34%Female 59% 58% 62% 57% 59% 66%Diagnosed (% total population) 23% 29% 24% 21% 18% 6%Male 39% 40% 38% 39% 39% 31%Female 61% 60% 62% 61% 61% 69%Total adult population: 140,086,000Medication usageAge Group% of sufferers Total 18-34 35-44 45-54 55-64 65 +Prescription only 17% 17% 15% 16% 17% 47%OTC only* 39% 39% 41% 38% 42% 31%Prescription <strong>and</strong> OTC 19% 20% 19% 19% 12% 8%No product 25% 24% 25% 27% 29% 14%*Functional foods, popular medicine, herbal products <strong>and</strong> medications purchased without a physician prescription.AttitudesJJ14% of sufferers prefer to treat themselves with an over-the-counter medication than to depend on a doctor togive them a prescription medication.JJ56% of sufferers are willing to make any lifestyle changes necessary to avoid having to take a prescriptionmedication.Respiratory Conditionswww.<strong>Kantar</strong><strong>Health</strong>.com
National <strong>Health</strong> <strong>and</strong> <strong>Wellness</strong> Survey | Brazil | Respiratory Conditions 62LifestyleAge Group% of sufferers Total 18-34 35-44 45-54 55-64 65 +Exercise* 59% 66% 59% 44% 44% 40%Smoke 19% 13% 18% 34% 37% 11%Drink alcohol 56% 58% 55% 57% 50% 42%Obese (BMI ≥ 30) 20% 15% 25% 25% 25% 27%*At least one day per month of vigorous exercise lasting 20 minutes or more.Quality of life60504030201051.1 52.3 51.044.5 43.449.1 47.9 47.7 48.2 49.545.3 45.20Total Population Age 18-34 Age 35-44 Age 45-54 Age 55-64 Age 65 +Physical summary scoreMental summary scoreWork productivity <strong>and</strong> activity impairmentAge GroupTotal 18-34 35-44 45-54 55-64 65 +Work Productivity Loss: % overallwork impairment due to health(Base: Employed Full-time)25.7 26.7 24.5 23.5 26.3 43.2Activity Impairment: % activity impairmentdue to health26.6 25.5 27.1 28.0 30.4 24.6Sufferers are self-reported.Respiratory Conditionswww.<strong>Kantar</strong><strong>Health</strong>.com
National <strong>Health</strong> <strong>and</strong> <strong>Wellness</strong> Survey | Brazil | Urologic Conditions 63Urologic ConditionsUrologic conditions include the adult population suffering from Benign Prostatic Hyperplasia (BPH), ErectileDysfunction, Overactive Bladder (OAB), Premature Ejaculation <strong>and</strong> Stress Urinary Incontinence (SUI).% of adult population with Urologic conditions in BrazilAge GroupTotal 18-34 35-44 45-54 55-64 65 +Self-<strong>Report</strong>ed (% total population) 29% 30% 28% 30% 32% 21%Male 72% 66% 72% 76% 80% 83%Female 28% 34% 28% 24% 20% 17%Diagnosed (% total population) 3% 2% 3% 3% 6% 4%Male 47% 33% 40% 48% 67% 66%Female 53% 67% 60% 52% 33% 34%Total adult population: 140,086,000Medication usageAge Group% of sufferers Total 18-34 35-44 45-54 55-64 65 +Prescription only 3% 2% 1% 3% 8% 8%OTC only* 11% 10% 9% 14% 13% 14%Prescription <strong>and</strong> OTC 2% 2% 3% 2% 3% 6%No product 84% 87% 87% 82% 76% 73%*Functional foods, popular medicine, herbal products <strong>and</strong> medications purchased without a physician prescription.AttitudesJJ16% of sufferers prefer to treat themselves with an over-the-counter medication than to depend on a doctor togive them a prescription medication.JJ53% of sufferers are willing to make any lifestyle changes necessary to avoid having to take a prescriptionmedication.Urologic Conditionswww.<strong>Kantar</strong><strong>Health</strong>.com
National <strong>Health</strong> <strong>and</strong> <strong>Wellness</strong> Survey | Brazil | Urologic Conditions 64LifestyleAge Group% of sufferers Total 18-34 35-44 45-54 55-64 65 +Exercise* 56% 66% 56% 49% 49% 30%Smoke 20% 15% 21% 31% 29% 12%Drink alcohol 59% 63% 59% 61% 57% 33%Obese (BMI ≥ 30) 20% 15% 30% 26% 23% 12%*At least one day per month of vigorous exercise lasting 20 minutes or more.Quality of life60504050.2 51.944.449.7 48.2 49.642.5 44.1 45.247.647.150.23020100Total Population Age 18-34 Age 35-44 Age 45-54 Age 55-64 Age 65 +Physical summary scoreMental summary scoreWork productivity <strong>and</strong> activity impairmentAge GroupTotal 18-34 35-44 45-54 55-64 65 +Work Productivity Loss: % overallwork impairment due to health(Base: Employed Full-time)24.9 25.7 27.5 23.5 16.1 17.1Activity Impairment: % activity impairmentdue to health27.7 26.1 28.6 30.6 28.6 25.8Sufferers are self-reported.Urologic Conditionswww.<strong>Kantar</strong><strong>Health</strong>.com
Chinawww.<strong>Kantar</strong><strong>Health</strong>.com
National <strong>Health</strong> <strong>and</strong> <strong>Wellness</strong> Survey | China 66Population profileJJChina is the most populous country in the world,with an estimated 1.4 billion citizens.JJPopulation growth rates have slowed <strong>and</strong> lifeexpectancy has risen in recent decades to 75 years.JJRapid success in reducing fertility, however, hashad several important effects. China’s population isaging rapidly. One in four people living in the countryin 2035 will be aged 60 years or older.Life expectancy <strong>and</strong> causes of deathJJA decline in infectious diseases was seen between1998 <strong>and</strong> 2008, while noncommunicable diseaseconditions rose continually over the same period.The disease profile resembles that of a developedcountry, with some 80% of total deaths due tononcommunicable diseases <strong>and</strong> injuries.JJApproximately 1,000,000 deaths each year arecaused by tobacco. Male’s tobacco usage is nearlyequal to the regional average <strong>and</strong> female’s usage isslightly above the regional average.JJDespite the tremendous progress made over thepast 50 years in controlling communicable diseases,they remain a problem in China. More than 360,000children under 5 years of age die annually, withabout 70% of those deaths due to a few conditionsthat could be addressed through quality care.<strong>Health</strong>care systemJJThe state-run healthcare system is entirelycontrolled by the central government, although thereare slow moves toward decentralization.JJPatients have to be treated at designated publichospitals. Seeing a doctor can be difficult,inconvenient <strong>and</strong> expensive.JJChinese traditional medicines are still usedfrequently throughout the country.Reimbursement policiesJJMedicine costs accounted for 60% to 70% of theoverall treatment fees. The prices are fixed by thecentral government.JJAn additional basic healthcare insurance wasintroduced by the state, whereby the governmenthelps cover a basic insurance plan for rural dwellers.Chinawww.<strong>Kantar</strong><strong>Health</strong>.com
National <strong>Health</strong> <strong>and</strong> <strong>Wellness</strong> Survey | China 67General statisticsJJGross national income per capita (Intl $ 1 , 2012): 9,040JJLife expectancy at birth male/female (years): 74/77JJTotal expenditure on health per capita (Intl $, 2012): 480JJTotal expenditure on health as % of GDP (2012): 5.4%JJInternet penetration: Total population: 45.8%Lifestyle statistics 3JJTotal % of adult population that:19.6%59.8%64.3%7.2%Smokes Exercises 2 Drinks Alcohol Is Obese (BMI ≥ 30)DemographicsJJTotal population: 1,390,000,000JJArea size: 9,596,960 km 2JJDoctors (per 10,000 population): 14.7JJHospital beds (per 10,000): 38Rank City % Population1 Shanghai 1.7%2 Beijing 1.5%23423 Guangzhou 1.0%4 Tianjin 0.9%1515 Shenzhen 0.8%4531The international $ is a currency unit that is calculated using purchasing power parities (PPP), which are rates ofcurrency conversion constructed to account for differences in price level between countries.2At least one day per month of vigorous exercise lasting 20 minutes or more.3Total urban adult population: 444,643,000Chinawww.<strong>Kantar</strong><strong>Health</strong>.com
National <strong>Health</strong> <strong>and</strong> <strong>Wellness</strong> Survey | China | Autoimmune Conditions 68Autoimmune ConditionsAutoimmune conditions include the adult population suffering from Ankylosing Spondylitis, Connective TissueDisease, Idiopathic Thrombocytopenia Purpura (ITP), Inflammatory Bowel Disease (Crohn’s Disease or UlcerativeColitis), ITP, Lupus, Psoriasis, Psoriatic Arthritis, Rheumatoid Arthritis <strong>and</strong> Sjögren’s Syndrome.% of adult population with Autoimmune conditions in ChinaAge GroupTotal 18-34 35-44 45-54 55-64 65 +Self-<strong>Report</strong>ed (%total population) 10% 11% 9% 10% 9% 6%Male 57% 63% 71% 49% 44% 27%Female 43% 37% 29% 51% 56% 73%Diagnosed (% total population) 8% 9% 8% 9% 8% 5%Male 57% 64% 71% 49% 46% 28%Female 43% 36% 29% 51% 54% 72%Total urban adult population: 444,643,000Medication usageAge Group% of sufferers Total 18-34 35-44 45-54 55-64 65 +Prescription only 16% 14% 15% 13% 22% 23%OTC only* 27% 29% 30% 28% 20% 18%Prescription <strong>and</strong> OTC 39% 39% 36% 41% 43% 31%No product 19% 19% 19% 18% 15% 28%*Including over-the-counter, traditional Chinese medicine <strong>and</strong> functional foods.AttitudesJJ29% of sufferers prefer to treat themselves with an over-the-counter medication than to depend on a doctor togive them a prescription medication.JJ71% of sufferers are willing to make any lifestyle changes necessary to avoid having to take a prescriptionmedication.Autoimmune Conditionswww.<strong>Kantar</strong><strong>Health</strong>.com
National <strong>Health</strong> <strong>and</strong> <strong>Wellness</strong> Survey | China | Autoimmune Conditions 69LifestyleAge Group% of sufferers Total 18-34 35-44 45-54 55-64 65 +Exercise* 69% 73% 65% 72% 61% 60%Smoke 31% 35% 35% 28% 25% 12%Drink alcohol 79% 87% 84% 82% 68% 34%Obese (BMI ≥ 30) 8% 9% 8% 8% 7% 7%*At least one day per month of vigorous exercise lasting 20 minutes or more.Quality of life6050403048.550.4 49.347.444.9 44.741.7 39.9 41.5 43.2 43.145.320100Total Population Age 18-34 Age 35-44 Age 45-54 Age 55-64 Age 65 +Physical summary scoreMental summary scoreWork productivity <strong>and</strong> activity impairmentAge GroupTotal 18-34 35-44 45-54 55-64 65 +Work Productivity Loss: % overallwork impairment due to health(Base: Employed Full-time)40.5 42.9 38.2 37.6 41.8 65.5Activity Impairment: % activity impairmentdue to health36.3 36.3 34.8 36.2 39.8 35.2Sufferers are self-reported.Autoimmune Conditionswww.<strong>Kantar</strong><strong>Health</strong>.com
National <strong>Health</strong> <strong>and</strong> <strong>Wellness</strong> Survey | China | Cancer Conditions 70Cancer ConditionsCancer conditions include the adult population suffering from Breast Cancer, Cervical Cancer, Colorectal Cancer,Leukemia, Lymphoma, Metastatic Solid Tumor, Non-Small Cell Lung Cancer, Prostate Cancer, Small-Cell LungCancer, Uterine Cancer <strong>and</strong> Other Cancer.% of adult population with Cancer conditions in ChinaAge GroupTotal 18-34 35-44 45-54 55-64 65 +Self-<strong>Report</strong>ed (%total population) 2% 2% 1% 2% 1% 1%Male 51% 65% 56% 30% 51% 31%Female 49% 35% 44% 70% 49% 69%Diagnosed (% total population) 1% 1% 1% 1% 1% 1%Male 48% 66% 55% 30% 45% 33%Female 52% 34% 45% 70% 55% 67%Total urban adult population: 444,643,000Medication usageAge Group% of sufferers Total 18-34 35-44 45-54 55-64 65 +Using prescription 35% 29% 30% 50% 42% 36%Not using prescription 65% 71% 70% 50% 58% 65%*Including over-the-counter, traditional Chinese medicine <strong>and</strong> functional foods.AttitudesJJ33% of sufferers prefer to treat themselves with an over-the-counter medication than to depend on a doctor togive them a prescription medication.JJ54% of sufferers are willing to make any lifestyle changes necessary to avoid having to take a prescriptionmedication.Cancer Conditionswww.<strong>Kantar</strong><strong>Health</strong>.com
National <strong>Health</strong> <strong>and</strong> <strong>Wellness</strong> Survey | China | Cancer Conditions 71LifestyleAge Group% of sufferers Total 18-34 35-44 45-54 55-64 65 +Exercise* 63% 72% 57% 59% 49% 54%Smoke 37% 44% 41% 30% 44% 7%Drink alcohol 73% 89% 78% 74% 59% 16%Obese (BMI ≥ 30) 7% 9% 10% 6% 0% 7%*At least one day per month of vigorous exercise lasting 20 minutes or more.Quality of life6050403046.2 47.2 48.740.0 38.2 38.744.640.742.6 41.444.445.920100Total Population Age 18-34 Age 35-44 Age 45-54 Age 55-64 Age 65 +Physical summary scoreMental summary scoreWork productivity <strong>and</strong> activity impairmentAge GroupTotal 18-34 35-44 45-54 55-64 65 +Work Productivity Loss: % overallwork impairment due to health(Base: Employed Full-time)50.6 54.0 47.7 49.2 45.3 41.8Activity Impairment: % activity impairmentdue to health40.5 43.3 42.1 41.4 38.8 27.9Sufferers are self-reported.Cancer Conditionswww.<strong>Kantar</strong><strong>Health</strong>.com
National <strong>Health</strong> <strong>and</strong> <strong>Wellness</strong> Survey | China | Cardiovascular Conditions 72Cardiovascular ConditionsCardiovascular conditions include the adult population suffering from Angina Pectoris, Arrhythmia, Atherosclerosis,Atrial Fibrillation, Congestive Heart Failure (CHF), Deep Vein Thrombosis (DVT), Heart Attack, Heart Murmur,High Cholesterol, Hypertension, Left Ventricular Hypertrophy (LVH), Peripheral Arterial Disease (PAD), PeripheralVascular Disease (PVD), Pulmonary Embolism, Stroke or Mini-Stroke/Transient Ischemia <strong>and</strong> Unstable Angina.% of adult population with Cardiovascular conditions in ChinaAge GroupTotal 18-34 35-44 45-54 55-64 65 +Self-<strong>Report</strong>ed (%total population) 29% 18% 24% 36% 47% 41%Male 52% 64% 70% 47% 43% 39%Female 48% 36% 30% 53% 57% 61%Diagnosed (% total population) 26% 13% 21% 33% 46% 40%Male 52% 65% 71% 47% 43% 39%Female 48% 35% 29% 53% 57% 61%Total urban adult population: 444,643,000Medication usageAge Group% of sufferers Total 18-34 35-44 45-54 55-64 65 +Prescription only 32% 16% 24% 31% 36% 53%OTC only* 12% 21% 17% 11% 6% 5%Prescription <strong>and</strong> OTC 35% 27% 30% 40% 46% 28%No product 22% 36% 29% 18% 12% 13%*Including over-the-counter, traditional Chinese medicine <strong>and</strong> functional foods.AttitudesJJ29% of sufferers prefer to treat themselves with an over-the-counter medication than to depend on a doctor togive them a prescription medication.JJ67% of sufferers are willing to make any lifestyle changes necessary to avoid having to take a prescriptionmedication.Cardiovascular Conditionswww.<strong>Kantar</strong><strong>Health</strong>.com
National <strong>Health</strong> <strong>and</strong> <strong>Wellness</strong> Survey | China | Cardiovascular Conditions 73LifestyleAge Group% of sufferers Total 18-34 35-44 45-54 55-64 65 +Exercise* 61% 69% 66% 64% 59% 43%Smoke 24% 32% 32% 22% 20% 14%Drink alcohol 67% 87% 82% 71% 59% 30%Obese (BMI ≥ 30) 9% 10% 10% 10% 7% 6%*At least one day per month of vigorous exercise lasting 20 minutes or more.Quality of life6050403048.2 49.9 50.143.539.842.648.244.646.945.0 45.8 45.820100Total Population Age 18-34 Age 35-44 Age 45-54 Age 55-64 Age 65 +Physical summary scoreMental summary scoreWork productivity <strong>and</strong> activity impairmentAge GroupTotal 18-34 35-44 45-54 55-64 65 +Work Productivity Loss: % overallwork impairment due to health(Base: Employed Full-time)37.1 42.1 34.6 34.1 37.5 47.7Activity Impairment: % activity impairmentdue to health33.4 37.1 31.1 32.2 33.8 32.9Sufferers are self-reported.Cardiovascular Conditionswww.<strong>Kantar</strong><strong>Health</strong>.com
National <strong>Health</strong> <strong>and</strong> <strong>Wellness</strong> Survey | China | Gastrointestinal Conditions 74Gastrointestinal ConditionsGastrointestinal conditions include the adult population suffering from Chronic Constipation, Diarrhea, Diverticulitis,Gastroesophageal Reflux Disease (GERD), Heartburn <strong>and</strong> Irritable Bowel Syndrome (IBS).% of adult population with Gastrointestinal conditions in ChinaAge GroupTotal 18-34 35-44 45-54 55-64 65 +Self-<strong>Report</strong>ed (%total population) 16% 21% 17% 16% 14% 7%Male 51% 50% 66% 44% 42% 40%Female 49% 50% 34% 56% 58% 60%Diagnosed (% total population) 11% 14% 12% 11% 9% 5%Male 54% 53% 67% 47% 45% 37%Female 46% 47% 33% 53% 55% 63%Total urban adult population: 444,643,000Medication usageAge Group% of sufferers Total 18-34 35-44 45-54 55-64 65 +Prescription only 18% 18% 17% 17% 18% 25%OTC only* 27% 26% 31% 25% 33% 21%Prescription <strong>and</strong> OTC 24% 23% 24% 26% 22% 20%No product 31% 33% 29% 32% 27% 34%*Including over-the-counter, traditional Chinese medicine <strong>and</strong> functional foods.AttitudesJJ27% of sufferers prefer to treat themselves with an over-the-counter medication than to depend on a doctor togive them a prescription medication.JJ71% of sufferers are willing to make any lifestyle changes necessary to avoid having to take a prescriptionmedication.Gastrointestinal Conditionswww.<strong>Kantar</strong><strong>Health</strong>.com
National <strong>Health</strong> <strong>and</strong> <strong>Wellness</strong> Survey | China | Gastrointestinal Conditions 75LifestyleAge Group% of sufferers Total 18-34 35-44 45-54 55-64 65 +Exercise* 62% 64% 59% 66% 57% 50%Smoke 25% 24% 31% 20% 26% 14%Drink alcohol 75% 79% 82% 75% 65% 37%Obese (BMI ≥ 30) 9% 8% 9% 10% 9% 10%*At least one day per month of vigorous exercise lasting 20 minutes or more.Quality of life60504030201050.0 51.6 51.042.5 40.848.4 46.842.9 44.2 44.3 44.5 46.00Total Population Age 18-34 Age 35-44 Age 45-54 Age 55-64 Age 65 +Physical summary scoreMental summary scoreWork productivity <strong>and</strong> activity impairmentAge GroupTotal 18-34 35-44 45-54 55-64 65 +Work Productivity Loss: % overallwork impairment due to health(Base: Employed Full-time)33.7 35.2 31.5 31.6 37.0 60.3Activity Impairment: % activity impairmentdue to health31.4 30.8 29.1 31.5 35.6 37.5Sufferers are self-reported.Gastrointestinal Conditionswww.<strong>Kantar</strong><strong>Health</strong>.com
National <strong>Health</strong> <strong>and</strong> <strong>Wellness</strong> Survey | China | Infectious Diseases 76Infectious DiseasesInfectious Diseases include the adult population suffering from AIDS, C. Difficile, Community-Acquired Pneumonia(CAP), Genital Herpes, Genital Warts, Hospital-Acquired Pneumonia (HAP), Hepatitis A, Hepatitis B, Hepatitis C,HIV, Tuberculosis <strong>and</strong> Yeast Infection.% of adult population with Infectious Diseases in ChinaAge GroupTotal 18-34 35-44 45-54 55-64 65 +Self-<strong>Report</strong>ed (%total population) 9% 11% 12% 8% 6% 3%Male 54% 55% 61% 43% 52% 44%Female 46% 45% 39% 57% 48% 56%Diagnosed (% total population) 8% 9% 11% 7% 6% 3%Male 53% 54% 59% 42% 52% 48%Female 47% 46% 41% 58% 48% 52%Total urban adult population: 444,643,000Medication usageAge Group% of sufferers Total 18-34 35-44 45-54 55-64 65 +Using prescription 40% 40% 39% 43% 34% 38%Not using prescription 60% 60% 61% 57% 66% 62%Over-the-counter usage was not captured for Infectious Diseases.AttitudesJJ26% of sufferers prefer to treat themselves with an over-the-counter medication than to depend on a doctor togive them a prescription medication.JJ66% of sufferers are willing to make any lifestyle changes necessary to avoid having to take a prescriptionmedication.Infectious Diseaseswww.<strong>Kantar</strong><strong>Health</strong>.com
National <strong>Health</strong> <strong>and</strong> <strong>Wellness</strong> Survey | China | Infectious Diseases 77LifestyleAge Group% of sufferers Total 18-34 35-44 45-54 55-64 65 +Exercise* 63% 66% 61% 65% 59% 53%Smoke 27% 28% 26% 25% 30% 26%Drink alcohol 75% 79% 74% 79% 70% 39%Obese (BMI ≥ 30) 7% 9% 7% 4% 6% 3%*At least one day per month of vigorous exercise lasting 20 minutes or more.Quality of life6050403049.7 50.8 50.842.540.548.3 46.743.4 44.4 44.543.142.620100Total Population Age 18-34 Age 35-44 Age 45-54 Age 55-64 Age 65 +Physical summary scoreMental summary scoreWork productivity <strong>and</strong> activity impairmentAge GroupTotal 18-34 35-44 45-54 55-64 65 +Work Productivity Loss: % overallwork impairment due to health(Base: Employed Full-time)35.3 38.4 31.4 31.5 44.1 56.2Activity Impairment: % activity impairmentdue to health31.6 33.1 28.9 29.8 32.7 41.1Sufferers are self-reported.Infectious Diseaseswww.<strong>Kantar</strong><strong>Health</strong>.com
National <strong>Health</strong> <strong>and</strong> <strong>Wellness</strong> Survey | China | Metabolic Conditions 78Metabolic ConditionsMetabolic conditions include the adult population suffering from High Cholesterol, Hypertension, Obesity, ThyroidCondition, Type 1 Diabetes <strong>and</strong> Type 2 Diabetes.% of adult population with Metabolic conditions in ChinaAge GroupTotal 18-34 35-44 45-54 55-64 65 +Self-<strong>Report</strong>ed (%total population) 29% 16% 26% 36% 49% 40%Male 53% 64% 71% 48% 43% 40%Female 47% 36% 29% 52% 57% 60%Diagnosed (% total population) 23% 9% 19% 30% 43% 36%Male 53% 68% 72% 50% 44% 41%Female 47% 32% 28% 50% 56% 59%Total urban adult population: 444,643,000Medication usageAge Group% of sufferers Total 18-34 35-44 45-54 55-64 65 +Prescription only 30% 14% 22% 30% 35% 50%OTC only* 9% 13% 13% 8% 6% 6%Prescription <strong>and</strong> OTC 32% 21% 26% 37% 43% 28%No product 30% 53% 39% 24% 16% 17%*Including over-the-counter, traditional Chinese medicine <strong>and</strong> functional foods.AttitudesJJ28% of sufferers prefer to treat themselves with an over-the-counter medication than to depend on a doctor togive them a prescription medication.JJ67% of sufferers are willing to make any lifestyle changes necessary to avoid having to take a prescriptionmedication.Metabolic Conditionswww.<strong>Kantar</strong><strong>Health</strong>.com
National <strong>Health</strong> <strong>and</strong> <strong>Wellness</strong> Survey | China | Metabolic Conditions 79LifestyleAge Group% of sufferers Total 18-34 35-44 45-54 55-64 65 +Exercise* 60% 67% 62% 65% 60% 42%Smoke 23% 29% 32% 21% 20% 12%Drink alcohol 65% 82% 81% 69% 57% 31%Obese (BMI ≥ 30) 25% 42% 30% 22% 17% 13%*At least one day per month of vigorous exercise lasting 20 minutes or more.Quality of life6050403048.9 50.7 50.8 49.0 47.344.246.543.345.2 45.2 46.540.720100Total Population Age 18-34 Age 35-44 Age 45-54 Age 55-64 Age 65 +Physical summary scoreMental summary scoreWork productivity <strong>and</strong> activity impairmentAge GroupTotal 18-34 35-44 45-54 55-64 65 +Work Productivity Loss: % overallwork impairment due to health(Base: Employed Full-time)34.5 39.3 32.2 31.3 36.0 45.4Activity Impairment: % activity impairmentdue to health31.7 34.0 29.5 30.0 33.1 32.3Sufferers are self-reported.Metabolic Conditionswww.<strong>Kantar</strong><strong>Health</strong>.com
National <strong>Health</strong> <strong>and</strong> <strong>Wellness</strong> Survey | China | Musculoskeletal Conditions 80Musculoskeletal ConditionsMusculoskeletal conditions include the adult population suffering from Gout, Muscular Dystrophy, Osteoarthritis,Osteopenia, Osteoporosis <strong>and</strong> Paget’s Disease.% of adult population with Musculoskeletal conditions in ChinaAge GroupTotal 18-34 35-44 45-54 55-64 65 +Self-<strong>Report</strong>ed (%total population) 16% 9% 14% 21% 24% 20%Male 45% 58% 57% 39% 39% 32%Female 55% 42% 43% 61% 61% 68%Diagnosed (% total population) 14% 7% 12% 19% 23% 18%Male 44% 60% 56% 38% 39% 32%Female 56% 40% 44% 62% 61% 68%Total urban adult population: 444,643,000Medication usageAge Group% of sufferers Total 18-34 35-44 45-54 55-64 65 +Prescription only 10% 7% 10% 9% 8% 16%OTC only* 30% 34% 32% 30% 28% 24%Prescription <strong>and</strong> OTC 49% 44% 42% 54% 58% 44%No product 11% 15% 15% 7% 6% 15%*Including over-the-counter, traditional Chinese medicine <strong>and</strong> functional foods.AttitudesJJ29% of sufferers prefer to treat themselves with an over-the-counter medication than to depend on a doctor togive them a prescription medication.JJ69% of sufferers are willing to make any lifestyle changes necessary to avoid having to take a prescriptionmedication.Musculoskeletal Conditionswww.<strong>Kantar</strong><strong>Health</strong>.com
National <strong>Health</strong> <strong>and</strong> <strong>Wellness</strong> Survey | China | Musculoskeletal Conditions 81LifestyleAge Group% of sufferers Total 18-34 35-44 45-54 55-64 65 +Exercise* 65% 70% 68% 67% 61% 54%Smoke 24% 31% 28% 23% 22% 13%Drink alcohol 69% 85% 83% 74% 60% 32%Obese (BMI ≥ 30) 9% 8% 8% 11% 8% 7%*At least one day per month of vigorous exercise lasting 20 minutes or more.Quality of life60504030201047.4 49.0 49.343.239.647.3 45.9 44.942.5 44.2 44.5 45.30Total Population Age 18-34 Age 35-44 Age 45-54 Age 55-64 Age 65 +Physical summary scoreMental summary scoreWork productivity <strong>and</strong> activity impairmentAge GroupTotal 18-34 35-44 45-54 55-64 65 +Work Productivity Loss: % overallwork impairment due to health(Base: Employed Full-time)38.7 43.3 36.1 36.3 39.2 54.0Activity Impairment: % activity impairmentdue to health35.2 37.9 32.3 34.7 36.0 35.0Sufferers are self-reported.Musculoskeletal Conditionswww.<strong>Kantar</strong><strong>Health</strong>.com
National <strong>Health</strong> <strong>and</strong> <strong>Wellness</strong> Survey | China | Neurological Conditions 82Neurological ConditionsNeurological conditions include the adult population suffering from Epilepsy, Hemiplegia, Migraine, MultipleSclerosis, Parkinson’s Disease <strong>and</strong> Restless Legs Syndrome (RLS).% of adult population with Neurological conditions in ChinaAge GroupTotal 18-34 35-44 45-54 55-64 65 +Self-<strong>Report</strong>ed (%total population) 16% 20% 16% 17% 13% 8%Male 46% 49% 56% 40% 36% 37%Female 54% 51% 44% 60% 64% 63%Diagnosed (% total population) 11% 12% 10% 13% 10% 6%Male 47% 53% 56% 39% 35% 34%Female 53% 47% 44% 61% 65% 66%Total urban adult population: 444,643,000Medication usageAge Group% of sufferers Total 18-34 35-44 45-54 55-64 65 +Prescription only 11% 8% 10% 12% 17% 24%OTC only* 32% 36% 32% 29% 29% 21%Prescription <strong>and</strong> OTC 24% 23% 21% 29% 27% 19%No product 33% 34% 36% 30% 27% 36%*Including over-the-counter, traditional Chinese medicine <strong>and</strong> functional foods.AttitudesJJ29% of sufferers prefer to treat themselves with an over-the-counter medication than to depend on a doctor togive them a prescription medication.JJ68% of sufferers are willing to make any lifestyle changes necessary to avoid having to take a prescriptionmedication.Neurological Conditionswww.<strong>Kantar</strong><strong>Health</strong>.com
National <strong>Health</strong> <strong>and</strong> <strong>Wellness</strong> Survey | China | Neurological Conditions 83LifestyleAge Group% of sufferers Total 18-34 35-44 45-54 55-64 65 +Exercise* 65% 67% 62% 66% 63% 64%Smoke 25% 25% 29% 23% 27% 15%Drink alcohol 76% 82% 82% 75% 67% 33%Obese (BMI ≥ 30) 9% 9% 9% 10% 9% 10%*At least one day per month of vigorous exercise lasting 20 minutes or more.Quality of life60504030201049.1 50.9 50.441.7 40.147.445.5 44.442.0 43.0 43.6 44.20Total Population Age 18-34 Age 35-44 Age 45-54 Age 55-64 Age 65 +Physical summary scoreMental summary scoreWork productivity <strong>and</strong> activity impairmentAge GroupTotal 18-34 35-44 45-54 55-64 65 +Work Productivity Loss: % overallwork impairment due to health(Base: Employed Full-time)37.2 38.7 33.7 36.4 44.0 41.6Activity Impairment: % activity impairmentdue to health34.0 33.5 30.8 36.0 38.0 35.5Sufferers are self-reported.Neurological Conditionswww.<strong>Kantar</strong><strong>Health</strong>.com
National <strong>Health</strong> <strong>and</strong> <strong>Wellness</strong> Survey | China | Ophthalmic Conditions 84Ophthalmic ConditionsOphthalmic conditions include the adult population suffering from Cataracts, Dry Eye, Glaucoma <strong>and</strong> MacularDegeneration.% of adult population with Ophthalmic conditions in ChinaAge GroupTotal 18-34 35-44 45-54 55-64 65 +Self-<strong>Report</strong>ed (%total population) 8% 8% 8% 9% 9% 8%Male 53% 59% 65% 42% 44% 45%Female 47% 41% 35% 58% 56% 55%Diagnosed (% total population) 6% 5% 6% 6% 7% 7%Male 52% 60% 62% 42% 41% 44%Female 48% 40% 38% 58% 59% 56%Total urban adult population: 444,643,000Medication usageAge Group% of sufferers Total 18-34 35-44 45-54 55-64 65 +Prescription only 17% 12% 13% 14% 26% 32%OTC only* 31% 34% 36% 34% 25% 14%Prescription <strong>and</strong> OTC 27% 33% 26% 29% 25% 7%No product 26% 21% 25% 23% 24% 48%*Including over-the-counter, traditional Chinese medicine <strong>and</strong> functional foods.AttitudesJJ30% of sufferers prefer to treat themselves with an over-the-counter medication than to depend on a doctor togive them a prescription medication.JJ69% of sufferers are willing to make any lifestyle changes necessary to avoid having to take a prescriptionmedication.Ophthalmic Conditionswww.<strong>Kantar</strong><strong>Health</strong>.com
National <strong>Health</strong> <strong>and</strong> <strong>Wellness</strong> Survey | China | Ophthalmic Conditions 85LifestyleAge Group% of sufferers Total 18-34 35-44 45-54 55-64 65 +Exercise* 65% 71% 61% 68% 60% 56%Smoke 26% 30% 27% 25% 22% 20%Drink alcohol 77% 87% 86% 78% 66% 39%Obese (BMI ≥ 30) 8% 7% 7% 8% 9% 7%*At least one day per month of vigorous exercise lasting 20 minutes or more.Quality of life6050403048.9 50.1 50.247.9 47.1 45.4 46.5 46.242.239.6 41.5 43.020100Total Population Age 18-34 Age 35-44 Age 45-54 Age 55-64 Age 65 +Physical summary scoreMental summary scoreWork productivity <strong>and</strong> activity impairmentAge GroupTotal 18-34 35-44 45-54 55-64 65 +Work Productivity Loss: % overallwork impairment due to health(Base: Employed Full-time)39.0 42.6 35.3 36.9 38.8 52.3Activity Impairment: % activity impairmentdue to health34.2 36.9 32.7 33.6 33.7 31.2Sufferers are self-reported.Ophthalmic Conditionswww.<strong>Kantar</strong><strong>Health</strong>.com
National <strong>Health</strong> <strong>and</strong> <strong>Wellness</strong> Survey | China | Pain Conditions 86Pain ConditionsPain conditions include the adult population suffering from Arthritis, Back Problems, Bladder Pain, Broken Bones,Cancer, Carpal Tunnel Syndrome, Dental Pain, Diabetic Neuropathic Pain, Fibromyalgia, Headache, HerpesZoster/Shingles, Hip/Pelvic Pain, Joint Pain, Lower Back Pain, Menstrual Cycle, Migraine, Neck Pain, NeuropathicPain, Phantom Limb Pain, Pinched Nerve in Lower Back, Plantar Fasciitis, Post-Herpetic Neuralgia, Shoulder Painor Stiffness, Spinal Disk, Sprains or Strains, Surgery or Other Medical Procedure, Tendonitis <strong>and</strong> Other Pain.% of adult population with Pain conditions in ChinaAge GroupTotal 18-34 35-44 45-54 55-64 65 +Self-<strong>Report</strong>ed (%total population) 15% 18% 15% 14% 14% 8%Male 54% 55% 67% 44% 49% 35%Female 46% 45% 33% 56% 51% 65%Diagnosed (% total population) 10% 11% 10% 10% 11% 6%Male 55% 59% 67% 43% 49% 35%Female 45% 41% 33% 57% 51% 65%Total urban adult population: 444,643,000Medication usageAge Group% of sufferers Total 18-34 35-44 45-54 55-64 65 +Prescription only 12% 9% 11% 14% 15% 20%OTC only* 34% 37% 35% 33% 27% 29%Prescription <strong>and</strong> OTC 20% 20% 18% 18% 23% 22%No product 34% 34% 36% 35% 35% 29%*Including over-the-counter, traditional Chinese medicine <strong>and</strong> functional foods.AttitudesJJ28% of sufferers prefer to treat themselves with an over-the-counter medication than to depend on a doctor togive them a prescription medication.JJ70% of sufferers are willing to make any lifestyle changes necessary to avoid having to take a prescriptionmedication.Pain Conditionswww.<strong>Kantar</strong><strong>Health</strong>.com
National <strong>Health</strong> <strong>and</strong> <strong>Wellness</strong> Survey | China | Pain Conditions 87LifestyleAge Group% of sufferers Total 18-34 35-44 45-54 55-64 65 +Exercise* 62% 67% 61% 61% 53% 46%Smoke 25% 23% 30% 25% 27% 17%Drink alcohol 76% 82% 81% 74% 68% 36%Obese (BMI ≥ 30) 8% 8% 9% 8% 8% 8%*At least one day per month of vigorous exercise lasting 20 minutes or more.Quality of life60504030201049.051.0 49.847.445.242.544.641.1 42.6 43.6 44.0 45.70Total Population Age 18-34 Age 35-44 Age 45-54 Age 55-64 Age 65 +Physical summary scoreMental summary scoreWork productivity <strong>and</strong> activity impairmentAge GroupTotal 18-34 35-44 45-54 55-64 65 +Work Productivity Loss: % overallwork impairment due to health(Base: Employed Full-time)35.8 37.2 33.2 34.8 39.1 49.4Activity Impairment: % activity impairmentdue to health33.2 32.4 30.9 33.4 37.1 38.1Sufferers are self-reported.Pain Conditionswww.<strong>Kantar</strong><strong>Health</strong>.com
National <strong>Health</strong> <strong>and</strong> <strong>Wellness</strong> Survey | China | Psychiatric Conditions 88Psychiatric ConditionsPsychiatric conditions include the adult population suffering from Anxiety, Attention Deficit/Hyperactivity Disorder(ADHD), Bipolar Disorder, Depression, Generalized Anxiety Disorder (GAD), Obsessive Compulsive Disorder(OCD), Phobias, Post Traumatic Stress Disorder (PTSD), Schizophrenia <strong>and</strong> Social Anxiety Disorder (SAD).% of adult population with Psychiatric conditions in ChinaAge GroupTotal 18-34 35-44 45-54 55-64 65 +Self-<strong>Report</strong>ed (%total population) 13% 21% 13% 11% 8% 2%Male 55% 57% 67% 40% 42% 43%Female 45% 43% 33% 60% 58% 57%Diagnosed (% total population) 7% 10% 6% 6% 5% 2%Male 56% 65% 66% 35% 42% 34%Female 44% 35% 34% 65% 58% 66%Total urban adult population: 444,643,000Medication usageAge Group% of sufferers Total 18-34 35-44 45-54 55-64 65 +Prescription only 6% 5% 6% 7% 10% 19%OTC only* 36% 38% 33% 36% 34% 33%Prescription <strong>and</strong> OTC 18% 18% 16% 20% 27% 27%No product 39% 40% 45% 37% 29% 20%*Including over-the-counter, traditional Chinese medicine <strong>and</strong> functional foods.AttitudesJJ30% of sufferers prefer to treat themselves with an over-the-counter medication than to depend on a doctor togive them a prescription medication.JJ69% of sufferers are willing to make any lifestyle changes necessary to avoid having to take a prescriptionmedication.Psychiatric Conditionswww.<strong>Kantar</strong><strong>Health</strong>.com
National <strong>Health</strong> <strong>and</strong> <strong>Wellness</strong> Survey | China | Psychiatric Conditions 89LifestyleAge Group% of sufferers Total 18-34 35-44 45-54 55-64 65 +Exercise* 67% 68% 65% 66% 68% 57%Smoke 29% 28% 32% 25% 35% 25%Drink alcohol 83% 84% 86% 83% 75% 64%Obese (BMI ≥ 30) 9% 8% 8% 10% 14% 11%*At least one day per month of vigorous exercise lasting 20 minutes or more.Quality of life6050403049.4 51.1 49.546.744.6 43.138.6 38.1 38.3 40.0 40.4 39.320100Total Population Age 18-34 Age 35-44 Age 45-54 Age 55-64 Age 65 +Physical summary scoreMental summary scoreWork productivity <strong>and</strong> activity impairmentAge GroupTotal 18-34 35-44 45-54 55-64 65 +Work Productivity Loss: % overallwork impairment due to health(Base: Employed Full-time)42.3 41.8 40.6 43.7 49.0 63.9Activity Impairment: % activity impairmentdue to health37.4 35.8 36.7 41.2 42.1 42.7Sufferers are self-reported.Psychiatric Conditionswww.<strong>Kantar</strong><strong>Health</strong>.com
National <strong>Health</strong> <strong>and</strong> <strong>Wellness</strong> Survey | China | Respiratory Conditions 90Respiratory ConditionsRespiratory conditions include the adult population suffering from Asthma, Chronic Bronchitis, Chronic ObstructivePulmonary Disease (COPD), Cystic Fibrosis, Emphysema, Hay Fever <strong>and</strong> Nasal Allergies.% of adult population with Respiratory conditions in ChinaAge GroupTotal 18-34 35-44 45-54 55-64 65 +Self-<strong>Report</strong>ed (%total population) 14% 17% 16% 12% 10% 6%Male 58% 58% 68% 48% 57% 43%Female 42% 42% 32% 52% 43% 57%Diagnosed (% total population) 12% 15% 14% 11% 9% 5%Male 58% 59% 68% 47% 56% 42%Female 42% 41% 32% 53% 44% 58%Total urban adult population: 444,643,000Medication usageAge Group% of sufferers Total 18-34 35-44 45-54 55-64 65 +Prescription only 14% 9% 14% 16% 18% 34%OTC only* 33% 33% 36% 32% 29% 19%Prescription <strong>and</strong> OTC 39% 43% 35% 36% 41% 34%No product 15% 15% 14% 16% 13% 13%*Including over-the-counter, traditional Chinese medicine <strong>and</strong> functional foods.AttitudesJJ27% of sufferers prefer to treat themselves with an over-the-counter medication than to depend on a doctor togive them a prescription medication.JJ67% of sufferers are willing to make any lifestyle changes necessary to avoid having to take a prescriptionmedication.Respiratory Conditionswww.<strong>Kantar</strong><strong>Health</strong>.com
National <strong>Health</strong> <strong>and</strong> <strong>Wellness</strong> Survey | China | Respiratory Conditions 91LifestyleAge Group% of sufferers Total 18-34 35-44 45-54 55-64 65 +Exercise* 63% 68% 60% 66% 57% 41%Smoke 27% 27% 29% 24% 34% 20%Drink alcohol 78% 81% 81% 78% 69% 42%Obese (BMI ≥ 30) 8% 8% 8% 8% 11% 9%*At least one day per month of vigorous exercise lasting 20 minutes or more.Quality of life60504030201050.1 51.6 51.143.3 41.848.344.3 44.346.344.5 44.9 45.00Total Population Age 18-34 Age 35-44 Age 45-54 Age 55-64 Age 65 +Physical summary scoreMental summary scoreWork productivity <strong>and</strong> activity impairmentAge GroupTotal 18-34 35-44 45-54 55-64 65 +Work Productivity Loss: % overallwork impairment due to health(Base: Employed Full-time)34.5 37.2 30.1 32.6 39.5 51.2Activity Impairment: % activity impairmentdue to health31.2 30.9 28.0 31.8 35.1 39.3Sufferers are self-reported.Respiratory Conditionswww.<strong>Kantar</strong><strong>Health</strong>.com
National <strong>Health</strong> <strong>and</strong> <strong>Wellness</strong> Survey | China | Urologic Conditions 92Urologic ConditionsUrologic conditions include the adult population suffering from Benign Prostatic Hyperplasia (BPH), ErectileDysfunction, Overactive Bladder (OAB), Premature Ejaculation, Stress Urinary Incontinence (SUI) <strong>and</strong> Urinary TractInfection.% of adult population with Urologic conditions in ChinaAge GroupTotal 18-34 35-44 45-54 55-64 65 +Self-<strong>Report</strong>ed (%total population) 26% 27% 31% 25% 25% 15%Male 90% 90% 91% 87% 90% 95%Female 10% 10% 9% 13% 10% 5%Diagnosed (% total population) 6% 6% 6% 7% 8% 4%Male 67% 66% 66% 64% 69% 84%Female 33% 34% 34% 36% 31% 16%Total urban adult population: 444,643,000Medication usageAge Group% of sufferers Total 18-34 35-44 45-54 55-64 65 +Prescription only 7% 7% 6% 8% 9% 5%OTC only* 18% 18% 18% 19% 21% 11%Prescription <strong>and</strong> OTC 7% 9% 5% 6% 7% 5%No product 68% 66% 71% 67% 63% 79%*Including over-the-counter, traditional Chinese medicine <strong>and</strong> functional foods.AttitudesJJ29% of sufferers prefer to treat themselves with an over-the-counter medication than to depend on a doctor togive them a prescription medication.JJ64% of sufferers are willing to make any lifestyle changes necessary to avoid having to take a prescriptionmedication.Urologic Conditionswww.<strong>Kantar</strong><strong>Health</strong>.com
National <strong>Health</strong> <strong>and</strong> <strong>Wellness</strong> Survey | China | Urologic Conditions 93LifestyleAge Group% of sufferers Total 18-34 35-44 45-54 55-64 65 +Exercise* 62% 66% 60% 62% 62% 47%Smoke 35% 36% 36% 37% 35% 21%Drink alcohol 83% 88% 85% 84% 79% 57%Obese (BMI ≥ 30) 7% 8% 9% 6% 7% 5%*At least one day per month of vigorous exercise lasting 20 minutes or more.Quality of life60504030201050.2 51.5 51.1 49.643.143.240.645.147.444.9 46.3 46.20Total Population Age 18-34 Age 35-44 Age 45-54 Age 55-64 Age 65 +Physical summary scoreMental summary scoreWork productivity <strong>and</strong> activity impairmentAge GroupTotal 18-34 35-44 45-54 55-64 65 +Work Productivity Loss: % overallwork impairment due to health(Base: Employed Full-time)34.0 38.0 31.3 30.8 34.9 33.3Activity Impairment: % activity impairmentdue to health31.7 33.9 29.3 29.0 33.5 34.6Sufferers are self-reported.Urologic Conditionswww.<strong>Kantar</strong><strong>Health</strong>.com
Francewww.<strong>Kantar</strong><strong>Health</strong>.com
National <strong>Health</strong> <strong>and</strong> <strong>Wellness</strong> Survey | France 95Population profileJJ86% of the French population live in an urbansetting, slightly higher than the average for the restof Europe.JJThere is an increasing proportion of elderly peoplein the population. By 2030, an estimated 22% of thepopulation in France will be aged 65+ years.JJFrance’s birth rate has remained relativelyconsistent since 2007 <strong>and</strong> is now equal to theEuropean average.Life expectancy <strong>and</strong> causes of deathJJLife expectancy at birth in France is increasingsteadily, gaining a full year between 2003-2004.The gap between male <strong>and</strong> female life expectancyremains high, although it is narrowing.JJThe main causes of death in France are cancer,cardiovascular diseases, accidents <strong>and</strong> diseases ofthe respiratory system.JJThe French trends in improving health status,reflected by the increase in life expectancy <strong>and</strong> thedecrease in infant mortality, have not been equallybeneficial across socioeconomic groups, with thegreatest improvement being observed among themost well-off.<strong>Health</strong>care systemJJStatutory health insurance (SHI) currently coversalmost 100% of the resident population (both legal<strong>and</strong> illegal).JJJurisdiction in terms of health policy <strong>and</strong> regulationof the healthcare system is divided among the statebetween parliament, the government <strong>and</strong> variousministries. Local communities are also involved to alesser extent, particularly at the regional level.JJThe delivery of care is shared among private, feefor-servicephysicians, private for-profit hospitals,private non-profit hospitals <strong>and</strong> public hospitals.Reimbursement policiesJJMedicine costs accounted for 60% to 70% of theoverall treatment fees. The prices are fixed by thecentral government.JJAn additional basic healthcare insurance wasintroduced by the state, whereby the governmenthelps cover a basic insurance plan for rural dwellers.Francewww.<strong>Kantar</strong><strong>Health</strong>.com
National <strong>Health</strong> <strong>and</strong> <strong>Wellness</strong> Survey | France 96General statisticsJJGross national income per capita (Intl $ 1 , 2012): 36,720JJLife expectancy at birth male/female (years): 79/85JJTotal expenditure on health per capita (Intl $, 2012): 4,260JJTotal expenditure on health as % of GDP (2012): 11.8%JJInternet penetration: Total population: 81.9%Lifestyle statistics 3JJTotal % of adult population that:22.9%14.6%58.3%80.1%Smokes Exercises 2 Drinks Alcohol Is Obese (BMI ≥ 30)DemographicsJJTotal population: 63,937,000JJArea size: 643,427 km 2JJDoctors (per 10,000 population): 31.6JJHospital beds (per 10,000 population): 66Rank City % Population1 Paris 3.6%12 Marseille 1.3%3 Lyon 0.8%34 Toulouse 0.7%4255 Nice 0.6%1The international $ is a currency unit that is calculated using purchasing power parities (PPP), which are rates ofcurrency conversion constructed to account for differences in price level between countries.2At least one day per month of vigorous exercise lasting 20 minutes or more.3Adult population: 51,025,000Francewww.<strong>Kantar</strong><strong>Health</strong>.com
National <strong>Health</strong> <strong>and</strong> <strong>Wellness</strong> Survey | France | Autoimmune Conditions 97Autoimmune ConditionsAutoimmune conditions include the adult population suffering from Ankylosing Spondylitis, Connective TissueDisease, Idiopathic Thrombocytopenia Purpura (ITP), Inflammatory Bowel Disease (Crohn’s Disease or UlcerativeColitis), Lupus, Psoriasis, Psoriatic Arthritis, Rheumatoid Arthritis <strong>and</strong> Sjögren’s Syndrome.% of adult population with Autoimmune conditions in FranceAge GroupTotal 18-34 35-44 45-54 55-64 65 +Self-<strong>Report</strong>ed (% total population) 8% 6% 8% 10% 9% 9%Male 45% 36% 49% 50% 46% 46%Female 55% 64% 51% 50% 54% 55%Diagnosed (% total population) 8% 6% 8% 10% 9% 8%Male 45% 35% 50% 50% 45% 44%Female 55% 65% 50% 50% 55% 56%Total adult population: 51,025,000Medication usageAge Group% of sufferers Total 18-34 35-44 45-54 55-64 65 +Prescription only 45% 37% 39% 44% 49% 55%OTC only* 7% 8% 10% 8% 5% 3%Prescription <strong>and</strong> OTC 5% 5% 5% 5% 5% 4%No product 43% 49% 47% 42% 41% 38%*Including over-the-counter <strong>and</strong> herbal products.AttitudesJJ15% of sufferers prefer to treat themselves with an over-the-counter medication than to depend on a doctor togive them a prescription medication.JJ53% of sufferers are willing to make any lifestyle changes necessary to avoid having to take a prescriptionmedication.Autoimmune Conditionswww.<strong>Kantar</strong><strong>Health</strong>.com
National <strong>Health</strong> <strong>and</strong> <strong>Wellness</strong> Survey | France | Autoimmune Conditions 98LifestyleAge Group% of sufferers Total 18-34 35-44 45-54 55-64 65 +Exercise* 56% 65% 59% 51% 52% 54%Smoke 27% 34% 28% 35% 22% 17%Drink alcohol 81% 77% 80% 84% 77% 86%Obese (BMI ≥ 30) 17% 9% 20% 20% 23% 13%*At least one day per month of vigorous exercise lasting 20 minutes or more.Quality of life6050403048.542.451.4 51.139.649.241.8 41.445.6 45.843.445.420100Total Population Age 18-34 Age 35-44 Age 45-54 Age 55-64 Age 65 +Physical summary scoreMental summary scoreWork productivity <strong>and</strong> activity impairmentAge GroupTotal 18-34 35-44 45-54 55-64 65 +Work Productivity Loss: % overallwork impairment due to health(Base: Employed Full-time)27.4 31.4 23.6 27.2 26.2 88.0Activity Impairment: % activity impairmentdue to health33.6 30.5 27.6 34.0 37.7 37.6Sufferers are self-reported.Autoimmune Conditionswww.<strong>Kantar</strong><strong>Health</strong>.com
National <strong>Health</strong> <strong>and</strong> <strong>Wellness</strong> Survey | France | Cancer Conditions 99Cancer ConditionsCancer conditions include the adult population suffering from Breast Cancer, Cervical Cancer, Colorectal Cancer,Leukemia, Lymphoma, Metastatic Solid Tumor, Non-Small Cell Lung Cancer, Prostate Cancer, Small-Cell LungCancer, Uterine Cancer <strong>and</strong> Other Cancer.% of adult population with Cancer conditions in FranceAge GroupTotal 18-34 35-44 45-54 55-64 65 +Self-<strong>Report</strong>ed (% total population) 5% 1% 2% 4% 7% 13%Male 39% 47% 49% 24% 46% 38%Female 61% 53% 51% 76% 54% 62%Diagnosed (% total population) 5% 1% 2% 4% 7% 12%Male 39% 40% 49% 24% 46% 38%Female 61% 60% 51% 76% 54% 62%Total adult population: 51,025,000Medication usageAge Group% of sufferers Total 18-34 35-44 45-54 55-64 65 +Using prescription 26% 31% 34% 33% 21% 25%Not using prescription 74% 69% 66% 67% 79% 75%Over-the-counter usage was not captured for Cancer.AttitudesJJ10% of sufferers prefer to treat themselves with an over-the-counter medication than to depend on a doctor togive them a prescription medication.JJ51% of sufferers are willing to make any lifestyle changes necessary to avoid having to take a prescriptionmedication.Autoimmune Conditionswww.<strong>Kantar</strong><strong>Health</strong>.com
National <strong>Health</strong> <strong>and</strong> <strong>Wellness</strong> Survey | France | Cancer Conditions 100LifestyleAge Group% of sufferers Total 18-34 35-44 45-54 55-64 65 +Exercise* 53% 72% 61% 47% 52% 53%Smoke 17% 48% 35% 21% 19% 10%Drink alcohol 81% 81% 86% 79% 83% 80%Obese (BMI ≥ 30) 18% 7% 19% 15% 18% 20%*At least one day per month of vigorous exercise lasting 20 minutes or more.Quality of life60504030201046.9 47.4 46.7 47.5 48.143.941.942.139.344.5 46.2 44.80Total Population Age 18-34 Age 35-44 Age 45-54 Age 55-64 Age 65 +Physical summary scoreMental summary scoreWork productivity <strong>and</strong> activity impairmentAge GroupTotal 18-34 35-44 45-54 55-64 65 +Work Productivity Loss: % overallwork impairment due to health(Base: Employed Full-time)34.0 35.8 38.8 33.8 29.7 0.0Activity Impairment: % activity impairmentdue to health37.4 35.7 41.1 37.2 35.4 38.0Sufferers are self-reported.Cancer Conditionswww.<strong>Kantar</strong><strong>Health</strong>.com
National <strong>Health</strong> <strong>and</strong> <strong>Wellness</strong> Survey | France | Cardiovascular Conditions 101Cardiovascular ConditionsCardiovascular conditions include the adult population suffering from Angina Pectoris, Arrhythmia, Atherosclerosis,Atrial Fibrillation, Congestive Heart Failure (CHF), Deep Vein Thrombosis (DVT), Heart Attack, Heart Murmur,High Cholesterol, Hypertension, Left Ventricular Hypertrophy (LVH), Peripheral Arterial Disease (PAD), PeripheralVascular Disease (PVD), Pulmonary Embolism, Stroke or Mini-Stroke/Transient Ischemia <strong>and</strong> Unstable Angina.% of adult population with Cardiovascular conditions in FranceAge GroupTotal 18-34 35-44 45-54 55-64 65 +Self-<strong>Report</strong>ed (% total population) 32% 18% 22% 32% 42% 50%Male 49% 45% 52% 49% 57% 46%Female 51% 55% 48% 51% 43% 54%Diagnosed (% total population) 30% 15% 21% 30% 41% 49%Male 49% 42% 51% 49% 57% 47%Female 51% 58% 49% 51% 43% 53%Total adult population: 51,025,000Medication usageAge Group% of sufferers Total 18-34 35-44 45-54 55-64 65 +Prescription only 54% 11% 24% 48% 68% 76%OTC only* 4% 7% 6% 4% 3% 2%Prescription <strong>and</strong> OTC 4% 4% 4% 4% 4% 5%No product 38% 78% 66% 44% 25% 16%*Including over-the-counter <strong>and</strong> herbal products.AttitudesJJ11% of sufferers prefer to treat themselves with an over-the-counter medication than to depend on a doctor togive them a prescription medication.JJ53% of sufferers are willing to make any lifestyle changes necessary to avoid having to take a prescriptionmedication.Cardiovascular Conditionswww.<strong>Kantar</strong><strong>Health</strong>.com
National <strong>Health</strong> <strong>and</strong> <strong>Wellness</strong> Survey | France | Cardiovascular Conditions 102LifestyleAge Group% of sufferers Total 18-34 35-44 45-54 55-64 65 +Exercise* 55% 66% 56% 52% 54% 52%Smoke 21% 29% 30% 29% 19% 11%Drink alcohol 82% 78% 82% 81% 83% 84%Obese (BMI ≥ 30) 21% 10% 19% 25% 27% 22%*At least one day per month of vigorous exercise lasting 20 minutes or more.Quality of life6050403049.644.152.7 51.649.6 49.245.647.9 46.640.3 41.8 42.020100Total Population Age 18-34 Age 35-44 Age 45-54 Age 55-64 Age 65 +Physical summary scoreMental summary scoreWork productivity <strong>and</strong> activity impairmentAge GroupTotal 18-34 35-44 45-54 55-64 65 +Work Productivity Loss: % overallwork impairment due to health(Base: Employed Full-time)23.8 26.7 22.5 24.1 22.0 20.3Activity Impairment: % activity impairmentdue to health29.8 27.7 26.5 30.9 29.0 31.7Sufferers are self-reported.Cardiovascular Conditionswww.<strong>Kantar</strong><strong>Health</strong>.com
National <strong>Health</strong> <strong>and</strong> <strong>Wellness</strong> Survey | France | Gastrointestinal Conditions 103Gastrointestinal ConditionsGastrointestinal conditions include the adult population suffering from Chronic Constipation, Diarrhea, Diverticulitis,Gastroesophageal Reflux Disease (GERD), Heartburn <strong>and</strong> Irritable Bowel Syndrome (IBS).% of adult population with Gastrointestinal conditions in FranceAge GroupTotal 18-34 35-44 45-54 55-64 65 +Self-<strong>Report</strong>ed (% total population) 31% 29% 30% 33% 33% 34%Male 40% 36% 46% 40% 43% 37%Female 60% 64% 54% 60% 57% 63%Diagnosed (% total population) 23% 17% 21% 24% 26% 28%Male 37% 33% 41% 38% 42% 35%Female 63% 67% 59% 62% 58% 65%Total adult population: 51,025,000Medication usageAge Group% of sufferers Total 18-34 35-44 45-54 55-64 65 +Prescription only 32% 19% 23% 33% 42% 45%OTC only* 21% 24% 28% 22% 18% 16%Prescription <strong>and</strong> OTC 10% 6% 11% 10% 12% 11%No product 37% 51% 38% 34% 29% 28%*Including over-the-counter <strong>and</strong> herbal products.AttitudesJJ15% of sufferers prefer to treat themselves with an over-the-counter medication than to depend on a doctor togive them a prescription medication.JJ54% of sufferers are willing to make any lifestyle changes necessary to avoid having to take a prescriptionmedication.Gastrointestinal Conditionswww.<strong>Kantar</strong><strong>Health</strong>.com
National <strong>Health</strong> <strong>and</strong> <strong>Wellness</strong> Survey | France | Gastrointestinal Conditions 104LifestyleAge Group% of sufferers Total 18-34 35-44 45-54 55-64 65 +Exercise* 56% 66% 57% 53% 51% 51%Smoke 24% 31% 32% 29% 19% 12%Drink alcohol 81% 76% 80% 81% 83% 83%Obese (BMI ≥ 30) 19% 13% 19% 21% 24% 20%*At least one day per month of vigorous exercise lasting 20 minutes or more.Quality of life6050403050.042.353.2 51.649.2 48.5 47.243.7 45.040.3 41.3 41.020100Total Population Age 18-34 Age 35-44 Age 45-54 Age 55-64 Age 65 +Physical summary scoreMental summary scoreWork productivity <strong>and</strong> activity impairmentAge GroupTotal 18-34 35-44 45-54 55-64 65 +Work Productivity Loss: % overallwork impairment due to health(Base: Employed Full-time)24.7 24.8 24.3 26.1 22.6 13.6Activity Impairment: % activity impairmentdue to health30.5 26.5 28.4 32.7 31.7 33.8Sufferers are self-reported.Gastrointestinal Conditionswww.<strong>Kantar</strong><strong>Health</strong>.com
National <strong>Health</strong> <strong>and</strong> <strong>Wellness</strong> Survey | France | Infectious Diseases 105Infectious DiseasesInfectious Diseases include the adult population suffering from AIDS, C. Difficile, Community-Acquired Pneumonia(CAP), Genital Herpes, Genital Warts, Hospital-Acquired Pneumonia (HAP), Hepatitis A, Hepatitis B, Hepatitis C,HIV, Tuberculosis <strong>and</strong> Yeast Infection.% of adult population with Infectious Diseases in FranceAge GroupTotal 18-34 35-44 45-54 55-64 65 +Self-<strong>Report</strong>ed (% total population) 6% 4% 5% 6% 7% 8%Male 44% 38% 52% 46% 50% 37%Female 56% 62% 49% 54% 50% 63%Diagnosed (% total population) 5% 3% 5% 6% 7% 7%Male 44% 33% 52% 47% 50% 40%Female 56% 67% 48% 53% 50% 60%Total adult population: 51,025,000Medication usageAge Group% of sufferers Total 18-34 35-44 45-54 55-64 65 +Using prescription 20% 22% 25% 22% 17% 17%Not using prescription 80% 78% 75% 78% 83% 83%Over-the-counter usage was not captured for Infectious Diseases.AttitudesJJ13% of sufferers prefer to treat themselves with an over-the-counter medication than to depend on a doctor togive them a prescription medication.JJ56% of sufferers are willing to make any lifestyle changes necessary to avoid having to take a prescriptionmedication.Infectious Diseaseswww.<strong>Kantar</strong><strong>Health</strong>.com
National <strong>Health</strong> <strong>and</strong> <strong>Wellness</strong> Survey | France | Infectious Diseases 106LifestyleAge Group% of sufferers Total 18-34 35-44 45-54 55-64 65 +Exercise* 53% 63% 56% 50% 49% 50%Smoke 26% 35% 36% 38% 20% 11%Drink alcohol 83% 76% 83% 81% 83% 86%Obese (BMI ≥ 30) 14% 9% 9% 17% 15% 16%*At least one day per month of vigorous exercise lasting 20 minutes or more.Quality of life6050403049.342.752.7 51.248.9 48.344.947.245.039.8 40.6 41.020100Total Population Age 18-34 Age 35-44 Age 45-54 Age 55-64 Age 65 +Physical summary scoreMental summary scoreWork productivity <strong>and</strong> activity impairmentAge GroupTotal 18-34 35-44 45-54 55-64 65 +Work Productivity Loss: % overallwork impairment due to health(Base: Employed Full-time)25.2 27.2 27.0 24.9 20.3 9.0Activity Impairment: % activity impairmentdue to health31.6 25.1 29.3 34.5 31.7 34.7Sufferers are self-reported.Infectious Diseaseswww.<strong>Kantar</strong><strong>Health</strong>.com
National <strong>Health</strong> <strong>and</strong> <strong>Wellness</strong> Survey | France | Metabolic Conditions 107Metabolic ConditionsMetabolic conditions include the adult population suffering from High Cholesterol, Hypertension, Obesity, ThyroidCondition, Type 1 Diabetes <strong>and</strong> Type 2 Diabetes.% of adult population with Metabolic conditions in FranceAge GroupTotal 18-34 35-44 45-54 55-64 65 +Self-<strong>Report</strong>ed (% total population) 34% 15% 25% 36% 48% 52%Male 47% 36% 48% 48% 54% 46%Female 53% 64% 52% 52% 46% 54%Diagnosed (% total population) 25% 7% 15% 26% 40% 45%Male 47% 28% 48% 47% 54% 46%Female 53% 72% 52% 53% 46% 54%Total adult population: 51,025,000Medication usageAge Group% of sufferers Total 18-34 35-44 45-54 55-64 65 +Prescription only 57% 16% 29% 52% 68% 76%OTC only* 1% 1% 2% 2% 1% 1%Prescription <strong>and</strong> OTC 3% 1% 2% 3% 2% 4%No product 39% 81% 67% 44% 28% 19%*Including over-the-counter <strong>and</strong> herbal products.AttitudesJJ10% of sufferers prefer to treat themselves with an over-the-counter medication than to depend on a doctor togive them a prescription medication.JJ52% of sufferers are willing to make any lifestyle changes necessary to avoid having to take a prescriptionmedication.Metabolic Conditionswww.<strong>Kantar</strong><strong>Health</strong>.com
National <strong>Health</strong> <strong>and</strong> <strong>Wellness</strong> Survey | France | Metabolic Conditions 108LifestyleAge Group% of sufferers Total 18-34 35-44 45-54 55-64 65 +Exercise* 52% 61% 54% 49% 52% 50%Smoke 19% 28% 26% 28% 17% 11%Drink alcohol 81% 70% 78% 80% 83% 84%Obese (BMI ≥ 30) 43% 59% 54% 47% 40% 34%*At least one day per month of vigorous exercise lasting 20 minutes or more.Quality of life6050403049.544.752.6 51.4 49.6 49.246.0 47.8 46.740.942.8 42.820100Total Population Age 18-34 Age 35-44 Age 45-54 Age 55-64 Age 65 +Physical summary scoreMental summary scoreWork productivity <strong>and</strong> activity impairmentAge GroupTotal 18-34 35-44 45-54 55-64 65 +Work Productivity Loss: % overallwork impairment due to health(Base: Employed Full-time)22.5 25.8 22.0 23.0 19.4 12.3Activity Impairment: % activity impairmentdue to health29.1 25.8 25.9 29.6 28.2 31.9Sufferers are self-reported.Metabolic Conditionswww.<strong>Kantar</strong><strong>Health</strong>.com
National <strong>Health</strong> <strong>and</strong> <strong>Wellness</strong> Survey | France | Musculoskeletal Conditions 109Musculoskeletal ConditionsMusculoskeletal conditions include the adult population suffering from Gout, Muscular Dystrophy, Osteoarthritis,Osteopenia, Osteoporosis <strong>and</strong> Paget’s Disease.% of adult population with Musculoskeletal conditions in FranceAge GroupTotal 18-34 35-44 45-54 55-64 65 +Self-<strong>Report</strong>ed (% total population) 14% 2% 6% 12% 22% 31%Male 33% 35% 48% 33% 36% 30%Female 67% 65% 52% 67% 64% 70%Diagnosed (% total population) 14% 2% 5% 12% 22% 30%Male 33% 34% 47% 32% 35% 29%Female 67% 66% 53% 68% 65% 71%Total adult population: 51,025,000Medication usageAge Group% of sufferers Total 18-34 35-44 45-54 55-64 65 +Prescription only 29% 24% 24% 33% 26% 29%OTC only* 15% 11% 11% 12% 18% 17%Prescription <strong>and</strong> OTC 23% 10% 11% 17% 21% 28%No product 33% 56% 54% 39% 35% 26%*Including over-the-counter <strong>and</strong> herbal products.AttitudesJJ10% of sufferers prefer to treat themselves with an over-the-counter medication than to depend on a doctor togive them a prescription medication.JJ58% of sufferers are willing to make any lifestyle changes necessary to avoid having to take a prescriptionmedication.Musculoskeletal Conditionswww.<strong>Kantar</strong><strong>Health</strong>.com
National <strong>Health</strong> <strong>and</strong> <strong>Wellness</strong> Survey | France | Musculoskeletal Conditions 110LifestyleAge Group% of sufferers Total 18-34 35-44 45-54 55-64 65 +Exercise* 54% 70% 56% 52% 51% 55%Smoke 19% 32% 36% 33% 17% 12%Drink alcohol 82% 73% 79% 78% 82% 84%Obese (BMI ≥ 30) 20% 10% 18% 24% 23% 19%*At least one day per month of vigorous exercise lasting 20 minutes or more.Quality of life6050403046.944.345.047.1 46.5 47.0 47.244.5 45.839.2 40.7 41.820100Total Population Age 18-34 Age 35-44 Age 45-54 Age 55-64 Age 65 +Physical summary scoreMental summary scoreWork productivity <strong>and</strong> activity impairmentAge GroupTotal 18-34 35-44 45-54 55-64 65 +Work Productivity Loss: % overallwork impairment due to health(Base: Employed Full-time)31.9 42.4 35.8 32.0 27.9 20.1Activity Impairment: % activity impairmentdue to health35.5 47.3 39.0 38.7 34.2 33.9Sufferers are self-reported.Musculoskeletal Conditionswww.<strong>Kantar</strong><strong>Health</strong>.com
National <strong>Health</strong> <strong>and</strong> <strong>Wellness</strong> Survey | France | Neurological Conditions 111Neurological ConditionsNeurological conditions include the adult population suffering from Epilepsy, Hemiplegia, Migraine, MultipleSclerosis, Parkinson’s Disease <strong>and</strong> Restless Legs Syndrome (RLS).% of adult population with Neurological conditions in FranceAge GroupTotal 18-34 35-44 45-54 55-64 65 +Self-<strong>Report</strong>ed (% total population) 18% 16% 21% 20% 16% 17%Male 31% 27% 34% 30% 35% 27%Female 69% 73% 66% 70% 65% 73%Diagnosed (% total population) 11% 9% 13% 13% 10% 9%Male 26% 25% 31% 24% 29% 22%Female 74% 75% 69% 76% 71% 78%Total adult population: 51,025,000Medication usageAge Group% of sufferers Total 18-34 35-44 45-54 55-64 65 +Prescription only 27% 21% 28% 29% 32% 25%OTC only* 19% 28% 21% 17% 12% 13%Prescription <strong>and</strong> OTC 6% 7% 8% 6% 3% 3%No product 49% 44% 43% 48% 53% 59%*Including over-the-counter <strong>and</strong> herbal products.AttitudesJJ16% of sufferers prefer to treat themselves with an over-the-counter medication than to depend on a doctor togive them a prescription medication.JJ56% of sufferers are willing to make any lifestyle changes necessary to avoid having to take a prescriptionmedication.Neurological Conditionswww.<strong>Kantar</strong><strong>Health</strong>.com
National <strong>Health</strong> <strong>and</strong> <strong>Wellness</strong> Survey | France | Neurological Conditions 112LifestyleAge Group% of sufferers Total 18-34 35-44 45-54 55-64 65 +Exercise* 57% 66% 57% 51% 51% 55%Smoke 26% 33% 30% 32% 19% 11%Drink alcohol 79% 74% 79% 80% 80% 82%Obese (BMI ≥ 30) 17% 11% 17% 20% 21% 19%*At least one day per month of vigorous exercise lasting 20 minutes or more.Quality of life60504030201049.953.0 51.2 49.6 47.8 46.641.9 40.3 41.2 41.7 43.4 43.90Total Population Age 18-34 Age 35-44 Age 45-54 Age 55-64 Age 65 +Physical summary scoreMental summary scoreWork productivity <strong>and</strong> activity impairmentAge GroupTotal 18-34 35-44 45-54 55-64 65 +Work Productivity Loss: % overallwork impairment due to health(Base: Employed Full-time)24.5 23.5 23.8 24.8 28.8 50.4Activity Impairment: % activity impairmentdue to health31.7 26.8 29.0 32.2 35.2 37.2Sufferers are self-reported.Neurological Conditionswww.<strong>Kantar</strong><strong>Health</strong>.com
National <strong>Health</strong> <strong>and</strong> <strong>Wellness</strong> Survey | France | Ophthalmic Conditions 113Ophthalmic ConditionsOphthalmic conditions include the adult population suffering from Cataracts, Dry Eye, Glaucoma <strong>and</strong> MacularDegeneration.% of adult population with Ophthalmic conditions in FranceAge GroupTotal 18-34 35-44 45-54 55-64 65 +Self-<strong>Report</strong>ed (% total population) 4% 1% 1% 3% 5% 13%Male 41% 63% 58% 44% 53% 36%Female 59% 37% 42% 56% 47% 64%Diagnosed (% total population) 4% 0% 1% 2% 5% 13%Male 41% 61% 55% 45% 53% 36%Female 59% 39% 45% 55% 47% 64%Total adult population: 51,025,000Medication usageAge Group% of sufferers Total 18-34 35-44 45-54 55-64 65 +Prescription only 44% 31% 50% 52% 50% 42%OTC only* 2% 9% 0% 4% 1% 1%Prescription <strong>and</strong> OTC 3% 9% 6% 2% 2% 3%No product 52% 51% 44% 42% 47% 55%*Including over-the-counter <strong>and</strong> herbal products.AttitudesJJ7% of sufferers prefer to treat themselves with an over-the-counter medication than to depend on a doctor togive them a prescription medication.JJ54% of sufferers are willing to make any lifestyle changes necessary to avoid having to take a prescriptionmedication.Ophthalmic Conditionswww.<strong>Kantar</strong><strong>Health</strong>.com
National <strong>Health</strong> <strong>and</strong> <strong>Wellness</strong> Survey | France | Ophthalmic Conditions 114LifestyleAge Group% of sufferers Total 18-34 35-44 45-54 55-64 65 +Exercise* 51% 85% 53% 38% 53% 51%Smoke 16% 48% 37% 19% 18% 13%Drink alcohol 83% 93% 81% 75% 84% 83%Obese (BMI ≥ 30) 21% 3% 18% 19% 25% 21%*At least one day per month of vigorous exercise lasting 20 minutes or more.Quality of life60504030201048.1 47.944.846.239.2 37.549.2 48.445.848.043.345.30Total Population Age 18-34 Age 35-44 Age 45-54 Age 55-64 Age 65 +Physical summary scoreMental summary scoreWork productivity <strong>and</strong> activity impairmentAge GroupTotal 18-34 35-44 45-54 55-64 65 +Work Productivity Loss: % overallwork impairment due to health(Base: Employed Full-time)26.5 47.5 34.7 18.9 22.3 0.0Activity Impairment: % activity impairmentdue to health34.5 43.5 34.7 25.8 29.8 36.6Sufferers are self-reported.Ophthalmic Conditionswww.<strong>Kantar</strong><strong>Health</strong>.com
National <strong>Health</strong> <strong>and</strong> <strong>Wellness</strong> Survey | France | Pain Conditions 115Pain ConditionsPain conditions include the adult population suffering from Arthritis, Back Problems, Bladder Pain, Broken Bones,Cancer, Carpal Tunnel Syndrome, Dental Pain, Diabetic Neuropathic Pain, Fibromyalgia, Headache, HerpesZoster/Shingles, Hip/Pelvic Pain, Joint Pain, Lower Back Pain, Menstrual Cycle, Migraine, Neck Pain, NeuropathicPain, Phantom Limb Pain, Pinched Nerve in Lower Back, Plantar Fasciitis, Post-Herpetic Neuralgia, Shoulder Painor Stiffness, Spinal Disk, Sprains or Strains, Surgery or Other Medical Procedure, Tendonitis <strong>and</strong> Other Pain.% of adult population with Pain conditions in FranceAge GroupTotal 18-34 35-44 45-54 55-64 65 +Self-<strong>Report</strong>ed (% total population) 27% 25% 25% 29% 30% 28%Male 41% 44% 48% 38% 44% 33%Female 59% 56% 52% 62% 56% 67%Diagnosed (% total population) 23% 18% 21% 26% 28% 26%Male 39% 41% 46% 35% 42% 32%Female 61% 59% 54% 65% 58% 68%Total adult population: 51,025,000Medication usageAge Group% of sufferers Total 18-34 35-44 45-54 55-64 65 +Prescription only 33% 17% 26% 37% 40% 47%OTC only* 23% 31% 30% 24% 19% 14%Prescription <strong>and</strong> OTC 7% 6% 9% 9% 8% 6%No product 36% 47% 36% 30% 34% 33%*Including over-the-counter <strong>and</strong> herbal products.AttitudesJJ14% of sufferers prefer to treat themselves with an over-the-counter medication than to depend on a doctor togive them a prescription medication.JJ53% of sufferers are willing to make any lifestyle changes necessary to avoid having to take a prescriptionmedication.Pain Conditionswww.<strong>Kantar</strong><strong>Health</strong>.com
National <strong>Health</strong> <strong>and</strong> <strong>Wellness</strong> Survey | France | Pain Conditions 116LifestyleAge Group% of sufferers Total 18-34 35-44 45-54 55-64 65 +Exercise* 56% 66% 58% 53% 50% 51%Smoke 25% 31% 33% 32% 18% 12%Drink alcohol 81% 78% 81% 80% 81% 83%Obese (BMI ≥ 30) 18% 9% 15% 22% 22% 22%*At least one day per month of vigorous exercise lasting 20 minutes or more.Quality of life6050403048.442.751.949.6 48.0 47.240.6 41.6 42.144.0 45.3 45.420100Total Population Age 18-34 Age 35-44 Age 45-54 Age 55-64 Age 65 +Physical summary scoreMental summary scoreWork productivity <strong>and</strong> activity impairmentAge GroupTotal 18-34 35-44 45-54 55-64 65 +Work Productivity Loss: % overallwork impairment due to health(Base: Employed Full-time)26.1 26.7 25.7 26.8 25.3 3.9Activity Impairment: % activity impairmentdue to health33.1 27.7 31.8 33.4 33.6 39.0Sufferers are self-reported.Pain Conditionswww.<strong>Kantar</strong><strong>Health</strong>.com
National <strong>Health</strong> <strong>and</strong> <strong>Wellness</strong> Survey | France | Psychiatric Conditions 117Psychiatric ConditionsPsychiatric conditions include the adult population suffering from Anxiety, Attention Deficit/Hyperactivity Disorder(ADHD), Bipolar Disorder, Depression, Generalized Anxiety Disorder (GAD), Obsessive Compulsive Disorder(OCD), Phobias, Post Traumatic Stress Disorder (PTSD), Schizophrenia <strong>and</strong> Social Anxiety Disorder (SAD).% of adult population with Psychiatric conditions in FranceAge GroupTotal 18-34 35-44 45-54 55-64 65 +Self-<strong>Report</strong>ed (% total population) 25% 28% 27% 27% 23% 19%Male 36% 35% 42% 40% 38% 24%Female 64% 65% 58% 60% 62% 76%Diagnosed (% total population) 19% 18% 20% 22% 19% 15%Male 34% 35% 39% 38% 36% 20%Female 66% 65% 61% 62% 64% 80%Total adult population: 51,025,000Medication usageAge Group% of sufferers Total 18-34 35-44 45-54 55-64 65 +Prescription only 30% 16% 26% 38% 41% 39%OTC only* 17% 20% 19% 17% 12% 15%Prescription <strong>and</strong> OTC 8% 7% 8% 7% 7% 9%No product 46% 56% 48% 38% 40% 37%*Including over-the-counter <strong>and</strong> herbal products.AttitudesJJ17% of sufferers prefer to treat themselves with an over-the-counter medication than to depend on a doctor togive them a prescription medication.JJ53% of sufferers are willing to make any lifestyle changes necessary to avoid having to take a prescriptionmedication.Psychiatric Conditionswww.<strong>Kantar</strong><strong>Health</strong>.com
National <strong>Health</strong> <strong>and</strong> <strong>Wellness</strong> Survey | France | Psychiatric Conditions 118LifestyleAge Group% of sufferers Total 18-34 35-44 45-54 55-64 65 +Exercise* 57% 66% 58% 52% 49% 50%Smoke 29% 31% 33% 34% 25% 16%Drink alcohol 79% 76% 79% 80% 78% 81%Obese (BMI ≥ 30) 17% 10% 18% 21% 21% 20%*At least one day per month of vigorous exercise lasting 20 minutes or more.Quality of life60504030201050.753.751.7 50.248.3 47.136.6 36.0 36.8 35.8 37.1 37.50Total Population Age 18-34 Age 35-44 Age 45-54 Age 55-64 Age 65 +Physical summary scoreMental summary scoreWork productivity <strong>and</strong> activity impairmentAge GroupTotal 18-34 35-44 45-54 55-64 65 +Work Productivity Loss: % overallwork impairment due to health(Base: Employed Full-time)30.6 29.2 30.1 30.9 36.0 9.5Activity Impairment: % activity impairmentdue to health35.3 30.1 34.4 37.2 39.5 39.6Sufferers are self-reported.Psychiatric Conditionswww.<strong>Kantar</strong><strong>Health</strong>.com
National <strong>Health</strong> <strong>and</strong> <strong>Wellness</strong> Survey | France | Respiratory Conditions 119Respiratory ConditionsRespiratory conditions include the adult population suffering from Asthma, Chronic Bronchitis, Chronic ObstructivePulmonary Disease (COPD), Cystic Fibrosis, Emphysema, Hay Fever <strong>and</strong> Nasal Allergies.% of adult population with Respiratory conditions in FranceAge GroupTotal 18-34 35-44 45-54 55-64 65 +Self-<strong>Report</strong>ed (% total population) 22% 26% 21% 23% 21% 20%Male 45% 47% 48% 42% 46% 40%Female 55% 53% 52% 58% 54% 60%Diagnosed (% total population) 20% 23% 19% 20% 18% 18%Male 44% 47% 48% 39% 44% 38%Female 56% 53% 52% 61% 56% 62%Total adult population: 51,025,000Medication usageAge Group% of sufferers Total 18-34 35-44 45-54 55-64 65 +Prescription only 40% 36% 42% 41% 40% 42%OTC only* 18% 17% 20% 20% 19% 17%Prescription <strong>and</strong> OTC 10% 12% 9% 9% 7% 11%No product 32% 35% 30% 30% 33% 30%*Including over-the-counter <strong>and</strong> herbal products.AttitudesJJ16% of sufferers prefer to treat themselves with an over-the-counter medication than to depend on a doctor togive them a prescription medication.JJ53% of sufferers are willing to make any lifestyle changes necessary to avoid having to take a prescriptionmedication.Respiratory Conditionswww.<strong>Kantar</strong><strong>Health</strong>.com
National <strong>Health</strong> <strong>and</strong> <strong>Wellness</strong> Survey | France | Respiratory Conditions 120LifestyleAge Group% of sufferers Total 18-34 35-44 45-54 55-64 65 +Exercise* 59% 69% 61% 59% 51% 49%Smoke 25% 28% 27% 29% 21% 17%Drink alcohol 81% 79% 81% 81% 82% 84%Obese (BMI ≥ 30) 15% 10% 15% 19% 19% 16%*At least one day per month of vigorous exercise lasting 20 minutes or more.Quality of life60504030201050.953.7 52.450.4 49.2 47.443.4 41.7 43.5 45.0 45.342.70Total Population Age 18-34 Age 35-44 Age 45-54 Age 55-64 Age 65 +Physical summary scoreMental summary scoreWork productivity <strong>and</strong> activity impairmentAge GroupTotal 18-34 35-44 45-54 55-64 65 +Work Productivity Loss: % overallwork impairment due to health(Base: Employed Full-time)24.1 24.4 23.6 23.6 25.6 35.3Activity Impairment: % activity impairmentdue to health27.5 23.7 24.9 28.3 29.1 33.4Sufferers are self-reported.Respiratory Conditionswww.<strong>Kantar</strong><strong>Health</strong>.com
National <strong>Health</strong> <strong>and</strong> <strong>Wellness</strong> Survey | France | Urologic Conditions 121Urologic ConditionsUrologic conditions include the adult population suffering from Benign Prostatic Hyperplasia (BPH), ErectileDysfunction, Overactive Bladder (OAB), Premature Ejaculation, Stress Urinary Incontinence (SUI) <strong>and</strong> Urinary TractInfection.% of adult population with Urologic conditions in FranceAge GroupTotal 18-34 35-44 45-54 55-64 65 +Self-<strong>Report</strong>ed (% total population) 31% 27% 26% 26% 34% 41%Male 70% 62% 72% 69% 79% 69%Female 30% 38% 28% 31% 21% 31%Diagnosed (% total population) 10% 6% 5% 6% 11% 19%Male 49% 21% 26% 39% 60% 62%Female 51% 79% 74% 61% 40% 38%Total adult population: 51,025,000Medication usageAge Group% of sufferers Total 18-34 35-44 45-54 55-64 65 +Prescription only 12% 5% 5% 9% 14% 22%OTC only* 2% 2% 1% 2% 3% 2%Prescription <strong>and</strong> OTC 1% 2% 1% 0% 1% 2%No product 84% 91% 93% 88% 82% 74%*Including over-the-counter <strong>and</strong> herbal products.AttitudesJJ15% of sufferers prefer to treat themselves with an over-the-counter medication than to depend on a doctor togive them a prescription medication.JJ51% of sufferers are willing to make any lifestyle changes necessary to avoid having to take a prescriptionmedication.Urologic Conditionswww.<strong>Kantar</strong><strong>Health</strong>.com
National <strong>Health</strong> <strong>and</strong> <strong>Wellness</strong> Survey | France | Urologic Conditions 122LifestyleAge Group% of sufferers Total 18-34 35-44 45-54 55-64 65 +Exercise* 57% 69% 59% 50% 50% 54%Smoke 24% 32% 34% 32% 20% 12%Drink alcohol 84% 79% 84% 85% 85% 88%Obese (BMI ≥ 30) 18% 8% 16% 22% 23% 20%*At least one day per month of vigorous exercise lasting 20 minutes or more.Quality of life6050403050.243.752.4 51.5 50.1 49.1 48.645.5 46.940.4 42.2 41.920100Total Population Age 18-34 Age 35-44 Age 45-54 Age 55-64 Age 65 +Physical summary scoreMental summary scoreWork productivity <strong>and</strong> activity impairmentAge GroupTotal 18-34 35-44 45-54 55-64 65 +Work Productivity Loss: % overallwork impairment due to health(Base: Employed Full-time)26.6 29.0 27.0 25.4 23.0 10.6Activity Impairment: % activity impairmentdue to health29.6 28.0 29.6 30.5 29.6 30.5Sufferers are self-reported.Urologic Conditionswww.<strong>Kantar</strong><strong>Health</strong>.com
Germanywww.<strong>Kantar</strong><strong>Health</strong>.com
National <strong>Health</strong> <strong>and</strong> <strong>Wellness</strong> Survey | Germany 124Population profileJJThere is an increasing proportion of elderly peoplein the population. 21% of the population is aged 65+years, which is the highest percentage in Europe.JJAbout 61% of all adults in Germany are overweight,<strong>and</strong> about 25% are obese.JJGermany has the lowest birth rate in Europe. Netmigration <strong>and</strong> total population growth are positive,although this population growth is one of the lowerrates in Europe.JJPer capita alcohol consumption in Germany hasdropped in the last 10 years, following the Europeantrend, but remains higher than the average.Life expectancy <strong>and</strong> causes of deathJJPeople in Germany are living longer – 83 years forwomen <strong>and</strong> 78 for men, <strong>and</strong> overall life expectancyis slightly above average for European countries.JJNoncommunicable conditions account for 89% of alldeaths in Germany. Of these, 40% are attributed tocardiovascular diseases <strong>and</strong> 26% are attributed tocancers.<strong>Health</strong>care systemJJThe healthcare system is funded through a mix ofstatutory (90%) <strong>and</strong> private (10%) health insurance.JJGermany has high st<strong>and</strong>ards in healthcare provision<strong>and</strong> a high density of doctors <strong>and</strong> hospitals.Reimbursement policiesJJThere are no reimbursement levels; all approvedprescription medications are fully reimbursed, butpatients have to pay a flat fee per prescription of10% of the price of the drug, between €5 <strong>and</strong> €10.Since 2006, some cheap generics are free fromco-payment.JJDoctors are budgeted <strong>and</strong> obliged to prescribecheap generic drugs where possible. Pharmacistsare obliged to h<strong>and</strong> out the cheapest availablealternative product unless one br<strong>and</strong> is specificallyrequested on prescription by physician.JJBudgeting leads to price being a major factorof consideration for doctors when prescribing atreatment.Germanywww.<strong>Kantar</strong><strong>Health</strong>.com
National <strong>Health</strong> <strong>and</strong> <strong>Wellness</strong> Survey | Germany 125General statisticsJJGross national income per capita (Intl $ 1 , 2012): 42,230JJLife expectancy at birth male/female (years): 78/83JJTotal expenditure on health per capita (Intl $, 2012): 4,617JJTotal expenditure on health as % of GDP (2012): 11.3%JJInternet penetration: Total population: 84.0%Lifestyle statistics 3JJTotal % of adult population that:29.8%20.9%60.9% 79.9%Smokes Exercises 2 Drinks Alcohol Is Obese (BMI ≥ 30)DemographicsJJTotal population: 82,800,000JJArea size: 301,340 km 2JJDoctors (per 10,000 population): 38.0JJHospital beds (per 10,000 population): 82Rank City % Population1 Berlin 4.2%2 Hamburg 2.1%213 Munich 1.5%4 Cologne 1.2%455 Frankfurt 0.8%31The international $ is a currency unit that is calculated using purchasing power parities (PPP), which are rates ofcurrency conversion constructed to account for differences in price level between countries.2At least one day per month of vigorous exercise lasting 20 minutes or more.3Adult population: 68,156,000Germanywww.<strong>Kantar</strong><strong>Health</strong>.com
National <strong>Health</strong> <strong>and</strong> <strong>Wellness</strong> Survey | Germany | Autoimmune Conditions 126Autoimmune ConditionsAutoimmune conditions include the adult population suffering from Ankylosing Spondylitis, Connective TissueDisease, Idiopathic Thrombocytopenia Purpura (ITP), Inflammatory Bowel Disease (Crohn’s Disease or UlcerativeColitis), Lupus, Psoriasis, Psoriatic Arthritis, Rheumatoid Arthritis <strong>and</strong> Sjögren’s Syndrome.% of adult population with Autoimmune conditions in GermanyAge GroupTotal 18-34 35-44 45-54 55-64 65 +Self-<strong>Report</strong>ed (total population) 12% 8% 11% 11% 12% 16%Male 42% 47% 48% 47% 42% 35%Female 58% 53% 52% 53% 58% 65%Diagnosed (% total population) 10% 6% 9% 10% 12% 14%Male 41% 46% 44% 45% 41% 36%Female 59% 54% 56% 55% 59% 64%Total adult population: 68,156,000Medication usageAge Group% of sufferers Total 18-34 35-44 45-54 55-64 65 +Prescription only 36% 27% 31% 39% 43% 38%OTC only* 13% 18% 19% 13% 9% 9%Prescription <strong>and</strong> OTC 8% 6% 8% 9% 10% 7%No product 43% 49% 42% 38% 37% 46%*Including over-the-counter <strong>and</strong> herbal products.AttitudesJJ23% of sufferers prefer to treat themselves with an over-the-counter medication than to depend on a doctor togive them a prescription medication.JJ59% of sufferers are willing to make any lifestyle changes necessary to avoid having to take a prescriptionmedication.Autoimmune Conditionswww.<strong>Kantar</strong><strong>Health</strong>.com
National <strong>Health</strong> <strong>and</strong> <strong>Wellness</strong> Survey | Germany | Autoimmune Conditions 127LifestyleAge Group% of sufferers Total 18-34 35-44 45-54 55-64 65 +Exercise* 60% 75% 63% 57% 52% 56%Smoke 31% 38% 39% 42% 36% 17%Drink alcohol 77% 82% 80% 77% 75% 74%Obese (BMI ≥ 30) 28% 14% 26% 32% 37% 28%*At least one day per month of vigorous exercise lasting 20 minutes or more.Quality of life6050403044.245.150.548.441.9 42.9 43.6 42.5 43.840.5 41.649.620100Total Population Age 18-34 Age 35-44 Age 45-54 Age 55-64 Age 65 +Physical summary scoreMental summary scoreWork productivity <strong>and</strong> activity impairmentAge GroupTotal 18-34 35-44 45-54 55-64 65 +Work Productivity Loss: % overallwork impairment due to health(Base: Employed Full-time)32.5 31.7 33.1 32.3 35.3 20.5Activity Impairment: % activity impairmentdue to health41.3 31.0 36.3 46.0 52.4 40.4Sufferers are self-reported.Autoimmune Conditionswww.<strong>Kantar</strong><strong>Health</strong>.com
National <strong>Health</strong> <strong>and</strong> <strong>Wellness</strong> Survey | Germany | Cancer Conditions 128Cancer ConditionsCancer conditions include the adult population suffering from Breast Cancer, Cervical Cancer, Colorectal Cancer,Leukemia, Lymphoma, Metastatic Solid Tumor, Non-Small Cell Lung Cancer, Prostate Cancer, Small-Cell LungCancer, Uterine Cancer <strong>and</strong> Other Cancer.% of adult population with Cancer conditions in GermanyAge GroupTotal 18-34 35-44 45-54 55-64 65 +Self-<strong>Report</strong>ed (total population) 7% 2% 4% 6% 8% 16%Male 41% 39% 44% 31% 43% 44%Female 59% 61% 56% 69% 57% 56%Diagnosed (% total population) 7% 2% 3% 6% 8% 15%Male 41% 41% 40% 30% 42% 44%Female 59% 59% 60% 70% 58% 56%Total adult population: 68,156,000Medication usageAge Group% of sufferers Total 18-34 35-44 45-54 55-64 65 +Using prescription 20% 23% 19% 18% 16% 22%Not using prescription 80% 77% 81% 82% 84% 78%Over-the-counter usage was not captured for Cancer.AttitudesJJ16% of sufferers prefer to treat themselves with an over-the-counter medication than to depend on a doctor togive them a prescription medication.JJ60% of sufferers are willing to make any lifestyle changes necessary to avoid having to take a prescriptionmedication.Cancer Conditionswww.<strong>Kantar</strong><strong>Health</strong>.com
National <strong>Health</strong> <strong>and</strong> <strong>Wellness</strong> Survey | Germany | Cancer Conditions 129LifestyleAge Group% of sufferers Total 18-34 35-44 45-54 55-64 65 +Exercise* 55% 67% 58% 54% 50% 55%Smoke 26% 37% 36% 49% 35% 14%Drink alcohol 77% 84% 80% 74% 74% 78%Obese (BMI ≥ 30) 23% 13% 23% 27% 24% 22%*At least one day per month of vigorous exercise lasting 20 minutes or more.Quality of life6050403045.247.348.9 48.339.546.543.5 43.7 45.241.7 42.051.120100Total Population Age 18-34 Age 35-44 Age 45-54 Age 55-64 Age 65 +Physical summary scoreMental summary scoreWork productivity <strong>and</strong> activity impairmentAge GroupTotal 18-34 35-44 45-54 55-64 65 +Work Productivity Loss: % overallwork impairment due to health(Base: Employed Full-time)35.4 52.8 36.4 30.6 28.5 20.7Activity Impairment: % activity impairmentdue to health37.6 42.8 40.4 48.0 39.8 32.4Sufferers are self-reported.Cancer Conditionswww.<strong>Kantar</strong><strong>Health</strong>.com
National <strong>Health</strong> <strong>and</strong> <strong>Wellness</strong> Survey | Germany | Cardiovascular Conditions 130Cardiovascular ConditionsCardiovascular conditions include the adult population suffering from Angina Pectoris, Arrhythmia, Atherosclerosis,Atrial Fibrillation, Congestive Heart Failure (CHF), Deep Vein Thrombosis (DVT), Heart Attack, Heart Murmur,High Cholesterol, Hypertension, Left Ventricular Hypertrophy (LVH), Peripheral Arterial Disease (PAD), PeripheralVascular Disease (PVD), Pulmonary Embolism, Stroke or Mini-Stroke/Transient Ischemia <strong>and</strong> Unstable Angina.% of adult population with Cardiovascular conditions in GermanyAge GroupTotal 18-34 35-44 45-54 55-64 65 +Self-<strong>Report</strong>ed (total population) 47% 23% 33% 47% 61% 71%Male 50% 47% 55% 53% 53% 45%Female 50% 53% 45% 47% 47% 55%Diagnosed (% total population) 45% 19% 29% 45% 60% 70%Male 50% 48% 55% 54% 53% 45%Female 50% 52% 45% 46% 47% 55%Total adult population: 68,156,000Medication usageAge Group% of sufferers Total 18-34 35-44 45-54 55-64 65 +Prescription only 52% 20% 36% 51% 60% 64%OTC only* 6% 10% 8% 7% 6% 4%Prescription <strong>and</strong> OTC 13% 6% 6% 10% 16% 19%No product 28% 64% 50% 33% 18% 13%*Including over-the-counter <strong>and</strong> herbal products.AttitudesJJ20% of sufferers prefer to treat themselves with an over-the-counter medication than to depend on a doctor togive them a prescription medication.JJ57% of sufferers are willing to make any lifestyle changes necessary to avoid having to take a prescriptionmedication.Cardiovascular Conditionswww.<strong>Kantar</strong><strong>Health</strong>.com
National <strong>Health</strong> <strong>and</strong> <strong>Wellness</strong> Survey | Germany | Cardiovascular Conditions 131LifestyleAge Group% of sufferers Total 18-34 35-44 45-54 55-64 65 +Exercise* 57% 71% 61% 56% 50% 55%Smoke 28% 35% 38% 39% 32% 16%Drink alcohol 79% 85% 82% 82% 75% 78%Obese (BMI ≥ 30) 30% 20% 32% 36% 35% 26%*At least one day per month of vigorous exercise lasting 20 minutes or more.Quality of life6050403046.847.451.749.447.342.0 43.5 44.745.247.445.151.920100Total Population Age 18-34 Age 35-44 Age 45-54 Age 55-64 Age 65 +Physical summary scoreMental summary scoreWork productivity <strong>and</strong> activity impairmentAge GroupTotal 18-34 35-44 45-54 55-64 65 +Work Productivity Loss: % overallwork impairment due to health(Base: Employed Full-time)27.6 30.6 30.0 25.6 26.3 23.4Activity Impairment: % activity impairmentdue to health33.7 31.9 33.7 35.5 36.5 31.9Sufferers are self-reported.Cardiovascular Conditionswww.<strong>Kantar</strong><strong>Health</strong>.com
National <strong>Health</strong> <strong>and</strong> <strong>Wellness</strong> Survey | Germany | Gastrointestinal Conditions 132Gastrointestinal ConditionsGastrointestinal conditions include the adult population suffering from Chronic Constipation, Diarrhea, Diverticulitis,Gastroesophageal Reflux Disease (GERD), Heartburn <strong>and</strong> Irritable Bowel Syndrome (IBS).% of adult population with Gastrointestinal conditions in GermanyAge GroupTotal 18-34 35-44 45-54 55-64 65 +Self-<strong>Report</strong>ed (total population) 30% 29% 30% 32% 29% 31%Male 44% 44% 50% 47% 47% 38%Female 56% 56% 50% 53% 53% 62%Diagnosed (% total population) 18% 13% 17% 19% 19% 22%Male 43% 41% 48% 45% 47% 37%Female 57% 59% 52% 55% 53% 63%Total adult population: 68,156,000Medication usageAge Group% of sufferers Total 18-34 35-44 45-54 55-64 65 +Prescription only 21% 10% 17% 20% 29% 30%OTC only* 28% 26% 33% 32% 27% 25%Prescription <strong>and</strong> OTC 9% 6% 8% 9% 9% 12%No product 42% 59% 43% 38% 35% 32%*Including over-the-counter <strong>and</strong> herbal products.AttitudesJJ26% of sufferers prefer to treat themselves with an over-the-counter medication than to depend on a doctor togive them a prescription medication.JJ58% of sufferers are willing to make any lifestyle changes necessary to avoid having to take a prescriptionmedication.Gastrointestinal Conditionswww.<strong>Kantar</strong><strong>Health</strong>.com
National <strong>Health</strong> <strong>and</strong> <strong>Wellness</strong> Survey | Germany | Gastrointestinal Conditions 133LifestyleAge Group% of sufferers Total 18-34 35-44 45-54 55-64 65 +Exercise* 58% 70% 58% 53% 51% 56%Smoke 33% 37% 42% 41% 34% 15%Drink alcohol 79% 83% 81% 82% 75% 75%Obese (BMI ≥ 30) 27% 18% 26% 35% 35% 25%*At least one day per month of vigorous exercise lasting 20 minutes or more.Quality of life6050403047.245.052.449.546.542.1 42.8 43.444.0 45.643.750.120100Total Population Age 18-34 Age 35-44 Age 45-54 Age 55-64 Age 65 +Physical summary scoreMental summary scoreWork productivity <strong>and</strong> activity impairmentAge GroupTotal 18-34 35-44 45-54 55-64 65 +Work Productivity Loss: % overallwork impairment due to health(Base: Employed Full-time)28.6 29.4 29.3 27.1 29.4 28.5Activity Impairment: % activity impairmentdue to health35.9 30.5 34.7 38.3 40.7 36.5Sufferers are self-reported.Gastrointestinal Conditionswww.<strong>Kantar</strong><strong>Health</strong>.com
National <strong>Health</strong> <strong>and</strong> <strong>Wellness</strong> Survey | Germany | Infectious Diseases 134Infectious DiseasesInfectious Diseases include the adult population suffering from AIDS, C. Difficile, Community-Acquired Pneumonia(CAP), Genital Herpes, Genital Warts, Hospital-Acquired Pneumonia (HAP), Hepatitis A, Hepatitis B, Hepatitis C,HIV, Tuberculosis <strong>and</strong> Yeast Infection.% of adult population with Infectious Diseases in GermanyAge GroupTotal 18-34 35-44 45-54 55-64 65 +Self-<strong>Report</strong>ed (total population) 7% 4% 5% 7% 8% 9%Male 44% 41% 57% 42% 46% 42%Female 56% 59% 43% 58% 54% 58%Diagnosed (% total population) 6% 3% 4% 6% 7% 8%Male 44% 39% 54% 42% 48% 41%Female 56% 61% 46% 58% 52% 59%Total adult population: 68,156,000Medication usageAge Group% of sufferers Total 18-34 35-44 45-54 55-64 65 +Using prescription 11% 18% 11% 14% 7% 7%Not using prescription 89% 82% 89% 86% 93% 93%Over-the-counter usage was not captured for Infectious Diseases.AttitudesJJ22% of sufferers prefer to treat themselves with an over-the-counter medication than to depend on a doctor togive them a prescription medication.JJ61% of sufferers are willing to make any lifestyle changes necessary to avoid having to take a prescriptionmedication.Infectious Diseaseswww.<strong>Kantar</strong><strong>Health</strong>.com
National <strong>Health</strong> <strong>and</strong> <strong>Wellness</strong> Survey | Germany | Infectious Diseases 135LifestyleAge Group% of sufferers Total 18-34 35-44 45-54 55-64 65 +Exercise* 62% 72% 67% 59% 56% 59%Smoke 32% 39% 43% 45% 34% 15%Drink alcohol 78% 85% 81% 74% 74% 80%Obese (BMI ≥ 30) 23% 16% 23% 28% 31% 18%*At least one day per month of vigorous exercise lasting 20 minutes or more.Quality of life6050403046.144.949.2 49.545.7 45.3 45.0 44.241.0 40.6 42.149.920100Total Population Age 18-34 Age 35-44 Age 45-54 Age 55-64 Age 65 +Physical summary scoreMental summary scoreWork productivity <strong>and</strong> activity impairmentAge GroupTotal 18-34 35-44 45-54 55-64 65 +Work Productivity Loss: % overallwork impairment due to health(Base: Employed Full-time)32.0 38.9 32.8 31.3 24.7 7.6Activity Impairment: % activity impairmentdue to health36.9 35.9 39.6 41.2 37.7 33.0Sufferers are self-reported.Infectious Diseaseswww.<strong>Kantar</strong><strong>Health</strong>.com
National <strong>Health</strong> <strong>and</strong> <strong>Wellness</strong> Survey | Germany | Metabolic Conditions 136Metabolic ConditionsMetabolic conditions include the adult population suffering from High Cholesterol, Hypertension, Obesity, ThyroidCondition, Type 1 Diabetes <strong>and</strong> Type 2 Diabetes.% of adult population with Metabolic conditions in GermanyAge GroupTotal 18-34 35-44 45-54 55-64 65 +Self-<strong>Report</strong>ed (total population) 52% 27% 41% 55% 67% 74%Male 47% 45% 50% 49% 52% 43%Female 53% 55% 50% 51% 48% 57%Diagnosed (% total population) 45% 18% 30% 47% 62% 70%Male 47% 42% 49% 49% 52% 43%Female 53% 58% 51% 51% 48% 57%Total adult population: 68,156,000Medication usageAge Group% of sufferers Total 18-34 35-44 45-54 55-64 65 +Prescription only 57% 34% 45% 55% 64% 68%OTC only* 3% 3% 3% 4% 4% 3%Prescription <strong>and</strong> OTC 10% 3% 4% 7% 12% 15%No product 29% 60% 49% 34% 20% 14%*Including over-the-counter <strong>and</strong> herbal products.AttitudesJJ20% of sufferers prefer to treat themselves with an over-the-counter medication than to depend on a doctor togive them a prescription medication.JJ56% of sufferers are willing to make any lifestyle changes necessary to avoid having to take a prescriptionmedication.Metabolic Conditionswww.<strong>Kantar</strong><strong>Health</strong>.com
National <strong>Health</strong> <strong>and</strong> <strong>Wellness</strong> Survey | Germany | Metabolic Conditions 137LifestyleAge Group% of sufferers Total 18-34 35-44 45-54 55-64 65 +Exercise* 56% 67% 58% 55% 50% 56%Smoke 27% 34% 34% 37% 30% 15%Drink alcohol 79% 83% 81% 81% 76% 77%Obese (BMI ≥ 30) 40% 46% 49% 46% 41% 30%*At least one day per month of vigorous exercise lasting 20 minutes or more.Quality of life60504047.447.751.9 50.147.943.1 44.4 45.445.747.845.552.03020100Total Population Age 18-34 Age 35-44 Age 45-54 Age 55-64 Age 65 +Physical summary scoreMental summary scoreWork productivity <strong>and</strong> activity impairmentAge GroupTotal 18-34 35-44 45-54 55-64 65 +Work Productivity Loss: % overallwork impairment due to health(Base: Employed Full-time)25.7 28.9 27.7 24.0 24.0 22.1Activity Impairment: % activity impairmentdue to health32.4 30.4 31.4 33.5 34.7 31.5Sufferers are self-reported.Metabolic Conditionswww.<strong>Kantar</strong><strong>Health</strong>.com
National <strong>Health</strong> <strong>and</strong> <strong>Wellness</strong> Survey | Germany | Musculoskeletal Conditions 138Musculoskeletal ConditionsMusculoskeletal conditions include the adult population suffering from Gout, Muscular Dystrophy, Osteoarthritis,Osteopenia, Osteoporosis <strong>and</strong> Paget’s Disease.% of adult population with Musculoskeletal conditions in GermanyAge GroupTotal 18-34 35-44 45-54 55-64 65 +Self-<strong>Report</strong>ed (total population) 12% 2% 5% 11% 19% 25%Male 40% 61% 52% 48% 44% 32%Female 60% 39% 48% 52% 56% 68%Diagnosed (% total population) 12% 2% 4% 10% 18% 24%Male 40% 63% 51% 48% 44% 32%Female 60% 37% 49% 52% 56% 68%Total adult population: 68,156,000Medication usageAge Group% of sufferers Total 18-34 35-44 45-54 55-64 65 +Prescription only 30% 33% 24% 32% 35% 27%OTC only* 16% 9% 15% 15% 17% 16%Prescription <strong>and</strong> OTC 19% 14% 16% 15% 14% 23%No product 36% 45% 45% 38% 33% 35%*Including over-the-counter <strong>and</strong> herbal products.AttitudesJJ18% of sufferers prefer to treat themselves with an over-the-counter medication than to depend on a doctor togive them a prescription medication.JJ59% of sufferers are willing to make any lifestyle changes necessary to avoid having to take a prescriptionmedication.Musculoskeletal Conditionswww.<strong>Kantar</strong><strong>Health</strong>.com
National <strong>Health</strong> <strong>and</strong> <strong>Wellness</strong> Survey | Germany | Musculoskeletal Conditions 139LifestyleAge Group% of sufferers Total 18-34 35-44 45-54 55-64 65 +Exercise* 55% 74% 61% 53% 50% 55%Smoke 27% 28% 41% 46% 32% 15%Drink alcohol 74% 80% 78% 73% 76% 73%Obese (BMI ≥ 30) 29% 16% 34% 32% 37% 25%*At least one day per month of vigorous exercise lasting 20 minutes or more.Quality of life6050403042.246.945.9 45.439.545.842.3 41.6 41.3 41.3 42.150.820100Total Population Age 18-34 Age 35-44 Age 45-54 Age 55-64 Age 65 +Physical summary scoreMental summary scoreWork productivity <strong>and</strong> activity impairmentAge GroupTotal 18-34 35-44 45-54 55-64 65 +Work Productivity Loss: % overallwork impairment due to health(Base: Employed Full-time)36.6 50.6 37.2 36.3 33.3 22.3Activity Impairment: % activity impairmentdue to health43.2 48.0 42.4 50.3 46.5 38.7Sufferers are self-reported.Musculoskeletal Conditionswww.<strong>Kantar</strong><strong>Health</strong>.com
National <strong>Health</strong> <strong>and</strong> <strong>Wellness</strong> Survey | Germany | Neurological Conditions 140Neurological ConditionsNeurological conditions include the adult population suffering from Epilepsy, Hemiplegia, Migraine, MultipleSclerosis, Parkinson’s Disease <strong>and</strong> Restless Legs Syndrome (RLS).% of adult population with Neurological conditions in GermanyAge GroupTotal 18-34 35-44 45-54 55-64 65 +Self-<strong>Report</strong>ed (total population) 17% 19% 19% 20% 14% 13%Male 32% 29% 38% 32% 33% 32%Female 68% 71% 62% 68% 67% 68%Diagnosed (% total population) 10% 9% 11% 12% 9% 8%Male 29% 24% 37% 30% 27% 29%Female 71% 76% 63% 70% 73% 71%Total adult population: 68,156,000Medication usageAge Group% of sufferers Total 18-34 35-44 45-54 55-64 65 +Prescription only 24% 16% 23% 27% 35% 28%OTC only* 25% 37% 32% 24% 18% 7%Prescription <strong>and</strong> OTC 6% 6% 7% 7% 5% 5%No product 45% 41% 39% 42% 42% 60%*Including over-the-counter <strong>and</strong> herbal products.AttitudesJJ29% of sufferers prefer to treat themselves with an over-the-counter medication than to depend on a doctor togive them a prescription medication.JJ60% of sufferers are willing to make any lifestyle changes necessary to avoid having to take a prescriptionmedication.Neurological Conditionswww.<strong>Kantar</strong><strong>Health</strong>.com
National <strong>Health</strong> <strong>and</strong> <strong>Wellness</strong> Survey | Germany | Neurological Conditions 141LifestyleAge Group% of sufferers Total 18-34 35-44 45-54 55-64 65 +Exercise* 60% 72% 61% 53% 50% 57%Smoke 32% 34% 35% 40% 34% 13%Drink alcohol 78% 84% 80% 77% 72% 75%Obese (BMI ≥ 30) 24% 16% 23% 29% 36% 23%*At least one day per month of vigorous exercise lasting 20 minutes or more.Quality of life60504047.352.249.346.543.6 42.0 41.9 42.3 42.5 43.7 42.849.13020100Total Population Age 18-34 Age 35-44 Age 45-54 Age 55-64 Age 65 +Physical summary scoreMental summary scoreWork productivity <strong>and</strong> activity impairmentAge GroupTotal 18-34 35-44 45-54 55-64 65 +Work Productivity Loss: % overallwork impairment due to health(Base: Employed Full-time)30.4 28.8 32.9 28.6 34.9 29.2Activity Impairment: % activity impairmentdue to health37.3 31.2 36.4 40.7 45.1 37.3Sufferers are self-reported.Neurological Conditionswww.<strong>Kantar</strong><strong>Health</strong>.com
National <strong>Health</strong> <strong>and</strong> <strong>Wellness</strong> Survey | Germany | Ophthalmic Conditions 142Ophthalmic ConditionsOphthalmic conditions include the adult population suffering from Cataracts, Dry Eye, Glaucoma <strong>and</strong> MacularDegeneration.% of adult population with Ophthalmic conditions in GermanyAge GroupTotal 18-34 35-44 45-54 55-64 65 +Self-<strong>Report</strong>ed (total population) 16% 8% 10% 12% 15% 30%Male 38% 40% 48% 40% 43% 32%Female 62% 60% 52% 60% 57% 68%Diagnosed (% total population) 13% 4% 6% 9% 13% 28%Male 35% 41% 44% 38% 41% 31%Female 65% 59% 56% 62% 59% 69%Total adult population: 68,156,000Medication usageAge Group% of sufferers Total 18-34 35-44 45-54 55-64 65 +Prescription only 21% 11% 10% 18% 24% 25%OTC only* 29% 36% 39% 36% 33% 22%Prescription <strong>and</strong> OTC 9% 4% 8% 5% 10% 12%No product 41% 49% 43% 40% 33% 41%*Including over-the-counter <strong>and</strong> herbal products.AttitudesJJ23% of sufferers prefer to treat themselves with an over-the-counter medication than to depend on a doctor togive them a prescription medication.JJ62% of sufferers are willing to make any lifestyle changes necessary to avoid having to take a prescriptionmedication.Ophthalmic Conditionswww.<strong>Kantar</strong><strong>Health</strong>.com
National <strong>Health</strong> <strong>and</strong> <strong>Wellness</strong> Survey | Germany | Ophthalmic Conditions 143LifestyleAge Group% of sufferers Total 18-34 35-44 45-54 55-64 65 +Exercise* 62% 75% 68% 56% 54% 62%Smoke 24% 34% 32% 36% 29% 14%Drink alcohol 80% 83% 83% 79% 81% 78%Obese (BMI ≥ 30) 25% 14% 23% 32% 36% 22%*At least one day per month of vigorous exercise lasting 20 minutes or more.Quality of life6050403046.547.051.949.946.4 44.8 45.4 44.941.4 41.6 43.151.620100Total Population Age 18-34 Age 35-44 Age 45-54 Age 55-64 Age 65 +Physical summary scoreMental summary scoreWork productivity <strong>and</strong> activity impairmentAge GroupTotal 18-34 35-44 45-54 55-64 65 +Work Productivity Loss: % overallwork impairment due to health(Base: Employed Full-time)29.2 31.7 30.1 27.1 28.4 27.9Activity Impairment: % activity impairmentdue to health34.7 33.0 35.1 38.6 39.8 32.1Sufferers are self-reported.Ophthalmic Conditionswww.<strong>Kantar</strong><strong>Health</strong>.com
National <strong>Health</strong> <strong>and</strong> <strong>Wellness</strong> Survey | Germany | Pain Conditions 144Pain ConditionsPain conditions include the adult population suffering from Arthritis, Back Problems, Bladder Pain, Broken Bones,Cancer, Carpal Tunnel Syndrome, Dental Pain, Diabetic Neuropathic Pain, Fibromyalgia, Headache, HerpesZoster/Shingles, Hip/Pelvic Pain, Joint Pain, Lower Back Pain, Menstrual Cycle, Migraine, Neck Pain, NeuropathicPain, Phantom Limb Pain, Pinched Nerve in Lower Back, Plantar Fasciitis, Post-Herpetic Neuralgia, Shoulder Painor Stiffness, Spinal Disk, Sprains or Strains, Surgery or Other Medical Procedure, Tendonitis <strong>and</strong> Other Pain.% of adult population with Pain conditions in GermanyAge GroupTotal 18-34 35-44 45-54 55-64 65 +Self-<strong>Report</strong>ed (total population) 36% 28% 33% 38% 41% 40%Male 41% 37% 46% 45% 48% 35%Female 59% 63% 54% 55% 52% 65%Diagnosed (% total population) 31% 19% 27% 34% 38% 37%Male 41% 36% 45% 44% 47% 34%Female 59% 64% 55% 56% 53% 66%Total adult population: 68,156,000Medication usageAge Group% of sufferers Total 18-34 35-44 45-54 55-64 65 +Prescription only 28% 13% 19% 29% 36% 37%OTC only* 32% 50% 43% 35% 25% 15%Prescription <strong>and</strong> OTC 13% 10% 13% 15% 15% 12%No product 28% 27% 25% 22% 24% 36%*Including over-the-counter <strong>and</strong> herbal products.AttitudesJJ24% of sufferers prefer to treat themselves with an over-the-counter medication than to depend on a doctor togive them a prescription medication.JJ57% of sufferers are willing to make any lifestyle changes necessary to avoid having to take a prescriptionmedication.Pain Conditionswww.<strong>Kantar</strong><strong>Health</strong>.com
National <strong>Health</strong> <strong>and</strong> <strong>Wellness</strong> Survey | Germany | Pain Conditions 145LifestyleAge Group% of sufferers Total 18-34 35-44 45-54 55-64 65 +Exercise* 57% 69% 58% 53% 49% 55%Smoke 34% 36% 44% 44% 37% 16%Drink alcohol 78% 82% 82% 79% 74% 75%Obese (BMI ≥ 30) 26% 17% 25% 31% 35% 25%*At least one day per month of vigorous exercise lasting 20 minutes or more.Quality of life6050403044.745.851.047.942.9 43.5 43.9 43.8 45.441.4 41.351.020100Total Population Age 18-34 Age 35-44 Age 45-54 Age 55-64 Age 65 +Physical summary scoreMental summary scoreWork productivity <strong>and</strong> activity impairmentAge GroupTotal 18-34 35-44 45-54 55-64 65 +Work Productivity Loss: % overallwork impairment due to health(Base: Employed Full-time)30.6 28.3 30.9 30.2 35.4 29.3Activity Impairment: % activity impairmentdue to health39.4 31.2 36.3 41.9 45.9 40.8Sufferers are self-reported.Pain Conditionswww.<strong>Kantar</strong><strong>Health</strong>.com
National <strong>Health</strong> <strong>and</strong> <strong>Wellness</strong> Survey | Germany | Psychiatric Conditions 146Psychiatric ConditionsPsychiatric conditions include the adult population suffering from Anxiety, Attention Deficit/Hyperactivity Disorder(ADHD), Bipolar Disorder, Depression, Generalized Anxiety Disorder (GAD), Obsessive Compulsive Disorder(OCD), Phobias, Post Traumatic Stress Disorder (PTSD), Schizophrenia <strong>and</strong> Social Anxiety Disorder (SAD).% of adult population with Psychiatric conditions in GermanyAge GroupTotal 18-34 35-44 45-54 55-64 65 +Self-<strong>Report</strong>ed (total population) 20% 22% 22% 24% 21% 14%Male 41% 39% 47% 44% 41% 33%Female 59% 61% 53% 56% 59% 67%Diagnosed (% total population) 15% 15% 18% 19% 18% 10%Male 40% 36% 47% 43% 40% 31%Female 60% 64% 53% 57% 60% 69%Total adult population: 68,156,000Medication usageAge Group% of sufferers Total 18-34 35-44 45-54 55-64 65 +Prescription only 33% 20% 36% 39% 45% 30%OTC only* 14% 17% 14% 13% 14% 10%Prescription <strong>and</strong> OTC 7% 7% 8% 9% 7% 6%No product 46% 56% 41% 40% 34% 54%*Including over-the-counter <strong>and</strong> herbal products.AttitudesJJ26% of sufferers prefer to treat themselves with an over-the-counter medication than to depend on a doctor togive them a prescription medication.JJ58% of sufferers are willing to make any lifestyle changes necessary to avoid having to take a prescriptionmedication.Psychiatric Conditionswww.<strong>Kantar</strong><strong>Health</strong>.com
National <strong>Health</strong> <strong>and</strong> <strong>Wellness</strong> Survey | Germany | Psychiatric Conditions 147LifestyleAge Group% of sufferers Total 18-34 35-44 45-54 55-64 65 +Exercise* 56% 67% 59% 51% 49% 53%Smoke 37% 37% 40% 46% 38% 20%Drink alcohol 75% 80% 79% 75% 71% 67%Obese (BMI ≥ 30) 27% 18% 25% 37% 33% 24%*At least one day per month of vigorous exercise lasting 20 minutes or more.Quality of life6050403047.052.449.645.2 43.636.4 35.0 34.5 36.0 36.341.741.220100Total Population Age 18-34 Age 35-44 Age 45-54 Age 55-64 Age 65 +Physical summary scoreMental summary scoreWork productivity <strong>and</strong> activity impairmentAge GroupTotal 18-34 35-44 45-54 55-64 65 +Work Productivity Loss: % overallwork impairment due to health(Base: Employed Full-time)40.6 39.8 39.7 39.0 49.4 32.0Activity Impairment: % activity impairmentdue to health47.1 41.0 45.4 50.2 52.6 48.8Sufferers are self-reported.Psychiatric Conditionswww.<strong>Kantar</strong><strong>Health</strong>.com
National <strong>Health</strong> <strong>and</strong> <strong>Wellness</strong> Survey | Germany | Respiratory Conditions 148Respiratory ConditionsRespiratory conditions include the adult population suffering from Asthma, Chronic Bronchitis, Chronic ObstructivePulmonary Disease (COPD), Cystic Fibrosis, Emphysema, Hay Fever <strong>and</strong> Nasal Allergies.% of adult population with Respiratory conditions in GermanyAge GroupTotal 18-34 35-44 45-54 55-64 65 +Self-<strong>Report</strong>ed (total population) 25% 25% 27% 25% 23% 23%Male 47% 51% 54% 47% 48% 39%Female 53% 49% 46% 53% 52% 61%Diagnosed (% total population) 22% 22% 24% 23% 21% 21%Male 46% 50% 54% 46% 47% 37%Female 54% 50% 46% 54% 53% 63%Total adult population: 68,156,000Medication usageAge Group% of sufferers Total 18-34 35-44 45-54 55-64 65 +Prescription only 30% 22% 23% 30% 34% 42%OTC only* 29% 33% 33% 32% 25% 21%Prescription <strong>and</strong> OTC 14% 12% 15% 15% 16% 12%No product 27% 33% 29% 24% 25% 25%*Including over-the-counter <strong>and</strong> herbal products.AttitudesJJ26% of sufferers prefer to treat themselves with an over-the-counter medication than to depend on a doctor togive them a prescription medication.JJ58% of sufferers are willing to make any lifestyle changes necessary to avoid having to take a prescriptionmedication.Respiratory Conditionswww.<strong>Kantar</strong><strong>Health</strong>.com
National <strong>Health</strong> <strong>and</strong> <strong>Wellness</strong> Survey | Germany | Respiratory Conditions 149LifestyleAge Group% of sufferers Total 18-34 35-44 45-54 55-64 65 +Exercise* 61% 74% 64% 59% 52% 53%Smoke 30% 30% 32% 39% 34% 20%Drink alcohol 80% 85% 82% 81% 76% 74%Obese (BMI ≥ 30) 23% 13% 21% 31% 33% 24%*At least one day per month of vigorous exercise lasting 20 minutes or more.Quality of life60504048.046.253.250.946.943.8 44.7 44.647.043.7 43.950.83020100Total Population Age 18-34 Age 35-44 Age 45-54 Age 55-64 Age 65 +Physical summary scoreMental summary scoreWork productivity <strong>and</strong> activity impairmentAge GroupTotal 18-34 35-44 45-54 55-64 65 +Work Productivity Loss: % overallwork impairment due to health(Base: Employed Full-time)25.9 25.1 26.7 25.3 27.1 29.3Activity Impairment: % activity impairmentdue to health33.0 26.5 29.9 36.1 40.0 35.4Sufferers are self-reported.Respiratory Conditionswww.<strong>Kantar</strong><strong>Health</strong>.com
National <strong>Health</strong> <strong>and</strong> <strong>Wellness</strong> Survey | Germany | Urologic Conditions 150Urologic ConditionsUrologic conditions include the adult population suffering from Benign Prostatic Hyperplasia (BPH), ErectileDysfunction, Overactive Bladder(OAB), Premature Ejaculation, Stress Urinary Incontinence <strong>and</strong> Urinary TractInfection.% of adult population with Urologic conditions in GermanyAge GroupTotal 18-34 35-44 45-54 55-64 65 +Self-<strong>Report</strong>ed (total population) 32% 26% 26% 30% 36% 42%Male 70% 66% 76% 71% 74% 68%Female 30% 34% 24% 29% 26% 32%Diagnosed (% total population) 11% 6% 6% 9% 13% 21%Male 50% 24% 37% 43% 56% 60%Female 50% 76% 63% 57% 44% 40%Total adult population: 68,156,000Medication usageAge Group% of sufferers Total 18-34 35-44 45-54 55-64 65 +Prescription only 12% 4% 5% 10% 12% 20%OTC only* 3% 3% 2% 3% 3% 4%Prescription <strong>and</strong> OTC 2% 1% 2% 1% 2% 2%No product 83% 92% 90% 85% 83% 74%*Including over-the-counter <strong>and</strong> herbal products.AttitudesJJ23% of sufferers prefer to treat themselves with an over-the-counter medication than to depend on a doctor togive them a prescription medication.JJ57% of sufferers are willing to make any lifestyle changes necessary to avoid having to take a prescriptionmedication.Urologic Conditionswww.<strong>Kantar</strong><strong>Health</strong>.com
National <strong>Health</strong> <strong>and</strong> <strong>Wellness</strong> Survey | Germany | Urologic Conditions 151LifestyleAge Group% of sufferers Total 18-34 35-44 45-54 55-64 65 +Exercise* 59% 73% 62% 53% 51% 55%Smoke 31% 37% 38% 42% 34% 15%Drink alcohol 81% 84% 86% 81% 78% 80%Obese (BMI ≥ 30) 26% 13% 24% 32% 34% 27%*At least one day per month of vigorous exercise lasting 20 minutes or more.Quality of life60504047.545.952.550.646.942.4 43.1 43.545.0 46.2 44.850.53020100Total Population Age 18-34 Age 35-44 Age 45-54 Age 55-64 Age 65 +Physical summary scoreMental summary scoreWork productivity <strong>and</strong> activity impairmentAge GroupTotal 18-34 35-44 45-54 55-64 65 +Work Productivity Loss: % overallwork impairment due to health(Base: Employed Full-time)27.8 30.1 27.1 27.6 26.0 22.4Activity Impairment: % activity impairmentdue to health34.1 29.9 31.0 37.1 37.6 34.3Sufferers are self-reported.Urologic Conditionswww.<strong>Kantar</strong><strong>Health</strong>.com
Italywww.<strong>Kantar</strong><strong>Health</strong>.com
National <strong>Health</strong> <strong>and</strong> <strong>Wellness</strong> Survey | Italy 153Population profileJJThe proportion of elderly people in the population isincreasing. In 2012, 21% of the population was aged65 years <strong>and</strong> older.JJCurrently Italy has one of the lowest birth rates inEurope; however, net immigration has increased thepopulation by 900,000 between 2009-<strong>2013</strong>.JJCurrently, 25% of adults in Italy are smokingtobacco, with 21% being daily users.Life expectancy <strong>and</strong> causes of deathJJVarious indicators show that the health of the Italianpopulation has improved over the last few decades.Average life expectancy reached 80 years for men<strong>and</strong> 85 years for women, <strong>and</strong> the mortality rateamong adults has fallen significantly, as has theinfant mortality rate.JJCancer is the most frequent cause of death forpeople under 70, followed by cardiovasculardiseases. However, when all ages are considered,cardiovascular diseases cause more deaths thancancer.JJItaly’s mortality rates for both males <strong>and</strong> femalesare significantly lower than the regional <strong>and</strong> globalaverages.<strong>Health</strong>care systemJJItaly’s healthcare system is a regionally basednational health service (Servizio Sanitario Nazionale(SSN)) that provides universal coverage free ofcharge at the point of service.JJIn the healthcare sector, in contrast to othertraditional state domains (such as utilities), the publicsector owns most hospitals <strong>and</strong> service providers.JJCollaboration between private firms <strong>and</strong> publichealthcare providers is being piloted for someproject financing experiments devoted to promotingthe renovation (<strong>and</strong> new construction) of publichospitals with private funding, with a subsequentpublic–private mix in the management of healthcareactivities.Reimbursement policiesJJThe generic market has grown slowly but steadily.With a market share of 1% in 2001, the genericshave a market share of just over 16% of the totaldrug market.Italywww.<strong>Kantar</strong><strong>Health</strong>.com
National <strong>Health</strong> <strong>and</strong> <strong>Wellness</strong> Survey | Italy 154General statisticsJJGross national income per capita (Intl $ 1 , 2012): 32,920JJLife expectancy at birth male/female (years): 80/85JJTotal expenditure on health per capita (Intl $, 2012): 3,040JJTotal expenditure on health as % of GDP (2012): 9.2%JJInternet penetration: Total population: 58.5%Lifestyle statistics 3JJTotal % of adult population that:23.8%58.1%65.7%12.2%Smokes Exercises 2 Drinks Alcohol Is Obese (BMI ≥ 30)DemographicsJJTotal population: 60,885,000JJArea size: 301,340 km 2JJDoctors (per 10,000 population): 41.0JJHospital beds (per 10,000 population): 34Rank City % Population1 Rome 4.7%422 Milan 2.3%3 Naples 1.7%4 Turin 1.6%135 Palermo 1.2%51The international $ is a currency unit that is calculated using purchasing power parities (PPP), which are rates ofcurrency conversion constructed to account for differences in price level between countries.2At least one day per month of vigorous exercise lasting 20 minutes or more.3Adult population: 51,032,000Italywww.<strong>Kantar</strong><strong>Health</strong>.com
National <strong>Health</strong> <strong>and</strong> <strong>Wellness</strong> Survey | Italy | Autoimmune Conditions 155Autoimmune ConditionsAutoimmune conditions include the adult population suffering from Ankylosing Spondylitis, Connective TissueDisease, Idiopathic Thrombocytopenia Purpura (ITP), Inflammatory Bowel Disease (Crohn’s Disease or UlcerativeColitis), Lupus, Psoriasis, Psoriatic Arthritis, Rheumatoid Arthritis <strong>and</strong> Sjögren’s Syndrome.% of adult population with Autoimmune conditions in ItalyAge GroupTotal 18-34 35-44 45-54 55-64 65 +Self-<strong>Report</strong>ed (% total population) 9% 7% 9% 11% 11% 9%Male 47% 44% 61% 45% 45% 42%Female 53% 56% 39% 55% 55% 58%Diagnosed (% total population) 9% 6% 8% 10% 10% 9%Male 46% 41% 60% 44% 45% 41%Female 54% 59% 40% 56% 55% 59%Total adult population: 51,032,000Medication usageAge Group% of sufferers Total 18-34 35-44 45-54 55-64 65 +Prescription only 40% 35% 43% 41% 39% 42%OTC only* 11% 12% 12% 12% 12% 9%Prescription <strong>and</strong> OTC 11% 13% 9% 10% 14% 10%No product 38% 40% 36% 37% 35% 39%*Including over-the-counter <strong>and</strong> herbal products.AttitudesJJ19% of sufferers prefer to treat themselves with an over-the-counter medication than to depend on a doctor togive them a prescription medication.JJ58% of sufferers are willing to make any lifestyle changes necessary to avoid having to take a prescriptionmedication.Autoimmune Conditionswww.<strong>Kantar</strong><strong>Health</strong>.com
National <strong>Health</strong> <strong>and</strong> <strong>Wellness</strong> Survey | Italy | Autoimmune Conditions 156LifestyleAge Group% of sufferers Total 18-34 35-44 45-54 55-64 65 +Exercise* 59% 75% 69% 59% 49% 45%Smoke 30% 33% 32% 36% 27% 24%Drink alcohol 68% 82% 78% 65% 64% 53%Obese (BMI ≥ 30) 17% 9% 17% 16% 24% 19%*At least one day per month of vigorous exercise lasting 20 minutes or more.Quality of life6050403046.741.049.8 48.3 47.145.1 44.038.6 39.6 39.5 41.045.320100Total Population Age 18-34 Age 35-44 Age 45-54 Age 55-64 Age 65 +Physical summary scoreMental summary scoreWork productivity <strong>and</strong> activity impairmentAge GroupTotal 18-34 35-44 45-54 55-64 65 +Work Productivity Loss: % overallwork impairment due to health(Base: Employed Full-time)35.0 42.1 38.6 29.1 28.2 68.0Activity Impairment: % activity impairmentdue to health39.4 39.4 38.1 37.8 40.4 41.2Sufferers are self-reported.Autoimmune Conditionswww.<strong>Kantar</strong><strong>Health</strong>.com
National <strong>Health</strong> <strong>and</strong> <strong>Wellness</strong> Survey | Italy | Cancer Conditions 157Cancer ConditionsCancer conditions include the adult population suffering from Breast Cancer, Cervical Cancer, Colorectal Cancer,Leukemia, Lymphoma, Metastatic Solid Tumor, Non-Small Cell Lung Cancer, Prostate Cancer, Small-Cell LungCancer, Uterine Cancer <strong>and</strong> Other Cancer.% of adult population with Cancer conditions in ItalyAge GroupTotal 18-34 35-44 45-54 55-64 65 +Self-<strong>Report</strong>ed (% total population) 5% 1% 2% 4% 7% 11%Male 38% 45% 37% 27% 32% 43%Female 62% 55% 63% 73% 68% 57%Diagnosed (% total population) 5% 1% 2% 4% 7% 11%Male 38% 45% 37% 26% 32% 43%Female 62% 55% 63% 74% 68% 57%Total adult population: 51,032,000Medication usageAge Group% of sufferers Total 18-34 35-44 45-54 55-64 65 +Using prescription 27% 51% 26% 34% 25% 23%Not using prescription 73% 49% 74% 66% 75% 77%Over-the-counter usage was not captured for Cancer.AttitudesJJ15% of sufferers prefer to treat themselves with an over-the-counter medication than to depend on a doctor togive them a prescription medication.JJ51% of sufferers are willing to make any lifestyle changes necessary to avoid having to take a prescriptionmedication.Cancer Conditionswww.<strong>Kantar</strong><strong>Health</strong>.com
National <strong>Health</strong> <strong>and</strong> <strong>Wellness</strong> Survey | Italy | Cancer Conditions 158LifestyleAge Group% of sufferers Total 18-34 35-44 45-54 55-64 65 +Exercise* 47% 78% 60% 52% 50% 39%Smoke 29% 57% 33% 34% 30% 24%Drink alcohol 63% 83% 74% 67% 62% 58%Obese (BMI ≥ 30) 19% 24% 13% 13% 23% 20%*At least one day per month of vigorous exercise lasting 20 minutes or more.Quality of life6050403045.342.8 44.637.447.2 46.9 45.8 44.439.7 38.740.845.920100Total Population Age 18-34 Age 35-44 Age 45-54 Age 55-64 Age 65 +Physical summary scoreMental summary scoreWork productivity <strong>and</strong> activity impairmentAge GroupTotal 18-34 35-44 45-54 55-64 65 +Work Productivity Loss: % overallwork impairment due to health(Base: Employed Full-time)33.4 47.4 26.3 36.5 29.3 47.1Activity Impairment: % activity impairmentdue to health39.5 46.8 37.7 39.6 40.5 38.6Sufferers are self-reported.Cancer Conditionswww.<strong>Kantar</strong><strong>Health</strong>.com
National <strong>Health</strong> <strong>and</strong> <strong>Wellness</strong> Survey | Italy | Cardiovascular Conditions 159Cardiovascular ConditionsCardiovascular conditions include the adult population suffering from Angina Pectoris, Arrhythmia, Atherosclerosis,Atrial Fibrillation, Congestive Heart Failure (CHF), Deep Vein Thrombosis (DVT), Heart Attack, Heart Murmur,High Cholesterol, Hypertension, Left Ventricular Hypertrophy (LVH), Peripheral Arterial Disease (PAD), PeripheralVascular Disease (PVD), Pulmonary Embolism, Stroke or Mini-Stroke/Transient Ischemia <strong>and</strong> Unstable Angina.% of adult population with Cardiovascular conditions in ItalyAge GroupTotal 18-34 35-44 45-54 55-64 65 +Self-<strong>Report</strong>ed (% total population) 37% 17% 26% 38% 52% 57%Male 48% 45% 56% 47% 52% 45%Female 52% 55% 44% 53% 48% 55%Diagnosed (% total population) 36% 15% 24% 36% 51% 56%Male 48% 43% 56% 48% 52% 46%Female 52% 57% 44% 52% 48% 54%Total adult population: 51,032,000Medication usageAge Group% of sufferers Total 18-34 35-44 45-54 55-64 65 +Prescription only 54% 18% 29% 45% 60% 74%OTC only* 4% 6% 5% 5% 5% 3%Prescription <strong>and</strong> OTC 9% 6% 9% 7% 11% 10%No product 33% 69% 57% 43% 24% 13%*Including over-the-counter <strong>and</strong> herbal products.AttitudesJJ16% of sufferers prefer to treat themselves with an over-the-counter medication than to depend on a doctor togive them a prescription medication.JJ61% of sufferers are willing to make any lifestyle changes necessary to avoid having to take a prescriptionmedication.Cardiovascular Conditionswww.<strong>Kantar</strong><strong>Health</strong>.com
National <strong>Health</strong> <strong>and</strong> <strong>Wellness</strong> Survey | Italy | Cardiovascular Conditions 160LifestyleAge Group% of sufferers Total 18-34 35-44 45-54 55-64 65 +Exercise* 55% 73% 64% 60% 56% 43%Smoke 24% 31% 27% 28% 27% 18%Drink alcohol 65% 83% 76% 71% 66% 53%Obese (BMI ≥ 30) 17% 14% 16% 19% 19% 17%*At least one day per month of vigorous exercise lasting 20 minutes or more.Quality of life6050403048.643.751.4 50.3 50.3 48.739.9 40.242.1 43.846.346.920100Total Population Age 18-34 Age 35-44 Age 45-54 Age 55-64 Age 65 +Physical summary scoreMental summary scoreWork productivity <strong>and</strong> activity impairmentAge GroupTotal 18-34 35-44 45-54 55-64 65 +Work Productivity Loss: % overallwork impairment due to health(Base: Employed Full-time)25.1 27.1 29.8 21.1 24.0 30.0Activity Impairment: % activity impairmentdue to health31.9 31.6 32.0 28.0 30.7 34.5Sufferers are self-reported.Cardiovascular Conditionswww.<strong>Kantar</strong><strong>Health</strong>.com
National <strong>Health</strong> <strong>and</strong> <strong>Wellness</strong> Survey | Italy | Gastrointestinal Conditions 161Gastrointestinal ConditionsGastrointestinal conditions include the adult population suffering from Chronic Constipation, Diarrhea, Diverticulitis,Gastroesophageal Reflux Disease (GERD), Heartburn <strong>and</strong> Irritable Bowel Syndrome (IBS).% of adult population with Gastrointestinal conditions in ItalyAge GroupTotal 18-34 35-44 45-54 55-64 65 +Self-<strong>Report</strong>ed (% total population) 35% 38% 38% 40% 37% 25%Male 44% 38% 48% 44% 44% 45%Female 56% 62% 52% 56% 56% 55%Diagnosed (% total population) 26% 25% 28% 31% 31% 20%Male 42% 35% 46% 43% 45% 42%Female 58% 65% 54% 57% 55% 58%Total adult population: 51,032,000Medication usageAge Group% of sufferers Total 18-34 35-44 45-54 55-64 65 +Prescription only 35% 23% 32% 37% 43% 46%OTC only* 16% 17% 17% 17% 15% 12%Prescription <strong>and</strong> OTC 11% 10% 9% 11% 15% 9%No product 39% 50% 41% 34% 27% 33%*Including over-the-counter <strong>and</strong> herbal products.AttitudesJJ18% of sufferers prefer to treat themselves with an over-the-counter medication than to depend on a doctor togive them a prescription medication.JJ63% of sufferers are willing to make any lifestyle changes necessary to avoid having to take a prescriptionmedication.Gastrointestinal Conditionswww.<strong>Kantar</strong><strong>Health</strong>.com
National <strong>Health</strong> <strong>and</strong> <strong>Wellness</strong> Survey | Italy | Gastrointestinal Conditions 162LifestyleAge Group% of sufferers Total 18-34 35-44 45-54 55-64 65 +Exercise* 59% 69% 63% 58% 53% 43%Smoke 25% 28% 26% 30% 26% 14%Drink alcohol 71% 79% 72% 69% 69% 59%Obese (BMI ≥ 30) 14% 10% 14% 16% 19% 14%*At least one day per month of vigorous exercise lasting 20 minutes or more.Quality of life6050403050.153.351.2 49.8 48.141.9 40.3 41.1 41.3 42.645.945.520100Total Population Age 18-34 Age 35-44 Age 45-54 Age 55-64 Age 65 +Physical summary scoreMental summary scoreWork productivity <strong>and</strong> activity impairmentAge GroupTotal 18-34 35-44 45-54 55-64 65 +Work Productivity Loss: % overallwork impairment due to health(Base: Employed Full-time)24.4 23.1 26.6 23.0 22.7 50.2Activity Impairment: % activity impairmentdue to health31.1 28.6 28.9 30.5 31.8 37.6Sufferers are self-reported.Gastrointestinal Conditionswww.<strong>Kantar</strong><strong>Health</strong>.com
National <strong>Health</strong> <strong>and</strong> <strong>Wellness</strong> Survey | Italy | Infectious Diseases 163Infectious DiseasesInfectious Diseases include the adult population suffering from AIDS, C. Difficile, Community-Acquired Pneumonia(CAP), Genital Herpes, Genital Warts, Hospital-Acquired Pneumonia (HAP), Hepatitis A, Hepatitis B, Hepatitis C,HIV, Tuberculosis <strong>and</strong> Yeast Infection.% of adult population with Infectious Diseases in ItalyAge GroupTotal 18-34 35-44 45-54 55-64 65 +Self-<strong>Report</strong>ed (% total population) 7% 6% 7% 10% 8% 5%Male 50% 43% 47% 52% 51% 57%Female 50% 57% 53% 48% 49% 43%Diagnosed (% total population) 6% 5% 6% 9% 7% 4%Male 52% 47% 46% 53% 55% 60%Female 48% 53% 54% 47% 45% 40%Total adult population: 51,032,000Medication usageAge Group% of sufferers Total 18-34 35-44 45-54 55-64 65 +Using prescription 22% 33% 26% 19% 16% 16%Not using prescription 78% 67% 74% 81% 84% 84%Over-the-counter usage was not captured for Infectious Diseases.AttitudesJJ16% of sufferers prefer to treat themselves with an over-the-counter medication than to depend on a doctor togive them a prescription medication.JJ60% of sufferers are willing to make any lifestyle changes necessary to avoid having to take a prescriptionmedication.Infectious Diseaseswww.<strong>Kantar</strong><strong>Health</strong>.com
National <strong>Health</strong> <strong>and</strong> <strong>Wellness</strong> Survey | Italy | Infectious Diseases 164LifestyleAge Group% of sufferers Total 18-34 35-44 45-54 55-64 65 +Exercise* 57% 65% 68% 60% 45% 40%Smoke 33% 33% 43% 36% 26% 23%Drink alcohol 73% 79% 71% 75% 67% 69%Obese (BMI ≥ 30) 15% 8% 14% 14% 20% 21%*At least one day per month of vigorous exercise lasting 20 minutes or more.Quality of life6050403048.441.250.4 49.3 48.846.6 46.038.8 40.2 40.7 41.945.320100Total Population Age 18-34 Age 35-44 Age 45-54 Age 55-64 Age 65 +Physical summary scoreMental summary scoreWork productivity <strong>and</strong> activity impairmentAge GroupTotal 18-34 35-44 45-54 55-64 65 +Work Productivity Loss: % overallwork impairment due to health(Base: Employed Full-time)30.7 35.5 37.8 23.2 24.9 57.0Activity Impairment: % activity impairmentdue to health34.6 36.4 34.2 30.9 36.7 37.1Sufferers are self-reported.Infectious Diseaseswww.<strong>Kantar</strong><strong>Health</strong>.com
National <strong>Health</strong> <strong>and</strong> <strong>Wellness</strong> Survey | Italy | Metabolic Conditions 165Metabolic ConditionsMetabolic conditions include the adult population suffering from High Cholesterol, Hypertension, Obesity, ThyroidCondition, Type 1 Diabetes <strong>and</strong> Type 2 Diabetes.% of adult population with Metabolic conditions in ItalyAge GroupTotal 18-34 35-44 45-54 55-64 65 +Self-<strong>Report</strong>ed (% total population) 40% 17% 30% 41% 56% 60%Male 49% 48% 57% 48% 52% 44%Female 51% 52% 43% 52% 48% 56%Diagnosed (% total population) 33% 11% 22% 34% 50% 54%Male 47% 40% 53% 45% 51% 45%Female 53% 60% 47% 55% 49% 55%Total adult population: 51,032,000Medication usageAge Group% of sufferers Total 18-34 35-44 45-54 55-64 65 +Prescription only 54% 23% 35% 47% 59% 71%OTC only* 4% 5% 4% 3% 4% 3%Prescription <strong>and</strong> OTC 6% 3% 5% 6% 9% 7%No product 36% 69% 56% 44% 27% 19%*Including over-the-counter <strong>and</strong> herbal products.AttitudesJJ15% of sufferers prefer to treat themselves with an over-the-counter medication than to depend on a doctor togive them a prescription medication.JJ60% of sufferers are willing to make any lifestyle changes necessary to avoid having to take a prescriptionmedication.Metabolic Conditionswww.<strong>Kantar</strong><strong>Health</strong>.com
National <strong>Health</strong> <strong>and</strong> <strong>Wellness</strong> Survey | Italy | Metabolic Conditions 166LifestyleAge Group% of sufferers Total 18-34 35-44 45-54 55-64 65 +Exercise* 52% 68% 60% 56% 54% 43%Smoke 23% 30% 26% 27% 26% 17%Drink alcohol 64% 82% 70% 70% 65% 52%Obese (BMI ≥ 30) 31% 44% 37% 32% 29% 25%*At least one day per month of vigorous exercise lasting 20 minutes or more.Quality of life6050403048.744.251.6 50.7 50.3 48.741.0 41.3 42.8 44.146.347.120100Total Population Age 18-34 Age 35-44 Age 45-54 Age 55-64 Age 65 +Physical summary scoreMental summary scoreWork productivity <strong>and</strong> activity impairmentAge GroupTotal 18-34 35-44 45-54 55-64 65 +Work Productivity Loss: % overallwork impairment due to health(Base: Employed Full-time)23.7 27.4 24.0 21.2 25.2 25.8Activity Impairment: % activity impairmentdue to health30.9 29.0 28.1 27.8 30.4 34.5Sufferers are self-reported.Metabolic Conditionswww.<strong>Kantar</strong><strong>Health</strong>.com
National <strong>Health</strong> <strong>and</strong> <strong>Wellness</strong> Survey | Italy | Musculoskeletal Conditions 167Musculoskeletal ConditionsMusculoskeletal conditions include the adult population suffering from Gout, Muscular Dystrophy, Osteoarthritis,Osteopenia, Osteoporosis <strong>and</strong> Paget’s Disease.% of adult population with Musculoskeletal conditions in ItalyAge GroupTotal 18-34 35-44 45-54 55-64 65 +Self-<strong>Report</strong>ed (% total population) 13% 3% 5% 10% 20% 26%Male 30% 53% 51% 35% 29% 22%Female 70% 47% 49% 65% 71% 78%Diagnosed (% total population) 12% 3% 5% 9% 19% 25%Male 29% 52% 50% 35% 29% 21%Female 71% 48% 50% 65% 71% 79%Total adult population: 51,032,000Medication usageAge Group% of sufferers Total 18-34 35-44 45-54 55-64 65 +Prescription only 22% 10% 27% 25% 16% 23%OTC only* 15% 24% 12% 17% 17% 13%Prescription <strong>and</strong> OTC 32% 28% 20% 31% 40% 31%No product 31% 39% 42% 27% 27% 32%*Including over-the-counter <strong>and</strong> herbal products.AttitudesJJ15% of sufferers prefer to treat themselves with an over-the-counter medication than to depend on a doctor togive them a prescription medication.JJ61% of sufferers are willing to make any lifestyle changes necessary to avoid having to take a prescriptionmedication.Musculoskeletal Conditionswww.<strong>Kantar</strong><strong>Health</strong>.com
National <strong>Health</strong> <strong>and</strong> <strong>Wellness</strong> Survey | Italy | Musculoskeletal Conditions 168LifestyleAge Group% of sufferers Total 18-34 35-44 45-54 55-64 65 +Exercise* 50% 77% 57% 62% 56% 40%Smoke 23% 41% 28% 31% 31% 15%Drink alcohol 56% 78% 67% 68% 63% 46%Obese (BMI ≥ 30) 17% 11% 16% 14% 18% 18%*At least one day per month of vigorous exercise lasting 20 minutes or more.Quality of life6050403044.4 44.4 44.2 45.2 46.042.839.8 38.5 40.042.743.544.720100Total Population Age 18-34 Age 35-44 Age 45-54 Age 55-64 Age 65 +Physical summary scoreMental summary scoreWork productivity <strong>and</strong> activity impairmentAge GroupTotal 18-34 35-44 45-54 55-64 65 +Work Productivity Loss: % overallwork impairment due to health(Base: Employed Full-time)33.8 41.5 44.6 30.3 27.9 65.0Activity Impairment: % activity impairmentdue to health41.2 44.8 44.4 41.2 36.2 42.3Sufferers are self-reported.Musculoskeletal Conditionswww.<strong>Kantar</strong><strong>Health</strong>.com
National <strong>Health</strong> <strong>and</strong> <strong>Wellness</strong> Survey | Italy | Neurological Conditions 169Neurological ConditionsNeurological conditions include the adult population suffering from Epilepsy, Hemiplegia, Migraine, MultipleSclerosis, Parkinson’s Disease <strong>and</strong> Restless Legs Syndrome (RLS).% of adult population with Neurological conditions in ItalyAge GroupTotal 18-34 35-44 45-54 55-64 65 +Self-<strong>Report</strong>ed (% total population) 14% 14% 16% 18% 13% 11%Male 32% 29% 36% 31% 37% 31%Female 68% 71% 64% 69% 63% 69%Diagnosed (% total population) 8% 8% 9% 11% 9% 4%Male 29% 28% 31% 28% 34% 27%Female 71% 72% 69% 72% 66% 73%Total adult population: 51,032,000Medication usageAge Group% of sufferers Total 18-34 35-44 45-54 55-64 65 +Prescription only 28% 29% 27% 29% 37% 19%OTC only* 18% 24% 20% 15% 17% 10%Prescription <strong>and</strong> OTC 6% 7% 7% 6% 6% 2%No product 49% 39% 45% 50% 41% 68%*Including over-the-counter <strong>and</strong> herbal products.AttitudesJJ17% of sufferers prefer to treat themselves with an over-the-counter medication than to depend on a doctor togive them a prescription medication.JJ63% of sufferers are willing to make any lifestyle changes necessary to avoid having to take a prescriptionmedication.Neurological Conditionswww.<strong>Kantar</strong><strong>Health</strong>.com
National <strong>Health</strong> <strong>and</strong> <strong>Wellness</strong> Survey | Italy | Neurological Conditions 170LifestyleAge Group% of sufferers Total 18-34 35-44 45-54 55-64 65 +Exercise* 56% 67% 60% 54% 55% 42%Smoke 28% 32% 28% 30% 27% 19%Drink alcohol 66% 81% 69% 68% 59% 43%Obese (BMI ≥ 30) 15% 14% 11% 13% 20% 21%*At least one day per month of vigorous exercise lasting 20 minutes or more.Quality of life6050403048.952.550.6 49.246.441.0 39.6 40.3 40.1 39.543.545.820100Total Population Age 18-34 Age 35-44 Age 45-54 Age 55-64 Age 65 +Physical summary scoreMental summary scoreWork productivity <strong>and</strong> activity impairmentAge GroupTotal 18-34 35-44 45-54 55-64 65 +Work Productivity Loss: % overallwork impairment due to health(Base: Employed Full-time)28.9 28.1 31.5 24.3 33.7 58.7Activity Impairment: % activity impairmentdue to health36.2 32.4 33.7 35.5 41.5 41.6Sufferers are self-reported.Neurological Conditionswww.<strong>Kantar</strong><strong>Health</strong>.com
National <strong>Health</strong> <strong>and</strong> <strong>Wellness</strong> Survey | Italy | Ophthalmic Conditions 171Ophthalmic ConditionsOphthalmic conditions include the adult population suffering from Cataracts, Dry Eye, Glaucoma <strong>and</strong> MacularDegeneration.% of adult population with Ophthalmic conditions in ItalyAge GroupTotal 18-34 35-44 45-54 55-64 65 +Self-<strong>Report</strong>ed (% total population) 8% 6% 5% 7% 10% 13%Male 42% 48% 41% 37% 36% 43%Female 58% 52% 59% 63% 64% 57%Diagnosed (% total population) 7% 4% 4% 6% 9% 13%Male 40% 45% 40% 32% 36% 43%Female 60% 55% 60% 68% 64% 57%Total adult population: 51,032,000Medication usageAge Group% of sufferers Total 18-34 35-44 45-54 55-64 65 +Prescription only 38% 35% 42% 44% 48% 32%OTC only* 9% 16% 18% 13% 6% 3%Prescription <strong>and</strong> OTC 8% 11% 12% 10% 5% 5%No product 45% 38% 28% 33% 41% 59%*Including over-the-counter <strong>and</strong> herbal products.AttitudesJJ14% of sufferers prefer to treat themselves with an over-the-counter medication than to depend on a doctor togive them a prescription medication.JJ62% of sufferers are willing to make any lifestyle changes necessary to avoid having to take a prescriptionmedication.Ophthalmic Conditionswww.<strong>Kantar</strong><strong>Health</strong>.com
National <strong>Health</strong> <strong>and</strong> <strong>Wellness</strong> Survey | Italy | Ophthalmic Conditions 172LifestyleAge Group% of sufferers Total 18-34 35-44 45-54 55-64 65 +Exercise* 59% 78% 64% 64% 61% 46%Smoke 24% 27% 25% 24% 32% 20%Drink alcohol 67% 78% 65% 75% 72% 57%Obese (BMI ≥ 30) 13% 11% 10% 13% 17% 13%*At least one day per month of vigorous exercise lasting 20 minutes or more.Quality of life6050403047.542.351.049.1 49.546.8 45.139.4 40.4 40.6 41.844.920100Total Population Age 18-34 Age 35-44 Age 45-54 Age 55-64 Age 65 +Physical summary scoreMental summary scoreWork productivity <strong>and</strong> activity impairmentAge GroupTotal 18-34 35-44 45-54 55-64 65 +Work Productivity Loss: % overallwork impairment due to health(Base: Employed Full-time)30.5 33.1 35.8 23.0 32.7 41.7Activity Impairment: % activity impairmentdue to health36.0 34.8 36.0 30.0 36.6 38.9Sufferers are self-reported.Ophthalmic Conditionswww.<strong>Kantar</strong><strong>Health</strong>.com
National <strong>Health</strong> <strong>and</strong> <strong>Wellness</strong> Survey | Italy | Pain Conditions 173Pain ConditionsPain conditions include the adult population suffering from Arthritis, Back Problems, Bladder Pain, Broken Bones,Cancer, Carpal Tunnel Syndrome, Dental Pain, Diabetic Neuropathic Pain, Fibromyalgia, Headache, HerpesZoster/Shingles, Hip/Pelvic Pain, Joint Pain, Lower Back Pain, Menstrual Cycle, Migraine, Neck Pain, NeuropathicPain, Phantom Limb Pain, Pinched Nerve in Lower Back, Plantar Fasciitis, Post-Herpetic Neuralgia, Shoulder Painor Stiffness, Spinal Disk, Sprains or Strains, Surgery or Other Medical Procedure, Tendonitis <strong>and</strong> Other Pain.% of adult population with Pain conditions in ItalyAge GroupTotal 18-34 35-44 45-54 55-64 65 +Self-<strong>Report</strong>ed (% total population) 21% 18% 20% 24% 25% 18%Male 43% 44% 46% 40% 42% 41%Female 57% 56% 54% 60% 58% 59%Diagnosed (% total population) 17% 13% 17% 20% 22% 16%Male 41% 41% 45% 38% 40% 41%Female 59% 59% 55% 62% 60% 59%Total adult population: 51,032,000Medication usageAge Group% of sufferers Total 18-34 35-44 45-54 55-64 65 +Prescription only 32% 22% 31% 33% 37% 37%OTC only* 22% 32% 26% 21% 19% 12%Prescription <strong>and</strong> OTC 10% 11% 10% 12% 10% 9%No product 36% 35% 32% 34% 34% 42%*Including over-the-counter <strong>and</strong> herbal products.AttitudesJJ17% of sufferers prefer to treat themselves with an over-the-counter medication than to depend on a doctor togive them a prescription medication.JJ62% of sufferers are willing to make any lifestyle changes necessary to avoid having to take a prescriptionmedication.Pain Conditionswww.<strong>Kantar</strong><strong>Health</strong>.com
National <strong>Health</strong> <strong>and</strong> <strong>Wellness</strong> Survey | Italy | Pain Conditions 174LifestyleAge Group% of sufferers Total 18-34 35-44 45-54 55-64 65 +Exercise* 55% 70% 60% 56% 51% 40%Smoke 28% 31% 29% 32% 30% 20%Drink alcohol 68% 81% 71% 68% 65% 54%Obese (BMI ≥ 30) 18% 14% 16% 16% 22% 22%*At least one day per month of vigorous exercise lasting 20 minutes or more.Quality of life6050403046.951.248.7 47.2 45.441.7 40.2 40.5 40.6 42.042.244.920100Total Population Age 18-34 Age 35-44 Age 45-54 Age 55-64 Age 65 +Physical summary scoreMental summary scoreWork productivity <strong>and</strong> activity impairmentAge GroupTotal 18-34 35-44 45-54 55-64 65 +Work Productivity Loss: % overallwork impairment due to health(Base: Employed Full-time)29.0 24.4 30.7 29.9 28.2 47.3Activity Impairment: % activity impairmentdue to health37.9 32.2 35.4 37.4 38.8 45.5Sufferers are self-reported.Pain Conditionswww.<strong>Kantar</strong><strong>Health</strong>.com
National <strong>Health</strong> <strong>and</strong> <strong>Wellness</strong> Survey | Italy | Psychiatric Conditions 175Psychiatric ConditionsPsychiatric conditions include the adult population suffering from Anxiety, Attention Deficit/Hyperactivity Disorder(ADHD), Bipolar Disorder, Depression, Generalized Anxiety Disorder (GAD), Obsessive Compulsive Disorder(OCD), Phobias, Post Traumatic Stress Disorder (PTSD), Schizophrenia <strong>and</strong> Social Anxiety Disorder (SAD).% of adult population with Psychiatric conditions in ItalyAge GroupTotal 18-34 35-44 45-54 55-64 65 +Self-<strong>Report</strong>ed (% total population) 24% 28% 27% 27% 24% 17%Male 37% 35% 43% 37% 39% 31%Female 63% 65% 57% 63% 61% 69%Diagnosed (% total population) 16% 15% 17% 20% 18% 13%Male 35% 36% 40% 33% 35% 27%Female 65% 64% 60% 67% 65% 73%Total adult population: 51,032,000Medication usageAge Group% of sufferers Total 18-34 35-44 45-54 55-64 65 +Prescription only 25% 13% 22% 29% 31% 38%OTC only* 16% 19% 18% 17% 16% 7%Prescription <strong>and</strong> OTC 9% 10% 10% 10% 11% 7%No product 50% 58% 50% 44% 42% 48%*Including over-the-counter <strong>and</strong> herbal products.AttitudesJJ19% of sufferers prefer to treat themselves with an over-the-counter medication than to depend on a doctor togive them a prescription medication.JJ61% of sufferers are willing to make any lifestyle changes necessary to avoid having to take a prescriptionmedication.Psychiatric Conditionswww.<strong>Kantar</strong><strong>Health</strong>.com
National <strong>Health</strong> <strong>and</strong> <strong>Wellness</strong> Survey | Italy | Psychiatric Conditions 176LifestyleAge Group% of sufferers Total 18-34 35-44 45-54 55-64 65 +Exercise* 57% 68% 63% 55% 50% 41%Smoke 30% 33% 32% 31% 32% 21%Drink alcohol 68% 78% 71% 68% 64% 51%Obese (BMI ≥ 30) 14% 8% 13% 14% 20% 19%*At least one day per month of vigorous exercise lasting 20 minutes or more.Quality of life6050403049.353.149.8 49.346.836.8 36.0 36.0 36.7 36.344.639.520100Total Population Age 18-34 Age 35-44 Age 45-54 Age 55-64 Age 65 +Physical summary scoreMental summary scoreWork productivity <strong>and</strong> activity impairmentAge GroupTotal 18-34 35-44 45-54 55-64 65 +Work Productivity Loss: % overallwork impairment due to health(Base: Employed Full-time)32.8 34.4 36.2 27.5 33.6 32.0Activity Impairment: % activity impairmentdue to health38.9 35.1 38.2 37.1 41.5 46.0Sufferers are self-reported.Psychiatric Conditionswww.<strong>Kantar</strong><strong>Health</strong>.com
National <strong>Health</strong> <strong>and</strong> <strong>Wellness</strong> Survey | Italy | Respiratory Conditions 177Respiratory ConditionsRespiratory conditions include the adult population suffering from Asthma, Chronic Bronchitis, Chronic ObstructivePulmonary Disease (COPD), Cystic Fibrosis, Emphysema, Hay Fever <strong>and</strong> Nasal Allergies.% of adult population with Respiratory conditions in ItalyAge GroupTotal 18-34 35-44 45-54 55-64 65 +Self-<strong>Report</strong>ed (% total population) 20% 20% 24% 22% 20% 15%Male 48% 44% 51% 46% 55% 48%Female 52% 56% 49% 54% 45% 52%Diagnosed (% total population) 18% 18% 22% 20% 19% 14%Male 48% 43% 51% 45% 55% 47%Female 52% 57% 49% 55% 45% 53%Total adult population: 51,032,000Medication usageAge Group% of sufferers Total 18-34 35-44 45-54 55-64 65 +Prescription only 37% 39% 35% 37% 35% 41%OTC only* 17% 16% 18% 19% 19% 16%Prescription <strong>and</strong> OTC 20% 22% 24% 21% 20% 14%No product 25% 23% 24% 23% 26% 29%*Including over-the-counter <strong>and</strong> herbal products.AttitudesJJ18% of sufferers prefer to treat themselves with an over-the-counter medication than to depend on a doctor togive them a prescription medication.JJ63% of sufferers are willing to make any lifestyle changes necessary to avoid having to take a prescriptionmedication.Respiratory Conditionswww.<strong>Kantar</strong><strong>Health</strong>.com
National <strong>Health</strong> <strong>and</strong> <strong>Wellness</strong> Survey | Italy | Respiratory Conditions 178LifestyleAge Group% of sufferers Total 18-34 35-44 45-54 55-64 65 +Exercise* 61% 70% 67% 62% 58% 43%Smoke 27% 29% 26% 28% 29% 25%Drink alcohol 72% 79% 75% 74% 66% 62%Obese (BMI ≥ 30) 13% 12% 12% 13% 14% 14%*At least one day per month of vigorous exercise lasting 20 minutes or more.Quality of life60504049.452.2 50.8 49.947.642.4 41.0 41.2 41.5 43.145.046.03020100Total Population Age 18-34 Age 35-44 Age 45-54 Age 55-64 Age 65 +Physical summary scoreMental summary scoreWork productivity <strong>and</strong> activity impairmentAge GroupTotal 18-34 35-44 45-54 55-64 65 +Work Productivity Loss: % overallwork impairment due to health(Base: Employed Full-time)26.1 26.4 27.7 22.9 27.8 29.1Activity Impairment: % activity impairmentdue to health32.2 28.4 30.3 31.4 34.0 39.2Sufferers are self-reported.Respiratory Conditionswww.<strong>Kantar</strong><strong>Health</strong>.com
National <strong>Health</strong> <strong>and</strong> <strong>Wellness</strong> Survey | Italy | Urologic Conditions 179Urologic ConditionsUrologic conditions include the adult population suffering from Benign Prostatic Hyperplasia (BPH), ErectileDysfunction, Overactive Bladder (OAB), Premature Ejaculation, Stress Urinary Incontinence (SUI) <strong>and</strong> Urinary TractInfection.% of adult population with Urologic conditions in ItalyAge GroupTotal 18-34 35-44 45-54 55-64 65 +Self-<strong>Report</strong>ed (% total population) 32% 28% 31% 31% 39% 33%Male 73% 65% 74% 67% 78% 80%Female 27% 35% 26% 33% 22% 20%Diagnosed (% total population) 11% 8% 9% 11% 14% 15%Male 54% 30% 43% 42% 61% 74%Female 46% 70% 57% 58% 39% 26%Total adult population: 51,032,000Medication usageAge Group% of sufferers Total 18-34 35-44 45-54 55-64 65 +Prescription only 17% 11% 12% 17% 18% 25%OTC only* 2% 2% 2% 3% 2% 2%Prescription <strong>and</strong> OTC 2% 1% 2% 2% 2% 1%No product 79% 85% 83% 78% 79% 71%*Including over-the-counter <strong>and</strong> herbal products.AttitudesJJ17% of sufferers prefer to treat themselves with an over-the-counter medication than to depend on a doctor togive them a prescription medication.JJ59% of sufferers are willing to make any lifestyle changes necessary to avoid having to take a prescriptionmedication.Urologic Conditionswww.<strong>Kantar</strong><strong>Health</strong>.com
National <strong>Health</strong> <strong>and</strong> <strong>Wellness</strong> Survey | Italy | Urologic Conditions 180LifestyleAge Group% of sufferers Total 18-34 35-44 45-54 55-64 65 +Exercise* 58% 72% 63% 58% 54% 46%Smoke 26% 31% 28% 29% 28% 18%Drink alcohol 75% 81% 78% 74% 71% 69%Obese (BMI ≥ 30) 15% 8% 12% 18% 20% 15%*At least one day per month of vigorous exercise lasting 20 minutes or more.Quality of life6050403049.543.151.6 50.1 49.8 48.6 47.840.3 41.3 41.943.947.220100Total Population Age 18-34 Age 35-44 Age 45-54 Age 55-64 Age 65 +Physical summary scoreMental summary scoreWork productivity <strong>and</strong> activity impairmentAge GroupTotal 18-34 35-44 45-54 55-64 65 +Work Productivity Loss: % overallwork impairment due to health(Base: Employed Full-time)27.9 31.1 31.8 24.2 23.2 29.5Activity Impairment: % activity impairmentdue to health31.4 32.1 32.4 30.7 30.8 30.9Sufferers are self-reported.Urologic Conditionswww.<strong>Kantar</strong><strong>Health</strong>.com
Japanwww.<strong>Kantar</strong><strong>Health</strong>.com
National <strong>Health</strong> <strong>and</strong> <strong>Wellness</strong> Survey | Japan 182Population profileJJThe average life expectancy remains the highest inthe world. In 2012 it was 86.4 years for women <strong>and</strong>79.9 years for men.JJThe health situation in Japan remains one of thebest in the region.JJJapan is faced with two demographic crises: arapidly aging population <strong>and</strong> population decline. Lowfertility rates have persisted in Japan for severaldecades <strong>and</strong> are currently the second lowest in theworld.Life expectancy <strong>and</strong> causes of deathJJSince the 1980s, the advancement of the agingsociety has shifted disease patterns to lifestylerelateddiseases, such as cancer, heart disease,cerebrovascular disease <strong>and</strong> diabetes. Thesediseases account for 60% of mortality, <strong>and</strong> this trendis expected to continue.JJDue to the increasingly complex social environmentcreated by a high-tech <strong>and</strong> competitive society, itis said that stress levels felt by all age groups arerising, with around 30,000 suicides per year sincethe late 1980s.JJDifficult-to-treat infectious diseases, such astuberculosis, HIV <strong>and</strong> new types of influenza, arebecoming serious threats to public health in Japan.<strong>Health</strong>care systemJJPublic health services are provided by national <strong>and</strong>local governments.JJPatients are free to select the physicians or facilitiesof their choice; no referral is needed to see aspecialist.JJPrivate expenditure is a mix of out-of-pocketspending that includes the co-payments that all whoare publicly insured pay, the premiums paid by theirfamilies, <strong>and</strong> services not covered by public healthinsurance.Reimbursement policiesJJFees for medical services are st<strong>and</strong>ardizednationwide by the Medical Fee Table <strong>and</strong> those fordrugs by the National <strong>Health</strong> Insurance price.JJThe st<strong>and</strong>ard co-payment is 30% of all medicalfees incurred regardless of the type of treatmentreceived, including prescription drugs. A monthlymaximum ceiling exists for out-of-pocket expenses,after which the full cost of treatment is reimbursed.Japanwww.<strong>Kantar</strong><strong>Health</strong>.com
National <strong>Health</strong> <strong>and</strong> <strong>Wellness</strong> Survey | Japan 183General statisticsJJGross national income per capita (Intl $ 1 , 2012): 36,300JJLife expectancy at birth male/female (years): 80/87JJTotal expenditure on health per capita (Intl $, 2012): 3,578JJTotal expenditure on health as % of GDP (2012): 10.1%JJInternet penetration: Total population: 86.3%Lifestyle statistics 3JJTotal % of adult population that:19.1%43.6%2.5%68.5%Smokes Exercises 2 Drinks Alcohol Is Obese (BMI ≥ 30)DemographicsJJTotal population: 127,000,000JJArea size: 377,915 km 2JJDoctors (per 10,000 population): 23.0JJHospital beds (per 10,000 population): 137Rank City % Population51 Tokyo 6.5%2 Yokohama 2.8%3 Osaka 2.0%4 Nagoya 1.7%5 Sapporo 1.5%34121The international $ is a currency unit that is calculated using purchasing power parities (PPP), which are rates ofcurrency conversion constructed to account for differences in price level between countries.2At least one day per month of vigorous exercise lasting 20 minutes or more.3Adult population: 106,460,000Japanwww.<strong>Kantar</strong><strong>Health</strong>.com
National <strong>Health</strong> <strong>and</strong> <strong>Wellness</strong> Survey | Japan | Autoimmune Conditions 184Autoimmune ConditionsAutoimmune conditions include the adult population suffering from Ankylosing Spondylitis, Connective TissueDisease, Idiopathic Thrombocytopenia Purpura (ITP), Inflammatory Bowel Disease (Crohn’s Disease or UlcerativeColitis), Lupus, Psoriasis, Psoriatic Arthritis, Rheumatoid Arthritis <strong>and</strong> Sjögren’s Syndrome.% of adult population with Autoimmune conditions in JapanAge GroupTotal 18-34 35-44 45-54 55-64 65 +Self-<strong>Report</strong>ed (% total population) 2% 1% 2% 2% 2% 2%Male 53% 52% 48% 48% 62% 55%Female 47% 48% 52% 52% 38% 45%Diagnosed (% total population) 2% 1% 2% 2% 2% 2%Male 53% 51% 47% 48% 62% 56%Female 47% 49% 53% 52% 38% 44%Total adult population: 106,460,000Medication usageAge Group% of sufferers Total 18-34 35-44 45-54 55-64 65 +Prescription only 42% 51% 48% 45% 43% 35%OTC only* 9% 7% 6% 8% 11% 12%Prescription <strong>and</strong> OTC 5% 14% 3% 3% 5% 3%No product 44% 28% 44% 44% 42% 51%*Including over-the-counter, herbal products <strong>and</strong> functional foods.AttitudesJJ7% of sufferers prefer to treat themselves with an over-the-counter medication than to depend on a doctor togive them a prescription medication.JJ32% of sufferers are willing to make any lifestyle changes necessary to avoid having to take a prescriptionmedication.Autoimmune Conditionswww.<strong>Kantar</strong><strong>Health</strong>.com
National <strong>Health</strong> <strong>and</strong> <strong>Wellness</strong> Survey | Japan | Autoimmune Conditions 185LifestyleAge Group% of sufferers Total 18-34 35-44 45-54 55-64 65 +Exercise* 48% 59% 47% 33% 43% 55%Smoke 23% 23% 24% 24% 34% 16%Drink alcohol 73% 77% 65% 73% 80% 72%Obese (BMI ≥ 30) 3% 3% 7% 3% 1% 2%*At least one day per month of vigorous exercise lasting 20 minutes or more.Quality of life6050403049.1 48.7 50.3 50.0 49.5 48.7 48.1 49.645.545.140.737.920100Total Population Age 18-34 Age 35-44 Age 45-54 Age 55-64 Age 65 +Physical summary scoreMental summary scoreWork productivity <strong>and</strong> activity impairmentAge GroupTotal 18-34 35-44 45-54 55-64 65 +Work Productivity Loss: % overallwork impairment due to health(Base: Employed Full-time)33.7 44.7 39.1 29.7 21.7 31.8Activity Impairment: % activity impairmentdue to health32.4 43.6 35.8 31.5 24.6 30.4Sufferers are self-reported.Autoimmune Conditionswww.<strong>Kantar</strong><strong>Health</strong>.com
National <strong>Health</strong> <strong>and</strong> <strong>Wellness</strong> Survey | Japan | Cancer Conditions 186Cancer ConditionsCancer conditions include the adult population suffering from Breast Cancer, Cervical Cancer, Colorectal Cancer,Leukemia, Lymphoma, Metastatic Solid Tumor, Non-Small Cell Lung Cancer, Prostate Cancer, Small-Cell LungCancer, Uterine Cancer <strong>and</strong> Other Cancer.% of adult population with Cancer conditions in JapanAge GroupTotal 18-34 35-44 45-54 55-64 65 +Self-<strong>Report</strong>ed (% total population) 4% 1% 1% 3% 5% 9%Male 45% 32% 12% 22% 41% 54%Female 55% 68% 88% 78% 59% 46%Diagnosed (% total population) 4% 1% 1% 2% 4% 9%Male 46% 36% 12% 20% 40% 55%Female 54% 64% 88% 80% 60% 45%Total adult population: 106,460,000Medication usageAge Group% of sufferers Total 18-34 35-44 45-54 55-64 65 +Using prescription 20% 36% 27% 23% 21% 18%Not using prescription 80% 64% 73% 77% 79% 82%Over-the-counter usage was not captured for Cancer.AttitudesJJ3% of sufferers prefer to treat themselves with an over-the-counter medication than to depend on a doctor togive them a prescription medication.JJ30% of sufferers are willing to make any lifestyle changes necessary to avoid having to take a prescriptionmedication.Cancer Conditionswww.<strong>Kantar</strong><strong>Health</strong>.com
National <strong>Health</strong> <strong>and</strong> <strong>Wellness</strong> Survey | Japan | Cancer Conditions 187LifestyleAge Group% of sufferers Total 18-34 35-44 45-54 55-64 65 +Exercise* 51% 54% 40% 36% 41% 57%Smoke 16% 32% 24% 19% 25% 11%Drink alcohol 67% 70% 69% 66% 71% 66%Obese (BMI ≥ 30) 2% 11% 7% 3% 2% 1%*At least one day per month of vigorous exercise lasting 20 minutes or more.Quality of life60504050.3 49.4 49.751.749.7 50.648.5 50.345.1 45.051.43036.720100Total Population Age 18-34 Age 35-44 Age 45-54 Age 55-64 Age 65 +Physical summary scoreMental summary scoreWork productivity <strong>and</strong> activity impairmentAge GroupTotal 18-34 35-44 45-54 55-64 65 +Work Productivity Loss: % overallwork impairment due to health(Base: Employed Full-time)27.3 48.0 40.5 27.7 23.4 17.4Activity Impairment: % activity impairmentdue to health26.0 43.4 30.9 30.0 24.9 24.1Sufferers are self-reported.Cancer Conditionswww.<strong>Kantar</strong><strong>Health</strong>.com
National <strong>Health</strong> <strong>and</strong> <strong>Wellness</strong> Survey | Japan | Cardiovascular Conditions 188Cardiovascular ConditionsCardiovascular conditions include the adult population suffering from Angina Pectoris, Arrhythmia, Atherosclerosis,Atrial Fibrillation, Congestive Heart Failure (CHF), Deep Vein Thrombosis (DVT), Heart Attack, Heart Murmur,High Cholesterol, Hypertension, Left Ventricular Hypertrophy (LVH), Peripheral Arterial Disease (PAD), PeripheralVascular Disease (PVD), Pulmonary Embolism, Stroke or Mini-Stroke/Transient Ischemia <strong>and</strong> Unstable Angina.% of adult population with Cardiovascular conditions in JapanAge GroupTotal 18-34 35-44 45-54 55-64 65 +Self-<strong>Report</strong>ed (% total population) 22% 4% 8% 18% 29% 43%Male 55% 58% 62% 62% 61% 50%Female 45% 42% 38% 38% 39% 50%Diagnosed (% total population) 21% 3% 6% 16% 28% 42%Male 55% 56% 64% 62% 61% 50%Female 45% 44% 36% 38% 39% 50%Total adult population: 106,460,000Medication usageAge Group% of sufferers Total 18-34 35-44 45-54 55-64 65 +Prescription only 69% 23% 37% 56% 71% 79%OTC only* 2% 6% 3% 4% 3% 1%Prescription <strong>and</strong> OTC 4% 6% 3% 4% 2% 4%No product 25% 64% 57% 36% 23% 15%*Including over-the-counter, herbal products <strong>and</strong> functional foods.AttitudesJJ4% of sufferers prefer to treat themselves with an over-the-counter medication than to depend on a doctor togive them a prescription medication.JJ29% of sufferers are willing to make any lifestyle changes necessary to avoid having to take a prescriptionmedication.Cardiovascular Conditionswww.<strong>Kantar</strong><strong>Health</strong>.com
National <strong>Health</strong> <strong>and</strong> <strong>Wellness</strong> Survey | Japan | Cardiovascular Conditions 189LifestyleAge Group% of sufferers Total 18-34 35-44 45-54 55-64 65 +Exercise* 52% 52% 45% 41% 46% 58%Smoke 18% 28% 30% 27% 24% 11%Drink alcohol 70% 73% 72% 74% 76% 67%Obese (BMI ≥ 30) 4% 7% 13% 7% 4% 2%*At least one day per month of vigorous exercise lasting 20 minutes or more.Quality of life60504030201050.7 49.1 50.3 51.1 51.0 50.848.8 50.545.942.337.151.70Total Population Age 18-34 Age 35-44 Age 45-54 Age 55-64 Age 65 +Physical summary scoreMental summary scoreWork productivity <strong>and</strong> activity impairmentAge GroupTotal 18-34 35-44 45-54 55-64 65 +Work Productivity Loss: % overallwork impairment due to health(Base: Employed Full-time)24.8 39.9 31.1 25.9 20.7 17.2Activity Impairment: % activity impairmentdue to health25.7 39.7 33.3 27.9 23.3 24.0Sufferers are self-reported.Cardiovascular Conditionswww.<strong>Kantar</strong><strong>Health</strong>.com
National <strong>Health</strong> <strong>and</strong> <strong>Wellness</strong> Survey | Japan | Gastrointestinal Conditions 190Gastrointestinal ConditionsGastrointestinal conditions include the adult population suffering from Chronic Constipation, Diarrhea, Diverticulitis,Gastroesophageal Reflux Disease (GERD), Heartburn <strong>and</strong> Irritable Bowel Syndrome (IBS).% of adult population with Gastrointestinal conditions in JapanAge GroupTotal 18-34 35-44 45-54 55-64 65 +Self-<strong>Report</strong>ed (% total population) 16% 17% 17% 17% 16% 15%Male 41% 37% 41% 43% 45% 39%Female 59% 63% 59% 57% 55% 61%Diagnosed (% total population) 7% 5% 6% 8% 7% 9%Male 42% 35% 43% 43% 49% 40%Female 58% 65% 57% 57% 51% 60%Total adult population: 106,460,000Medication usageAge Group% of sufferers Total 18-34 35-44 45-54 55-64 65 +Prescription only 18% 10% 12% 15% 20% 31%OTC only* 25% 19% 24% 31% 29% 24%Prescription <strong>and</strong> OTC 8% 5% 6% 9% 10% 13%No product 48% 65% 59% 45% 42% 32%*Including over-the-counter, herbal products <strong>and</strong> functional foods.AttitudesJJ9% of sufferers prefer to treat themselves with an over-the-counter medication than to depend on a doctor togive them a prescription medication.JJ27% of sufferers are willing to make any lifestyle changes necessary to avoid having to take a prescriptionmedication.Gastrointestinal Conditionswww.<strong>Kantar</strong><strong>Health</strong>.com
National <strong>Health</strong> <strong>and</strong> <strong>Wellness</strong> Survey | Japan | Gastrointestinal Conditions 191LifestyleAge Group% of sufferers Total 18-34 35-44 45-54 55-64 65 +Exercise* 44% 44% 39% 39% 39% 53%Smoke 22% 18% 25% 29% 29% 14%Drink alcohol 70% 69% 69% 73% 76% 65%Obese (BMI ≥ 30) 3% 2% 4% 5% 2% 1%*At least one day per month of vigorous exercise lasting 20 minutes or more.Quality of life60504030201051.0 52.8 51.9 50.7 50.4 49.344.542.644.546.439.849.00Total Population Age 18-34 Age 35-44 Age 45-54 Age 55-64 Age 65 +Physical summary scoreMental summary scoreWork productivity <strong>and</strong> activity impairmentAge GroupTotal 18-34 35-44 45-54 55-64 65 +Work Productivity Loss: % overallwork impairment due to health(Base: Employed Full-time)29.9 34.8 31.4 29.0 24.2 19.3Activity Impairment: % activity impairmentdue to health31.3 35.3 33.5 30.5 25.7 29.9Sufferers are self-reported.Gastrointestinal Conditionswww.<strong>Kantar</strong><strong>Health</strong>.com
National <strong>Health</strong> <strong>and</strong> <strong>Wellness</strong> Survey | Japan | Infectious Diseases 192Infectious DiseasesInfectious Diseases include the adult population suffering from AIDS, C. Difficile, Community-Acquired Pneumonia(CAP), Genital Herpes, Genital Warts, Hospital-Acquired Pneumonia (HAP), Hepatitis A, Hepatitis B, Hepatitis C,HIV, Tuberculosis <strong>and</strong> Yeast Infection.% of adult population with Infectious Diseases in JapanAge GroupTotal 18-34 35-44 45-54 55-64 65 +Self-<strong>Report</strong>ed (% total population) 4% 2% 2% 3% 4% 5%Male 48% 28% 39% 52% 60% 51%Female 53% 72% 61% 48% 40% 49%Diagnosed (% total population) 3% 2% 2% 2% 3% 5%Male 47% 27% 38% 53% 60% 50%Female 53% 73% 62% 47% 40% 50%Total adult population: 106,460,000Medication usageAge Group% of sufferers Total 18-34 35-44 45-54 55-64 65 +Using prescription 17% 30% 18% 12% 20% 14%Not using prescription 83% 70% 82% 88% 80% 86%Over-the-counter usage was not captured for Infectious Diseases.AttitudesJJ7% of sufferers prefer to treat themselves with an over-the-counter medication than to depend on a doctor togive them a prescription medication.JJ30% of sufferers are willing to make any lifestyle changes necessary to avoid having to take a prescriptionmedication.Infectious Diseaseswww.<strong>Kantar</strong><strong>Health</strong>.com
National <strong>Health</strong> <strong>and</strong> <strong>Wellness</strong> Survey | Japan | Infectious Diseases 193LifestyleAge Group% of sufferers Total 18-34 35-44 45-54 55-64 65 +Exercise* 49% 57% 37% 45% 39% 54%Smoke 22% 31% 28% 30% 25% 13%Drink alcohol 69% 77% 70% 73% 74% 63%Obese (BMI ≥ 30) 3% 4% 7% 2% 1% 2%*At least one day per month of vigorous exercise lasting 20 minutes or more.Quality of life6050403050.7 50.246.239.252.1 50.9 50.5 50.447.744.741.749.720100Total Population Age 18-34 Age 35-44 Age 45-54 Age 55-64 Age 65 +Physical summary scoreMental summary scoreWork productivity <strong>and</strong> activity impairmentAge GroupTotal 18-34 35-44 45-54 55-64 65 +Work Productivity Loss: % overallwork impairment due to health(Base: Employed Full-time)32.8 46.9 35.1 28.3 24.5 21.8Activity Impairment: % activity impairmentdue to health31.1 40.8 35.2 31.8 23.9 28.8Sufferers are self-reported.Infectious Diseaseswww.<strong>Kantar</strong><strong>Health</strong>.com
National <strong>Health</strong> <strong>and</strong> <strong>Wellness</strong> Survey | Japan | Metabolic Conditions 194Metabolic ConditionsMetabolic conditions include the adult population suffering from High Cholesterol, Hypertension, Obesity, ThyroidCondition, Type 1 Diabetes <strong>and</strong> Type 2 Diabetes.% of adult population with Metabolic conditions in JapanAge GroupTotal 18-34 35-44 45-54 55-64 65 +Self-<strong>Report</strong>ed (% total population) 23% 5% 10% 19% 30% 43%Male 55% 63% 66% 62% 61% 49%Female 45% 37% 34% 38% 39% 51%Diagnosed (% total population) 20% 2% 6% 16% 28% 41%Male 54% 47% 63% 62% 61% 50%Female 46% 53% 37% 38% 39% 50%Total adult population: 106,460,000Medication usageAge Group% of sufferers Total 18-34 35-44 45-54 55-64 65 +Prescription only 69% 20% 37% 58% 72% 80%OTC only* 2% 3% 2% 4% 4% 2%Prescription <strong>and</strong> OTC 4% 2% 4% 4% 3% 5%No product 24% 75% 57% 34% 21% 14%*Including over-the-counter, herbal products <strong>and</strong> functional foods.AttitudesJJ4% of sufferers prefer to treat themselves with an over-the-counter medication than to depend on a doctor togive them a prescription medication.JJ28% of sufferers are willing to make any lifestyle changes necessary to avoid having to take a prescriptionmedication.Metabolic Conditionswww.<strong>Kantar</strong><strong>Health</strong>.com
National <strong>Health</strong> <strong>and</strong> <strong>Wellness</strong> Survey | Japan | Metabolic Conditions 195LifestyleAge Group% of sufferers Total 18-34 35-44 45-54 55-64 65 +Exercise* 51% 46% 44% 39% 46% 58%Smoke 19% 22% 27% 27% 25% 12%Drink alcohol 69% 64% 69% 73% 75% 66%Obese (BMI ≥ 30) 11% 52% 42% 17% 6% 3%*At least one day per month of vigorous exercise lasting 20 minutes or more.Quality of life60504030201050.9 52.3 51.649.151.0 50.948.9 50.746.043.140.651.70Total Population Age 18-34 Age 35-44 Age 45-54 Age 55-64 Age 65 +Physical summary scoreMental summary scoreWork productivity <strong>and</strong> activity impairmentAge GroupTotal 18-34 35-44 45-54 55-64 65 +Work Productivity Loss: % overallwork impairment due to health(Base: Employed Full-time)24.3 34.0 30.8 25.1 20.4 17.9Activity Impairment: % activity impairmentdue to health25.0 32.6 30.3 26.6 23.0 23.7Sufferers are self-reported.Metabolic Conditionswww.<strong>Kantar</strong><strong>Health</strong>.com
National <strong>Health</strong> <strong>and</strong> <strong>Wellness</strong> Survey | Japan | Musculoskeletal Conditions 196Musculoskeletal ConditionsMusculoskeletal conditions include the adult population suffering from Gout, Muscular Dystrophy, Osteoarthritis,Osteopenia, Osteoporosis <strong>and</strong> Paget’s Disease.% of adult population with Musculoskeletal conditions in JapanAge GroupTotal 18-34 35-44 45-54 55-64 65 +Self-<strong>Report</strong>ed (% total population) 7% 1% 2% 5% 9% 15%Male 46% 65% 71% 64% 55% 35%Female 54% 35% 29% 36% 45% 65%Diagnosed (% total population) 7% 1% 2% 4% 8% 14%Male 45% 62% 71% 64% 55% 35%Female 55% 38% 29% 36% 45% 65%Total adult population: 106,460,000Medication usageAge Group% of sufferers Total 18-34 35-44 45-54 55-64 65 +Prescription only 38% 28% 43% 38% 44% 36%OTC only* 13% 11% 9% 10% 12% 14%Prescription <strong>and</strong> OTC 17% 25% 7% 8% 10% 21%No product 33% 36% 41% 43% 33% 29%*Including over-the-counter, herbal products <strong>and</strong> functional foods.AttitudesJJ5% of sufferers prefer to treat themselves with an over-the-counter medication than to depend on a doctor togive them a prescription medication.JJ30% of sufferers are willing to make any lifestyle changes necessary to avoid having to take a prescriptionmedication.Musculoskeletal Conditionswww.<strong>Kantar</strong><strong>Health</strong>.com
National <strong>Health</strong> <strong>and</strong> <strong>Wellness</strong> Survey | Japan | Musculoskeletal Conditions 197LifestyleAge Group% of sufferers Total 18-34 35-44 45-54 55-64 65 +Exercise* 52% 63% 46% 41% 48% 55%Smoke 18% 37% 34% 29% 26% 11%Drink alcohol 71% 79% 78% 84% 79% 65%Obese (BMI ≥ 30) 4% 11% 13% 8% 4% 2%*At least one day per month of vigorous exercise lasting 20 minutes or more.Quality of life6050403049.248.446.336.850.2 50.6 49.9 48.746.1 47.343.550.320100Total Population Age 18-34 Age 35-44 Age 45-54 Age 55-64 Age 65 +Physical summary scoreMental summary scoreWork productivity <strong>and</strong> activity impairmentAge GroupTotal 18-34 35-44 45-54 55-64 65 +Work Productivity Loss: % overallwork impairment due to health(Base: Employed Full-time)27.5 56.6 29.2 25.0 24.7 19.4Activity Impairment: % activity impairmentdue to health29.8 48.1 31.5 28.1 27.8 29.7Sufferers are self-reported.Musculoskeletal Conditionswww.<strong>Kantar</strong><strong>Health</strong>.com
National <strong>Health</strong> <strong>and</strong> <strong>Wellness</strong> Survey | Japan | Neurological Conditions 198Neurological ConditionsNeurological conditions include the adult population suffering from Epilepsy, Hemiplegia, Migraine, MultipleSclerosis, Parkinson’s Disease <strong>and</strong> Restless Legs Syndrome (RLS).% of adult population with Neurological conditions in JapanAge GroupTotal 18-34 35-44 45-54 55-64 65 +Self-<strong>Report</strong>ed (% total population) 9% 13% 14% 11% 7% 4%Male 32% 32% 32% 32% 31% 33%Female 68% 68% 68% 68% 69% 67%Diagnosed (% total population) 5% 6% 7% 6% 3% 2%Male 31% 34% 30% 32% 29% 30%Female 69% 66% 70% 68% 71% 70%Total adult population: 106,460,000Medication usageAge Group% of sufferers Total 18-34 35-44 45-54 55-64 65 +Prescription only 14% 12% 11% 15% 18% 21%OTC only* 43% 42% 45% 49% 38% 30%Prescription <strong>and</strong> OTC 6% 5% 8% 8% 4% 4%No product 37% 42% 35% 28% 40% 45%*Including over-the-counter, herbal products <strong>and</strong> functional foods.AttitudesJJ11% of sufferers prefer to treat themselves with an over-the-counter medication than to depend on a doctor togive them a prescription medication.JJ26% of sufferers are willing to make any lifestyle changes necessary to avoid having to take a prescriptionmedication.Neurological Conditionswww.<strong>Kantar</strong><strong>Health</strong>.com
National <strong>Health</strong> <strong>and</strong> <strong>Wellness</strong> Survey | Japan | Neurological Conditions 199LifestyleAge Group% of sufferers Total 18-34 35-44 45-54 55-64 65 +Exercise* 41% 41% 38% 35% 42% 57%Smoke 23% 21% 25% 29% 26% 9%Drink alcohol 67% 68% 65% 68% 68% 61%Obese (BMI ≥ 30) 3% 2% 4% 3% 2% 2%*At least one day per month of vigorous exercise lasting 20 minutes or more.Quality of life6050403050.9 52.7 51.5 50.3 49.5 47.743.240.642.644.5 45.3 46.220100Total Population Age 18-34 Age 35-44 Age 45-54 Age 55-64 Age 65 +Physical summary scoreMental summary scoreWork productivity <strong>and</strong> activity impairmentAge GroupTotal 18-34 35-44 45-54 55-64 65 +Work Productivity Loss: % overallwork impairment due to health(Base: Employed Full-time)33.4 35.0 35.7 29.7 29.9 32.8Activity Impairment: % activity impairmentdue to health34.2 35.6 35.7 32.6 30.9 33.4Sufferers are self-reported.Neurological Conditionswww.<strong>Kantar</strong><strong>Health</strong>.com
National <strong>Health</strong> <strong>and</strong> <strong>Wellness</strong> Survey | Japan | Ophthalmic Conditions 200Ophthalmic ConditionsOphthalmic conditions include the adult population suffering from Cataracts, Dry Eye, Glaucoma <strong>and</strong> MacularDegeneration.% of adult population with Ophthalmic conditions in JapanAge GroupTotal 18-34 35-44 45-54 55-64 65 +Self-<strong>Report</strong>ed (% total population) 13% 7% 8% 10% 12% 22%Male 40% 44% 34% 37% 43% 40%Female 60% 56% 66% 63% 57% 60%Diagnosed (% total population) 11% 4% 5% 8% 11% 21%Male 39% 42% 33% 34% 43% 40%Female 61% 58% 67% 66% 57% 60%Total adult population: 106,460,000Medication usageAge Group% of sufferers Total 18-34 35-44 45-54 55-64 65 +Prescription only 37% 17% 22% 32% 38% 45%OTC only* 15% 29% 29% 25% 15% 6%Prescription <strong>and</strong> OTC 6% 10% 8% 6% 8% 5%No product 42% 44% 41% 37% 39% 44%*Including over-the-counter, herbal products <strong>and</strong> functional foods.AttitudesJJ6% of sufferers prefer to treat themselves with an over-the-counter medication than to depend on a doctor togive them a prescription medication.JJ30% of sufferers are willing to make any lifestyle changes necessary to avoid having to take a prescriptionmedication.Ophthalmic Conditionswww.<strong>Kantar</strong><strong>Health</strong>.com
National <strong>Health</strong> <strong>and</strong> <strong>Wellness</strong> Survey | Japan | Ophthalmic Conditions 201LifestyleAge Group% of sufferers Total 18-34 35-44 45-54 55-64 65 +Exercise* 51% 51% 39% 42% 45% 58%Smoke 16% 24% 19% 20% 21% 11%Drink alcohol 69% 72% 72% 75% 74% 65%Obese (BMI ≥ 30) 2% 2% 4% 4% 1% 1%*At least one day per month of vigorous exercise lasting 20 minutes or more.Quality of life6050403050.847.652.6 51.8 51.1 50.4 50.147.643.6 44.939.551.120100Total Population Age 18-34 Age 35-44 Age 45-54 Age 55-64 Age 65 +Physical summary scoreMental summary scoreWork productivity <strong>and</strong> activity impairmentAge GroupTotal 18-34 35-44 45-54 55-64 65 +Work Productivity Loss: % overallwork impairment due to health(Base: Employed Full-time)29.9 37.5 32.2 28.1 25.3 20.9Activity Impairment: % activity impairmentdue to health28.4 36.6 33.1 30.4 25.8 25.5Sufferers are self-reported.Ophthalmic Conditionswww.<strong>Kantar</strong><strong>Health</strong>.com
National <strong>Health</strong> <strong>and</strong> <strong>Wellness</strong> Survey | Japan | Pain Conditions 202Pain ConditionsOphthalmic conditions include the adult population suffering from Arthritis, Back Problems, Bladder Pain, BrokenBones, Cancer, Carpal Tunnel Syndrome, Dental Pain, Diabetic Neuropathic Pain, Fibromyalgia, Headache,Herpes Zoster/Shingles, Hip/Pelvic Pain, Joint Pain, Lower Back Pain, Menstrual Cycle, Migraine, Neck Pain,Neuropathic Pain, Phantom Limb Pain, Pinched Nerve in Lower Back, Plantar Fasciitis, Post-Herpetic Neuralgia,Shoulder Pain or Stiffness, Spinal Disk, Sprains or Strains, Surgery or Other Medical Procedure, Tendonitis <strong>and</strong>Other Pain.% of adult population with Pain conditions in JapanAge GroupTotal 18-34 35-44 45-54 55-64 65 +Self-<strong>Report</strong>ed (% total population) 15% 12% 15% 19% 17% 15%Male 46% 48% 48% 47% 49% 41%Female 54% 52% 52% 53% 51% 59%Diagnosed (% total population) 9% 4% 7% 11% 10% 11%Male 43% 43% 46% 44% 47% 38%Female 57% 57% 54% 56% 53% 62%Total adult population: 106,460,000Medication usageAge Group% of sufferers Total 18-34 35-44 45-54 55-64 65 +Prescription only 17% 10% 12% 15% 17% 24%OTC only* 27% 25% 31% 33% 29% 21%Prescription <strong>and</strong> OTC 4% 3% 5% 4% 4% 6%No product 51% 62% 53% 47% 50% 49%*Including over-the-counter, herbal products <strong>and</strong> functional foods.AttitudesJJ8% of sufferers prefer to treat themselves with an over-the-counter medication than to depend on a doctor togive them a prescription medication.JJ27% of sufferers are willing to make any lifestyle changes necessary to avoid having to take a prescriptionmedication.Pain Conditionswww.<strong>Kantar</strong><strong>Health</strong>.com
National <strong>Health</strong> <strong>and</strong> <strong>Wellness</strong> Survey | Japan | Pain Conditions 203LifestyleAge Group% of sufferers Total 18-34 35-44 45-54 55-64 65 +Exercise* 44% 46% 36% 39% 40% 54%Smoke 23% 19% 28% 29% 31% 14%Drink alcohol 71% 68% 71% 74% 76% 67%Obese (BMI ≥ 30) 4% 4% 6% 5% 3% 2%*At least one day per month of vigorous exercise lasting 20 minutes or more.Quality of life6050403048.945.151.1 50.0 49.5 48.545.2 46.0 46.842.839.549.220100Total Population Age 18-34 Age 35-44 Age 45-54 Age 55-64 Age 65 +Physical summary scoreMental summary scoreWork productivity <strong>and</strong> activity impairmentAge GroupTotal 18-34 35-44 45-54 55-64 65 +Work Productivity Loss: % overallwork impairment due to health(Base: Employed Full-time)31.1 36.2 35.0 28.5 28.1 18.5Activity Impairment: % activity impairmentdue to health33.6 37.6 35.8 31.5 31.4 33.0Sufferers are self-reported.Pain Conditionswww.<strong>Kantar</strong><strong>Health</strong>.com
National <strong>Health</strong> <strong>and</strong> <strong>Wellness</strong> Survey | Japan | Psychiatric Conditions 204Psychiatric ConditionsPsychiatric conditions include the adult population suffering from Anxiety, Attention Deficit/Hyperactivity Disorder(ADHD), Bipolar Disorder, Depression, Generalized Anxiety Disorder (GAD), Obsessive Compulsive Disorder(OCD), Phobias, Post Traumatic Stress Disorder (PTSD), Schizophrenia <strong>and</strong> Social Anxiety Disorder (SAD).% of adult population with Psychiatric conditions in JapanAge GroupTotal 18-34 35-44 45-54 55-64 65 +Self-<strong>Report</strong>ed (% total population) 5% 9% 8% 6% 4% 2%Male 47% 45% 46% 53% 50% 36%Female 53% 55% 54% 47% 50% 64%Diagnosed (% total population) 5% 8% 7% 6% 3% 1%Male 47% 45% 47% 54% 52% 36%Female 53% 55% 53% 46% 48% 64%Total adult population: 106,460,000Medication usageAge Group% of sufferers Total 18-34 35-44 45-54 55-64 65 +Prescription only 62% 55% 64% 69% 66% 62%OTC only* 4% 6% 3% 2% 6% 3%Prescription <strong>and</strong> OTC 7% 8% 6% 8% 7% 10%No product 26% 32% 27% 20% 21% 25%*Including over-the-counter, herbal products <strong>and</strong> functional foods.AttitudesJJ9% of sufferers prefer to treat themselves with an over-the-counter medication than to depend on a doctor togive them a prescription medication.JJ26% of sufferers are willing to make any lifestyle changes necessary to avoid having to take a prescriptionmedication.Psychiatric Conditionswww.<strong>Kantar</strong><strong>Health</strong>.com
National <strong>Health</strong> <strong>and</strong> <strong>Wellness</strong> Survey | Japan | Psychiatric Conditions 205LifestyleAge Group% of sufferers Total 18-34 35-44 45-54 55-64 65 +Exercise* 42% 45% 40% 38% 32% 49%Smoke 27% 23% 27% 35% 32% 24%Drink alcohol 67% 66% 64% 70% 78% 58%Obese (BMI ≥ 30) 7% 5% 10% 6% 9% 5%*At least one day per month of vigorous exercise lasting 20 minutes or more.Quality of life60504030201050.4 51.8 50.6 49.4 48.6 48.334.032.0 33.335.5 35.839.10Total Population Age 18-34 Age 35-44 Age 45-54 Age 55-64 Age 65 +Physical summary scoreMental summary scoreWork productivity <strong>and</strong> activity impairmentAge GroupTotal 18-34 35-44 45-54 55-64 65 +Work Productivity Loss: % overallwork impairment due to health(Base: Employed Full-time)48.3 49.5 53.5 44.1 41.7 36.1Activity Impairment: % activity impairmentdue to health48.1 49.0 49.9 48.0 41.7 45.5Sufferers are self-reported.Psychiatric Conditionswww.<strong>Kantar</strong><strong>Health</strong>.com
National <strong>Health</strong> <strong>and</strong> <strong>Wellness</strong> Survey | Japan | Respiratory Conditions 206Respiratory ConditionsRespiratory conditions include the adult population suffering from Asthma, Chronic Bronchitis, Chronic ObstructivePulmonary Disease (COPD), Cystic Fibrosis, Emphysema, Hay Fever <strong>and</strong> Nasal Allergies.% of adult population with Respiratory conditions in JapanAge GroupTotal 18-34 35-44 45-54 55-64 65 +Self-<strong>Report</strong>ed (% total population) 25% 25% 28% 28% 24% 20%Male 47% 49% 46% 45% 51% 46%Female 53% 51% 54% 55% 49% 54%Diagnosed (% total population) 19% 18% 21% 22% 18% 17%Male 46% 47% 44% 43% 53% 45%Female 54% 53% 56% 57% 47% 55%Total adult population: 106,460,000Medication usageAge Group% of sufferers Total 18-34 35-44 45-54 55-64 65 +Prescription only 18% 13% 14% 16% 17% 27%OTC only* 33% 34% 38% 38% 36% 23%Prescription <strong>and</strong> OTC 7% 9% 8% 7% 6% 6%No product 42% 44% 40% 39% 40% 44%*Including over-the-counter, herbal products <strong>and</strong> functional foods.AttitudesJJ8% of sufferers prefer to treat themselves with an over-the-counter medication than to depend on a doctor togive them a prescription medication.JJ27% of sufferers are willing to make any lifestyle changes necessary to avoid having to take a prescriptionmedication.Respiratory Conditionswww.<strong>Kantar</strong><strong>Health</strong>.com
National <strong>Health</strong> <strong>and</strong> <strong>Wellness</strong> Survey | Japan | Respiratory Conditions 207LifestyleAge Group% of sufferers Total 18-34 35-44 45-54 55-64 65 +Exercise* 47% 45% 40% 43% 49% 57%Smoke 17% 17% 21% 21% 20% 10%Drink alcohol 73% 71% 73% 76% 77% 70%Obese (BMI ≥ 30) 3% 2% 4% 3% 2% 1%*At least one day per month of vigorous exercise lasting 20 minutes or more.Quality of life60504030201052.3 53.8 53.0 52.0 51.949.3 50.947.042.845.0 46.851.40Total Population Age 18-34 Age 35-44 Age 45-54 Age 55-64 Age 65 +Physical summary scoreMental summary scoreWork productivity <strong>and</strong> activity impairmentAge GroupTotal 18-34 35-44 45-54 55-64 65 +Work Productivity Loss: % overallwork impairment due to health(Base: Employed Full-time)25.2 28.9 26.8 24.0 20.0 18.8Activity Impairment: % activity impairmentdue to health25.8 29.2 27.8 25.5 21.6 23.6Sufferers are self-reported.Respiratory Conditionswww.<strong>Kantar</strong><strong>Health</strong>.com
National <strong>Health</strong> <strong>and</strong> <strong>Wellness</strong> Survey | Japan | Urologic Conditions 208Urologic ConditionsUrologic conditions include the adult population suffering from Benign Prostatic Hyperplasia (BPH), ErectileDysfunction, Overactive Bladder/SUI (OAB), Premature Ejaculation <strong>and</strong> Urinary Tract Infection.% of adult population with Urologic conditions in JapanAge GroupTotal 18-34 35-44 45-54 55-64 65 +Self-<strong>Report</strong>ed (% total population) 22% 13% 18% 22% 26% 28%Male 91% 95% 95% 89% 92% 88%Female 9% 5% 5% 11% 8% 12%Diagnosed (% total population) 3% 1% 1% 1% 4% 8%Male 74% 56% 50% 51% 72% 80%Female 26% 44% 50% 49% 28% 20%Total adult population: 106,460,000Medication usageAge Group% of sufferers Total 18-34 35-44 45-54 55-64 65 +Prescription only 9% 2% 4% 6% 9% 16%OTC only* 1% 0% 0% 0% 1% 1%Prescription <strong>and</strong> OTC 1% 2% 0% 0% 0% 1%No product 89% 96% 96% 93% 90% 81%*Including over-the-counter, herbal products <strong>and</strong> functional foods.AttitudesJJ7% of sufferers prefer to treat themselves with an over-the-counter medication than to depend on a doctor togive them a prescription medication.JJ26% of sufferers are willing to make any lifestyle changes necessary to avoid having to take a prescriptionmedication.Urologic Conditionswww.<strong>Kantar</strong><strong>Health</strong>.com
National <strong>Health</strong> <strong>and</strong> <strong>Wellness</strong> Survey | Japan | Urologic Conditions 209LifestyleAge Group% of sufferers Total 18-34 35-44 45-54 55-64 65 +Exercise* 49% 47% 44% 42% 42% 58%Smoke 27% 25% 33% 35% 32% 18%Drink alcohol 79% 72% 78% 82% 85% 76%Obese (BMI ≥ 30) 4% 5% 7% 6% 3% 2%*At least one day per month of vigorous exercise lasting 20 minutes or more.Quality of life60504030201051.7 52.6 52.3 52.2 51.9 50.947.248.045.640.442.751.70Total Population Age 18-34 Age 35-44 Age 45-54 Age 55-64 Age 65 +Physical summary scoreMental summary scoreWork productivity <strong>and</strong> activity impairmentAge GroupTotal 18-34 35-44 45-54 55-64 65 +Work Productivity Loss: % overallwork impairment due to health(Base: Employed Full-time)27.7 36.9 32.6 25.1 22.4 20.6Activity Impairment: % activity impairmentdue to health26.7 35.0 32.8 25.9 22.6 23.6Sufferers are self-reported.Urologic Conditionswww.<strong>Kantar</strong><strong>Health</strong>.com
Russiawww.<strong>Kantar</strong><strong>Health</strong>.com
National <strong>Health</strong> <strong>and</strong> <strong>Wellness</strong> Survey | Russia 211Population profileJJRussia’s birth rate fluctuated after the fall of theSoviet Union, though it has increased steadily since2006.JJMortality in Russia is significantly higher than boththe regional <strong>and</strong> global averages.JJIn the population older than 65, women outnumbermen more than 2-1. The average life expectancy fora male is 63 years <strong>and</strong> for women is 75 years.Life expectancy <strong>and</strong> causes of deathJJThe main causes of death are diseases of thecardiovascular system. Cancer is the secondleading cause of death, accounting for about 16% ofdeaths.JJThe infant mortality rate has fallen by about half inthe past two decades, from 1.8% in 1992 to 0.87%in 2012.JJAlcohol use causes high mortality, especially amongmen. However, this rate has decreased by 75%since 2005.JJRussia has a high burden of tuberculosis, thoughtuberculosis mortality rate has decreased by 45%since 2005.JJNearly 60% of Russian adults are overweight, <strong>and</strong>26% are obese. It is predicted that 33% of men <strong>and</strong>26% of women will be obese by 2030.<strong>Health</strong>care systemJJThe Ministry of <strong>Health</strong> <strong>and</strong> Social Development isthe coordinator of the country’s overall health policy.JJThe vast majority of public health institutions areowned <strong>and</strong> operated by municipalities or at thefederal level, with only 5% to 10% being privateinstitutions.JJRussians often bypass primary care providers <strong>and</strong>approach specialists directly, as patients have nofaith in their local district polyclinics. Primary carephysicians also tend to over-refer patients becausetheir own training is usually weak, <strong>and</strong> in manycases they receive compensation for referringpatients to a specialist.Reimbursement policiesJJWhile the Guaranteed Package Program issupposed to cover an extensive range of servicesfor free, available resources are insufficient <strong>and</strong>patients usually pay for many pharmaceutical <strong>and</strong>other medical services.JJSome budget <strong>and</strong> insurance funds are allocatedfor medications; however, these programs onlycover 11% of the population <strong>and</strong> much paperwork isneeded to get these medications as an outpatient.As a result, the majority of out-patient medicationsare out-of-pocket costs.Russiawww.<strong>Kantar</strong><strong>Health</strong>.com
National <strong>Health</strong> <strong>and</strong> <strong>Wellness</strong> Survey | Russia 212General statisticsJJGross national income per capita (Intl $ 1 , 2012): 22,720JJLife expectancy at birth male/female (years): 63/75JJTotal expenditure on health per capita (Intl $, 2012): 1,474JJTotal expenditure on health as % of GDP (2012): 6.3%JJInternet penetration: Total population: 61.4%Lifestyle statistics 3JJTotal % of adult population that:33.3%54.4%73.4%18.8%Smokes Exercises 2 Drinks Alcohol Is Obese (BMI ≥ 30)DemographicsJJTotal population: 143,000,000JJArea size: 17,098,242 km 2JJDoctors (per 10,000 population): 43.1JJHospital beds (per 10,000 population): 97Rank City % Population1 Moscow 7.4%2 Saint Petersburg 2.9%3 Novosibirsk 1.0%4 Yekaterinburg 0.9%5 Nizhny Novgorod 0.9%21 5431The international $ is a currency unit that is calculated using purchasing power parities (PPP), which are rates ofcurrency conversion constructed to account for differences in price level between countries.2At least one day per month of vigorous exercise lasting 20 minutes or more.3Total urban adult population: 87,171,000Russiawww.<strong>Kantar</strong><strong>Health</strong>.com
National <strong>Health</strong> <strong>and</strong> <strong>Wellness</strong> Survey | Russia | Autoimmune Conditions 213Autoimmune ConditionsAutoimmune conditions include the adult population suffering from Ankylosing Spondylitis, Connective TissueDisease, Idiopathic Thrombocytopenia Purpura (ITP), Inflammatory Bowel Disease (Crohn’s Disease or UlcerativeColitis), Lupus, Psoriasis, Psoriatic Arthritis, Rheumatoid Arthritis <strong>and</strong> Sjögren’s Syndrome.% of adult population with Autoimmune conditions in RussiaAge GroupTotal 18-34 35-44 45-54 55-64 65 +Self-<strong>Report</strong>ed (% total population) 7% 5% 7% 8% 7% 9%Male 46% 59% 54% 44% 39% 27%Female 54% 41% 46% 56% 61% 73%Diagnosed (% total population) 5% 4% 6% 7% 6% 7%Male 44% 58% 47% 45% 37% 29%Female 56% 42% 53% 55% 63% 71%Total urban adult population: 87,171,000Medication usageAge Group% of sufferers Total 18-34 35-44 45-54 55-64 65 +Prescription only* 22% 26% 21% 24% 15% 19%OTC only † 24% 22% 23% 27% 25% 25%Prescription <strong>and</strong> OTC 26% 25% 24% 21% 30% 31%No product 28% 26% 32% 27% 29% 25%*Medications that require prescriptions in other countries.†Vitamins, food supplements, <strong>and</strong> folk medicine.AttitudesJJJJ33% of sufferers would rather treat themselves than consult a doctor.52% of sufferers are willing to make any lifestyle changes necessary to avoid having to take a medication.Autoimmune Conditionswww.<strong>Kantar</strong><strong>Health</strong>.com
National <strong>Health</strong> <strong>and</strong> <strong>Wellness</strong> Survey | Russia | Autoimmune Conditions 214LifestyleAge Group% of sufferers Total 18-34 35-44 45-54 55-64 65 +Exercise* 56% 72% 50% 49% 57% 49%Smoke 39% 46% 51% 47% 30% 12%Drink alcohol 75% 88% 87% 75% 72% 51%Obese (BMI ≥ 30) 21% 6% 17% 26% 23% 38%*At least one day per month of vigorous exercise lasting 20 minutes or more.Quality of life6050403047.042.249.0 49.145.9 47.039.8 41.2 42.647.043.742.820100Total Population Age 18-34 Age 35-44 Age 45-54 Age 55-64 Age 65 +Physical summary scoreMental summary scoreWork productivity <strong>and</strong> activity impairmentAge GroupTotal 18-34 35-44 45-54 55-64 65 +Work Productivity Loss: % overallwork impairment due to health(Base: Employed Full-time)29.1 31.7 29.2 28.6 17.1 47.7Activity Impairment: % activity impairmentdue to health34.0 34.4 31.4 34.2 30.5 38.4Sufferers are self-reported.Autoimmune Conditionswww.<strong>Kantar</strong><strong>Health</strong>.com
National <strong>Health</strong> <strong>and</strong> <strong>Wellness</strong> Survey | Russia | Cancer Conditions 215Cancer ConditionsCancer conditions include the adult population suffering from Breast Cancer, Cervical Cancer, Colorectal Cancer,Leukemia, Lymphoma, Metastatic Solid Tumor, Non-Small Cell Lung Cancer, Prostate Cancer, Skin Cancer, Small-Cell Lung Cancer, Uterine Cancer <strong>and</strong> Other Cancer.% of adult population with Cancer conditions in RussiaAge GroupTotal 18-34 35-44 45-54 55-64 65 +Self-<strong>Report</strong>ed (% total population) 4% 2% 2% 5% 7% 6%Male 32% 51% 32% 23% 26% 35%Female 68% 49% 68% 77% 74% 65%Diagnosed (% total population) 3% 1% 1% 4% 5% 5%Male 29% 39% 35% 18% 25% 36%Female 71% 61% 65% 82% 75% 64%Total urban adult population: 87,171,000Medication usageAge Group% of sufferers Total 18-34 35-44 45-54 55-64 65 +Using prescription 21% 34% 29% 12% 15% 27%Not using prescription 79% 66% 71% 88% 85% 73%Vitamins, food supplements, <strong>and</strong> folk medicine were not captured for Infectious Diseases.AttitudesJJJJ26% of sufferers would rather treat themselves than consult a doctor.54% of sufferers are willing to make any lifestyle changes necessary to avoid having to take a medication.Cancer Conditionswww.<strong>Kantar</strong><strong>Health</strong>.com
National <strong>Health</strong> <strong>and</strong> <strong>Wellness</strong> Survey | Russia | Cancer Conditions 216LifestyleAge Group% of sufferers Total 18-34 35-44 45-54 55-64 65 +Exercise* 53% 69% 49% 51% 52% 46%Smoke 29% 36% 47% 33% 29% 15%Drink alcohol 73% 90% 85% 70% 72% 62%Obese (BMI ≥ 30) 22% 11% 4% 29% 18% 34%*At least one day per month of vigorous exercise lasting 20 minutes or more.Quality of life6050403046.6 46.3 46.3 47.5 47.743.243.140.035.847.344.943.920100Total Population Age 18-34 Age 35-44 Age 45-54 Age 55-64 Age 65 +Physical summary scoreMental summary scoreWork productivity <strong>and</strong> activity impairmentAge GroupTotal 18-34 35-44 45-54 55-64 65 +Work Productivity Loss: % overallwork impairment due to health(Base: Employed Full-time)31.5 45.3 32.2 27.4 19.3 42.6Activity Impairment: % activity impairmentdue to health33.3 37.9 37.7 31.1 27.5 36.9Sufferers are self-reported.Cancer Conditionswww.<strong>Kantar</strong><strong>Health</strong>.com
National <strong>Health</strong> <strong>and</strong> <strong>Wellness</strong> Survey | Russia | Cardviovascular Conditions 217Cardiovascular ConditionsCardiovascular conditions include the adult population suffering from Angina Pectoris, Arrhythmia, Atherosclerosis,Atrial Fibrillation, Congestive Heart Failure (CHF), Deep Vein Thrombosis (DVT), Heart Attack, High Cholesterol,Hypertension, Left Ventricular Hypertrophy (LVH), Peripheral Arterial Disease (PAD), Peripheral Vascular Disease(PVD), Pulmonary Arterial Hypertension (PAH), Pulmonary Embolism, Stroke or Mini-Stroke/Transient Ischemia<strong>and</strong> Unstable Angina.% of adult population with Cardiovascular conditions in RussiaAge GroupTotal 18-34 35-44 45-54 55-64 65 +Self-<strong>Report</strong>ed (% total population) 43% 26% 39% 50% 57% 67%Male 41% 49% 47% 42% 40% 29%Female 59% 51% 53% 58% 60% 71%Diagnosed (% total population) 37% 20% 32% 43% 52% 63%Male 40% 48% 47% 41% 39% 29%Female 60% 52% 53% 59% 61% 71%Total urban adult population: 87,171,000Medication usageAge Group% of sufferers Total 18-34 35-44 45-54 55-64 65 +Prescription only* 33% 19% 27% 33% 36% 46%OTC only † 12% 16% 14% 13% 12% 5%Prescription <strong>and</strong> OTC 28% 14% 19% 31% 35% 38%No product 27% 51% 39% 23% 16% 11%*Medications that require prescriptions in other countries.†Vitamins, food supplements, <strong>and</strong> folk medicine.AttitudesJJJJ31% of sufferers would rather treat themselves than consult a doctor.51% of sufferers are willing to make any lifestyle changes necessary to avoid having to take a medication.Cardiovascular Conditionswww.<strong>Kantar</strong><strong>Health</strong>.com
National <strong>Health</strong> <strong>and</strong> <strong>Wellness</strong> Survey | Russia | Cardiovascular Conditions 218LifestyleAge Group% of sufferers Total 18-34 35-44 45-54 55-64 65 +Exercise* 52% 65% 52% 49% 50% 47%Smoke 31% 40% 47% 35% 25% 12%Drink alcohol 73% 84% 84% 79% 71% 49%Obese (BMI ≥ 30) 28% 12% 24% 34% 35% 34%*At least one day per month of vigorous exercise lasting 20 minutes or more.Quality of life6050403047.943.351.248.9 47.7 46.843.645.5 45.2 46.239.4 41.120100Total Population Age 18-34 Age 35-44 Age 45-54 Age 55-64 Age 65 +Physical summary scoreMental summary scoreWork productivity <strong>and</strong> activity impairmentAge GroupTotal 18-34 35-44 45-54 55-64 65 +Work Productivity Loss: % overallwork impairment due to health(Base: Employed Full-time)25.0 26.8 26.0 24.1 20.5 28.9Activity Impairment: % activity impairmentdue to health31.2 31.9 29.6 30.0 30.6 33.3Sufferers are self-reported.Cardiovascular Conditionswww.<strong>Kantar</strong><strong>Health</strong>.com
National <strong>Health</strong> <strong>and</strong> <strong>Wellness</strong> Survey | Russia | Gastrointestinal Conditions 219Gastrointestinal ConditionsGastrointestinal conditions include the adult population suffering from Chronic Constipation, Diarrhea, Diverticulitis,Gastroesophageal Reflux Disease (GERD), Heartburn <strong>and</strong> Irritable Bowel Syndrome (IBS).% of adult population with Gastrointestinal conditions in RussiaAge GroupTotal 18-34 35-44 45-54 55-64 65 +Self-<strong>Report</strong>ed (% total population) 37% 41% 44% 39% 31% 26%Male 44% 46% 49% 46% 37% 30%Female 56% 54% 51% 54% 63% 70%Diagnosed (% total population) 12% 12% 13% 11% 11% 12%Male 39% 46% 40% 43% 30% 22%Female 61% 54% 60% 57% 70% 78%Total urban adult population: 87,171,000Medication usageAge Group% of sufferers Total 18-34 35-44 45-54 55-64 65 +Prescription only* 26% 24% 28% 25% 22% 34%OTC only † 24% 26% 24% 26% 25% 16%Prescription <strong>and</strong> OTC 24% 17% 23% 28% 32% 33%No product 26% 33% 25% 20% 21% 18%*Medications that require prescriptions in other countries.†Vitamins, food supplements, <strong>and</strong> folk medicine.AttitudesJJJJ32% of sufferers would rather treat themselves than consult a doctor.49% of sufferers are willing to make any lifestyle changes necessary to avoid having to take a medication.Gastrointestinal Conditionswww.<strong>Kantar</strong><strong>Health</strong>.com
National <strong>Health</strong> <strong>and</strong> <strong>Wellness</strong> Survey | Russia | Gastrointestinal Conditions 220LifestyleAge Group% of sufferers Total 18-34 35-44 45-54 55-64 65 +Exercise* 54% 61% 52% 50% 52% 44%Smoke 37% 39% 45% 41% 26% 13%Drink alcohol 79% 85% 82% 79% 72% 59%Obese (BMI ≥ 30) 22% 11% 20% 30% 34% 36%*At least one day per month of vigorous exercise lasting 20 minutes or more.Quality of life60504049.752.449.9 48.2 48.142.8 41.6 41.7 43.145.9 44.3 45.13020100Total Population Age 18-34 Age 35-44 Age 45-54 Age 55-64 Age 65 +Physical summary scoreMental summary scoreWork productivity <strong>and</strong> activity impairmentAge GroupTotal 18-34 35-44 45-54 55-64 65 +Work Productivity Loss: % overallwork impairment due to health(Base: Employed Full-time)24.1 24.0 24.7 25.0 17.8 33.3Activity Impairment: % activity impairmentdue to health28.9 26.7 28.8 30.6 28.5 33.8Sufferers are self-reported.Gastrointestinal Conditionswww.<strong>Kantar</strong><strong>Health</strong>.com
National <strong>Health</strong> <strong>and</strong> <strong>Wellness</strong> Survey | Russia | Infectious Diseases 221Infectious DiseasesInfectious Diseases include the adult population suffering from AIDS, C. Difficile, Community-Acquired Pneumonia(CAP), Genital Herpes, Genital Warts, Hospital-Acquired Pneumonia (HAP), Hepatitis A, Hepatitis B, Hepatitis C,HIV <strong>and</strong> Tuberculosis.% of adult population with Infectious Diseases in RussiaAge GroupTotal 18-34 35-44 45-54 55-64 65 +Self-<strong>Report</strong>ed (% total population) 17% 16% 22% 21% 14% 9%Male 43% 39% 47% 47% 42% 35%Female 57% 61% 53% 53% 58% 65%Diagnosed (% total population) 12% 10% 16% 15% 10% 6%Male 47% 42% 49% 53% 46% 40%Female 53% 58% 51% 47% 54% 60%Total urban adult population: 87,171,000Medication usageAge Group% of sufferers Total 18-34 35-44 45-54 55-64 65 +Using prescription 18% 22% 22% 14% 10% 19%Not using prescription 82% 78% 78% 86% 90% 81%Vitamins, food supplements, <strong>and</strong> folk medicine were not captured for Infectious Diseases.AttitudesJJJJ29% of sufferers would rather treat themselves than consult a doctor.49% of sufferers are willing to make any lifestyle changes necessary to avoid having to take a medication.Infectious Diseaseswww.<strong>Kantar</strong><strong>Health</strong>.com
National <strong>Health</strong> <strong>and</strong> <strong>Wellness</strong> Survey | Russia | Infectious Diseases 222LifestyleAge Group% of sufferers Total 18-34 35-44 45-54 55-64 65 +Exercise* 53% 60% 51% 50% 51% 47%Smoke 38% 41% 45% 38% 29% 24%Drink alcohol 80% 88% 85% 82% 64% 55%Obese (BMI ≥ 30) 22% 9% 16% 33% 26% 46%*At least one day per month of vigorous exercise lasting 20 minutes or more.Quality of life6050403049.142.451.639.849.7 48.0 47.141.7 43.545.6 46.443.820100Total Population Age 18-34 Age 35-44 Age 45-54 Age 55-64 Age 65 +Physical summary scoreMental summary scoreWork productivity <strong>and</strong> activity impairmentAge GroupTotal 18-34 35-44 45-54 55-64 65 +Work Productivity Loss: % overallwork impairment due to health(Base: Employed Full-time)23.9 25.5 24.8 22.6 16.3 30.4Activity Impairment: % activity impairmentdue to health29.7 30.3 29.2 28.6 29.3 32.2Sufferers are self-reported.Infectious Diseaseswww.<strong>Kantar</strong><strong>Health</strong>.com
National <strong>Health</strong> <strong>and</strong> <strong>Wellness</strong> Survey | Russia | Metabolic Conditions 223Metabolic ConditionsMetabolic conditions include the adult population suffering from High Cholesterol, Hypertension, Obesity, ThyroidCondition, Type 1 Diabetes <strong>and</strong> Type 2 Diabetes.% of adult population with Metabolic conditions in RussiaAge GroupTotal 18-34 35-44 45-54 55-64 65 +Self-<strong>Report</strong>ed (% total population) 43% 24% 40% 52% 59% 63%Male 38% 43% 48% 39% 35% 26%Female 62% 57% 52% 61% 65% 74%Diagnosed (% total population) 31% 16% 27% 37% 45% 53%Male 36% 42% 44% 37% 33% 27%Female 64% 58% 56% 63% 67% 73%Total urban adult population: 87,171,000Medication usageAge Group% of sufferers Total 18-34 35-44 45-54 55-64 65 +Prescription only* 31% 24% 29% 30% 31% 42%OTC only † 10% 13% 9% 10% 11% 6%Prescription <strong>and</strong> OTC 22% 10% 15% 23% 27% 31%No product 37% 53% 47% 38% 30% 20%*Medications that require prescriptions in other countries.†Vitamins, food supplements, <strong>and</strong> folk medicine.AttitudesJJJJ30% of sufferers would rather treat themselves than consult a doctor.51% of sufferers are willing to make any lifestyle changes necessary to avoid having to take a medication.Metabolic Conditionswww.<strong>Kantar</strong><strong>Health</strong>.com
National <strong>Health</strong> <strong>and</strong> <strong>Wellness</strong> Survey | Russia | Metabolic Conditions 224LifestyleAge Group% of sufferers Total 18-34 35-44 45-54 55-64 65 +Exercise* 51% 60% 49% 47% 51% 47%Smoke 29% 40% 43% 34% 24% 10%Drink alcohol 72% 83% 85% 79% 70% 48%Obese (BMI ≥ 30) 44% 31% 43% 51% 47% 46%*At least one day per month of vigorous exercise lasting 20 minutes or more.Quality of life6050403048.344.151.849.5 48.1 47.445.340.7 42.444.5 46.1 46.420100Total Population Age 18-34 Age 35-44 Age 45-54 Age 55-64 Age 65 +Physical summary scoreMental summary scoreWork productivity <strong>and</strong> activity impairmentAge GroupTotal 18-34 35-44 45-54 55-64 65 +Work Productivity Loss: % overallwork impairment due to health(Base: Employed Full-time)23.1 24.6 24.6 22.3 19.0 25.8Activity Impairment: % activity impairmentdue to health29.4 28.1 27.2 28.4 29.4 33.0Sufferers are self-reported.Metabolic Conditionswww.<strong>Kantar</strong><strong>Health</strong>.com
National <strong>Health</strong> <strong>and</strong> <strong>Wellness</strong> Survey | Russia | Musculoskeletal Conditions 225Musculoskeletal ConditionsMusculoskeletal conditions include the adult population suffering from Gout, Muscular Dystrophy, Osteoarthritis,Osteopenia, Osteoporosis <strong>and</strong> Paget’s Disease.% of adult population with Musculoskeletal conditions in RussiaAge GroupTotal 18-34 35-44 45-54 55-64 65 +Self-<strong>Report</strong>ed (% total population) 15% 5% 10% 17% 24% 31%Male 34% 63% 54% 36% 27% 18%Female 66% 37% 46% 64% 73% 82%Diagnosed (% total population) 13% 4% 8% 15% 21% 27%Male 33% 60% 56% 36% 27% 18%Female 67% 40% 44% 64% 73% 82%Total urban adult population: 87,171,000Medication usageAge Group% of sufferers Total 18-34 35-44 45-54 55-64 65 +Prescription only* 26% 33% 29% 27% 18% 28%OTC only † 24% 24% 29% 23% 28% 21%Prescription <strong>and</strong> OTC 32% 22% 25% 32% 38% 35%No product 17% 21% 18% 17% 15% 16%*Medications that require prescriptions in other countries.†Vitamins, food supplements, <strong>and</strong> folk medicine.AttitudesJJJJ32% of sufferers would rather treat themselves than consult a doctor.53% of sufferers are willing to make any lifestyle changes necessary to avoid having to take a medication.Musculoskeletal Conditionswww.<strong>Kantar</strong><strong>Health</strong>.com
National <strong>Health</strong> <strong>and</strong> <strong>Wellness</strong> Survey | Russia | Musculoskeletal Conditions 226LifestyleAge Group% of sufferers Total 18-34 35-44 45-54 55-64 65 +Exercise* 54% 68% 57% 51% 54% 49%Smoke 30% 52% 51% 39% 24% 12%Drink alcohol 67% 88% 85% 77% 69% 45%Obese (BMI ≥ 30) 29% 11% 26% 32% 32% 34%*At least one day per month of vigorous exercise lasting 20 minutes or more.Quality of life6050403045.643.548.0 46.2 44.9 46.1 45.9 44.5 45.742.639.3 39.720100Total Population Age 18-34 Age 35-44 Age 45-54 Age 55-64 Age 65 +Physical summary scoreMental summary scoreWork productivity <strong>and</strong> activity impairmentAge GroupTotal 18-34 35-44 45-54 55-64 65 +Work Productivity Loss: % overallwork impairment due to health(Base: Employed Full-time)29.7 37.2 29.1 30.7 20.2 30.6Activity Impairment: % activity impairmentdue to health36.0 38.9 37.0 39.6 32.7 34.1Sufferers are self-reported.Musculoskeletal Conditionswww.<strong>Kantar</strong><strong>Health</strong>.com
National <strong>Health</strong> <strong>and</strong> <strong>Wellness</strong> Survey | Russia | Neurological Conditions 227Neurological ConditionsNeurological conditions include the adult population suffering from Epilepsy, Hemiplegia, Migraine, MultipleSclerosis, Parkinson’s Disease <strong>and</strong> Restless Legs Syndrome (RLS).% of adult population with Neurological conditions in RussiaAge GroupTotal 18-34 35-44 45-54 55-64 65 +Self-<strong>Report</strong>ed (% total population) 17% 16% 21% 18% 16% 13%Male 29% 35% 33% 24% 23% 23%Female 71% 65% 67% 76% 77% 77%Diagnosed (% total population) 6% 5% 7% 6% 6% 5%Male 27% 41% 29% 16% 19% 20%Female 73% 59% 71% 84% 81% 80%Total urban adult population: 87,171,000Medication usageAge Group% of sufferers Total 18-34 35-44 45-54 55-64 65 +Prescription only* 30% 26% 34% 29% 27% 37%OTC only † 16% 16% 15% 17% 18% 13%Prescription <strong>and</strong> OTC 12% 11% 8% 16% 14% 16%No product 42% 47% 43% 39% 41% 34%*Medications that require prescriptions in other countries.†Vitamins, food supplements, <strong>and</strong> folk medicine.AttitudesJJJJ32% of sufferers would rather treat themselves than consult a doctor.48% of sufferers are willing to make any lifestyle changes necessary to avoid having to take a medication.Neurological Conditionswww.<strong>Kantar</strong><strong>Health</strong>.com
National <strong>Health</strong> <strong>and</strong> <strong>Wellness</strong> Survey | Russia | Neurological Conditions 228LifestyleAge Group% of sufferers Total 18-34 35-44 45-54 55-64 65 +Exercise* 56% 62% 54% 58% 53% 40%Smoke 35% 38% 43% 33% 32% 19%Drink alcohol 77% 86% 81% 76% 69% 55%Obese (BMI ≥ 30) 22% 8% 18% 29% 34% 38%*At least one day per month of vigorous exercise lasting 20 minutes or more.Quality of life6050403048.051.748.540.7 38.9 39.446.4 45.441.543.5 42.8 43.520100Total Population Age 18-34 Age 35-44 Age 45-54 Age 55-64 Age 65 +Physical summary scoreMental summary scoreWork productivity <strong>and</strong> activity impairmentAge GroupTotal 18-34 35-44 45-54 55-64 65 +Work Productivity Loss: % overallwork impairment due to health(Base: Employed Full-time)29.0 31.3 26.9 29.7 22.9 36.9Activity Impairment: % activity impairmentdue to health33.7 31.9 31.6 35.2 38.4 35.1Sufferers are self-reported.Neurological Conditionswww.<strong>Kantar</strong><strong>Health</strong>.com
National <strong>Health</strong> <strong>and</strong> <strong>Wellness</strong> Survey | Russia | Ophthalmic Conditions 229Ophthalmic ConditionsOphthalmic conditions include the adult population suffering from Dry Eye, Glaucoma <strong>and</strong> Macular Degeneration.% of adult population with Ophthalmic conditions in RussiaAge GroupTotal 18-34 35-44 45-54 55-64 65 +Self-<strong>Report</strong>ed (% total population) 11% 11% 11% 10% 10% 12%Male 35% 41% 35% 36% 35% 23%Female 65% 59% 65% 64% 65% 77%Diagnosed (% total population) 5% 4% 4% 4% 6% 10%Male 34% 43% 30% 35% 37% 24%Female 66% 57% 70% 65% 63% 76%Total urban adult population: 87,171,000Medication usageAge Group% of sufferers Total 18-34 35-44 45-54 55-64 65 +Prescription only* 34% 29% 31% 28% 30% 56%OTC only † 18% 20% 21% 18% 20% 8%Prescription <strong>and</strong> OTC 20% 18% 19% 24% 26% 15%No product 28% 33% 29% 30% 23% 20%*Medications that require prescriptions in other countries.†Vitamins, food supplements, <strong>and</strong> folk medicine.AttitudesJJJJ32% of sufferers would rather treat themselves than consult a doctor.52% of sufferers are willing to make any lifestyle changes necessary to avoid having to take a medication.Ophthalmic Conditionswww.<strong>Kantar</strong><strong>Health</strong>.com
National <strong>Health</strong> <strong>and</strong> <strong>Wellness</strong> Survey | Russia | Ophthalmic Conditions 230LifestyleAge Group% of sufferers Total 18-34 35-44 45-54 55-64 65 +Exercise* 61% 73% 57% 59% 57% 48%Smoke 29% 30% 40% 39% 21% 11%Drink alcohol 75% 80% 82% 84% 77% 49%Obese (BMI ≥ 30) 16% 8% 16% 18% 21% 29%*At least one day per month of vigorous exercise lasting 20 minutes or more.Quality of life6050403048.941.352.738.949.347.3 47.441.0 40.944.9 43.7 44.020100Total Population Age 18-34 Age 35-44 Age 45-54 Age 55-64 Age 65 +Physical summary scoreMental summary scoreWork productivity <strong>and</strong> activity impairmentAge GroupTotal 18-34 35-44 45-54 55-64 65 +Work Productivity Loss: % overallwork impairment due to health(Base: Employed Full-time)27.0 25.3 25.2 30.5 26.6 37.7Activity Impairment: % activity impairmentdue to health32.9 29.3 31.1 38.3 32.5 36.9Sufferers are self-reported.Ophthalmic Conditionswww.<strong>Kantar</strong><strong>Health</strong>.com
National <strong>Health</strong> <strong>and</strong> <strong>Wellness</strong> Survey | Russia | Pain Conditions 231Pain ConditionsPain conditions include the adult population suffering from Back Problems, Broken Bones, Cancer, Dental Pain,Fibromyalgia, Headache, Herpes Zoster/Shingles, Joint Pain, Menstrual Cycle, Migraine, Neck Pain, NeuropathicPain, Phantom Limb Pain, Post-Herpetic Neuralgia, Shoulder Pain or Stiffness, Sprains or Strains, Surgery or OtherMedical Procedure <strong>and</strong> Other Pain.% of adult population with Pain conditions in RussiaAge GroupTotal 18-34 35-44 45-54 55-64 65 +Self-<strong>Report</strong>ed (% total population) 27% 29% 32% 28% 20% 23%Male 38% 37% 42% 42% 35% 28%Female 62% 63% 58% 58% 65% 72%Diagnosed (% total population) 12% 11% 14% 14% 10% 13%Male 36% 39% 37% 39% 37% 27%Female 64% 61% 63% 61% 63% 73%Total urban adult population: 87,171,000Medication usageAge Group% of sufferers Total 18-34 35-44 45-54 55-64 65 +Prescription only* 37% 30% 40% 38% 38% 44%OTC only † 13% 17% 11% 13% 14% 9%Prescription <strong>and</strong> OTC 15% 11% 13% 18% 22% 16%No product 36% 42% 36% 31% 27% 31%*Medications that require prescriptions in other countries.†Vitamins, food supplements, <strong>and</strong> folk medicine.AttitudesJJ32% of sufferers would rather treat themselves with an over-the-counter medication than to depend on a doctorto give them a prescription medication.JJ48% of sufferers are willing to make any lifestyle changes necessary to avoid having to take a medication.Pain Conditionswww.<strong>Kantar</strong><strong>Health</strong>.com
National <strong>Health</strong> <strong>and</strong> <strong>Wellness</strong> Survey | Russia | Pain Conditions 232LifestyleAge Group% of sufferers Total 18-34 35-44 45-54 55-64 65 +Exercise* 56% 64% 50% 54% 56% 44%Smoke 36% 36% 46% 41% 31% 15%Drink alcohol 77% 84% 84% 78% 71% 51%Obese (BMI ≥ 30) 19% 9% 17% 24% 29% 36%*At least one day per month of vigorous exercise lasting 20 minutes or more.Quality of life6050403047.441.550.847.845.7 44.2 42.439.6 40.4 41.944.2 45.620100Total Population Age 18-34 Age 35-44 Age 45-54 Age 55-64 Age 65 +Physical summary scoreMental summary scoreWork productivity <strong>and</strong> activity impairmentAge GroupTotal 18-34 35-44 45-54 55-64 65 +Work Productivity Loss: % overallwork impairment due to health(Base: Employed Full-time)28.3 27.8 28.3 29.2 25.9 35.9Activity Impairment: % activity impairmentdue to health34.1 32.3 32.7 36.0 35.5 37.4Sufferers are self-reported.Pain Conditionswww.<strong>Kantar</strong><strong>Health</strong>.com
National <strong>Health</strong> <strong>and</strong> <strong>Wellness</strong> Survey | Russia | Psychiatric Conditions 233Psychiatric ConditionsPsychiatric conditions include the adult population suffering from Anxiety, Attention Deficit/Hyperactivity Disorder(ADHD), Bipolar Disorder, Depression, Generalized Anxiety Disorder (GAD), Obsessive Compulsive Disorder(OCD), Phobias, Post Traumatic Stress Disorder (PTSD), Schizophrenia <strong>and</strong> Social Anxiety Disorder (SAD).% of adult population with Psychiatric conditions in RussiaAge GroupTotal 18-34 35-44 45-54 55-64 65 +Self-<strong>Report</strong>ed (% total population) 28% 37% 33% 27% 19% 14%Male 37% 41% 42% 36% 32% 16%Female 63% 59% 58% 64% 68% 84%Diagnosed (% total population) 5% 6% 6% 5% 4% 4%Male 41% 51% 50% 32% 36% 11%Female 59% 49% 50% 68% 64% 89%Total urban adult population: 87,171,000Medication usageAge Group% of sufferers Total 18-34 35-44 45-54 55-64 65 +Prescription only* 9% 8% 8% 9% 7% 15%OTC only † 42% 40% 44% 47% 46% 36%Prescription <strong>and</strong> OTC 16% 15% 15% 20% 19% 15%No product 33% 37% 33% 25% 28% 34%*Medications that require prescriptions in other countries.†Vitamins, food supplements, <strong>and</strong> folk medicine.AttitudesJJJJ34% of sufferers would rather treat themselves than consult a doctor.49% of sufferers are willing to make any lifestyle changes necessary to avoid having to take a medication.Psychiatric Conditionswww.<strong>Kantar</strong><strong>Health</strong>.com
National <strong>Health</strong> <strong>and</strong> <strong>Wellness</strong> Survey | Russia | Psychiatric Conditions 234LifestyleAge Group% of sufferers Total 18-34 35-44 45-54 55-64 65 +Exercise* 56% 64% 51% 52% 48% 45%Smoke 38% 38% 50% 43% 29% 9%Drink alcohol 80% 85% 83% 79% 69% 57%Obese (BMI ≥ 30) 15% 7% 17% 24% 26% 26%*At least one day per month of vigorous exercise lasting 20 minutes or more.Quality of life60504030201050.352.749.8 48.8 47.244.237.6 37.4 37.6 37.1 38.3 39.40Total Population Age 18-34 Age 35-44 Age 45-54 Age 55-64 Age 65 +Physical summary scoreMental summary scoreWork productivity <strong>and</strong> activity impairmentAge GroupTotal 18-34 35-44 45-54 55-64 65 +Work Productivity Loss: % overallwork impairment due to health(Base: Employed Full-time)28.5 27.5 29.0 28.6 29.9 46.9Activity Impairment: % activity impairmentdue to health33.0 31.2 31.6 34.5 34.9 41.5Sufferers are self-reported.Psychiatric Conditionswww.<strong>Kantar</strong><strong>Health</strong>.com
National <strong>Health</strong> <strong>and</strong> <strong>Wellness</strong> Survey | Russia | Respiratory Conditions 235Respiratory ConditionsRespiratory conditions include the adult population suffering from Asthma, Chronic Bronchitis, Chronic ObstructivePulmonary Disease (COPD), Cystic Fibrosis, Emphysema, Hay Fever <strong>and</strong> Nasal Allergies.% of adult population with Respiratory conditions in RussiaAge GroupTotal 18-34 35-44 45-54 55-64 65 +Self-<strong>Report</strong>ed (% total population) 23% 24% 27% 25% 22% 19%Male 38% 44% 37% 36% 35% 25%Female 62% 56% 63% 64% 65% 75%Diagnosed (% total population) 15% 14% 17% 16% 13% 14%Male 34% 44% 36% 29% 28% 21%Female 66% 56% 64% 71% 72% 79%Total urban adult population: 87,171,000Medication usageAge Group% of sufferers Total 18-34 35-44 45-54 55-64 65 +Prescription only* 20% 20% 19% 18% 16% 31%OTC only † 24% 25% 27% 26% 19% 16%Prescription <strong>and</strong> OTC 26% 25% 25% 27% 35% 22%No product 30% 31% 29% 29% 29% 30%*Medications that require prescriptions in other countries.†Vitamins, food supplements, <strong>and</strong> folk medicine.AttitudesJJJJ32% of sufferers would rather treat themselves than consult a doctor.49% of sufferers are willing to make any lifestyle changes necessary to avoid having to take a medication.Respiratory Conditionswww.<strong>Kantar</strong><strong>Health</strong>.com
National <strong>Health</strong> <strong>and</strong> <strong>Wellness</strong> Survey | Russia | Respiratory Conditions 236LifestyleAge Group% of sufferers Total 18-34 35-44 45-54 55-64 65 +Exercise* 56% 66% 52% 50% 54% 50%Smoke 35% 38% 40% 41% 29% 17%Drink alcohol 78% 85% 83% 81% 73% 53%Obese (BMI ≥ 30) 21% 9% 18% 29% 30% 36%*At least one day per month of vigorous exercise lasting 20 minutes or more.Quality of life6050403049.252.449.4 47.8 47.241.9 40.5 41.2 41.644.6 44.2 44.620100Total Population Age 18-34 Age 35-44 Age 45-54 Age 55-64 Age 65 +Physical summary scoreMental summary scoreWork productivity <strong>and</strong> activity impairmentAge GroupTotal 18-34 35-44 45-54 55-64 65 +Work Productivity Loss: % overallwork impairment due to health(Base: Employed Full-time)25.5 24.6 28.2 25.5 21.6 24.0Activity Impairment: % activity impairmentdue to health31.1 28.5 30.8 33.0 31.0 35.4Sufferers are self-reported.Respiratory Conditionswww.<strong>Kantar</strong><strong>Health</strong>.com
National <strong>Health</strong> <strong>and</strong> <strong>Wellness</strong> Survey | Russia | Urologic Conditions 237Urologic ConditionsUrologic conditions include the adult population suffering from Benign Prostatic Hyperplasia (BPH), ErectileDysfunction, Overactive Bladder (OAB), Premature Ejaculation <strong>and</strong> Stress Urinary Incontinence (SUI).% of adult population with Urologic conditions in RussiaAge GroupTotal 18-34 35-44 45-54 55-64 65 +Self-<strong>Report</strong>ed (% total population) 23% 17% 23% 27% 29% 27%Male 66% 83% 67% 61% 62% 51%Female 34% 17% 33% 39% 38% 49%Diagnosed (% total population) 4% 2% 3% 4% 5% 11%Male 52% 50% 42% 41% 63% 57%Female 48% 50% 58% 59% 37% 43%Total urban adult population: 87,171,000Medication usageAge Group% of sufferers Total 18-34 35-44 45-54 55-64 65 +Prescription only* 6% 3% 4% 3% 5% 14%OTC only † 15% 10% 11% 17% 19% 18%Prescription <strong>and</strong> OTC 4% 3% 4% 5% 5% 6%No product 76% 84% 81% 76% 70% 62%*Medications that require prescriptions in other countries.†Vitamins, food supplements, <strong>and</strong> folk medicine.AttitudesJJJJ32% of sufferers would rather treat themselves than consult a doctor.50% of sufferers are willing to make any lifestyle changes necessary to avoid having to take a medication.Urologic Conditionswww.<strong>Kantar</strong><strong>Health</strong>.com
National <strong>Health</strong> <strong>and</strong> <strong>Wellness</strong> Survey | Russia | Urologic Conditions 238LifestyleAge Group% of sufferers Total 18-34 35-44 45-54 55-64 65 +Exercise* 51% 63% 48% 48% 47% 46%Smoke 39% 44% 52% 43% 32% 20%Drink alcohol 80% 87% 88% 81% 76% 63%Obese (BMI ≥ 30) 24% 9% 20% 31% 32% 33%*At least one day per month of vigorous exercise lasting 20 minutes or more.Quality of life60504048.551.849.5 48.2 47.143.7 42.3 41.7 43.4 44.944.547.33020100Total Population Age 18-34 Age 35-44 Age 45-54 Age 55-64 Age 65 +Physical summary scoreMental summary scoreWork productivity <strong>and</strong> activity impairmentAge GroupTotal 18-34 35-44 45-54 55-64 65 +Work Productivity Loss: % overallwork impairment due to health(Base: Employed Full-time)24.2 26.1 25.8 22.4 18.2 30.8Activity Impairment: % activity impairmentdue to health29.0 26.2 28.8 29.4 30.3 31.6Sufferers are self-reported.Urologic Conditionswww.<strong>Kantar</strong><strong>Health</strong>.com
Spainwww.<strong>Kantar</strong><strong>Health</strong>.com
National <strong>Health</strong> <strong>and</strong> <strong>Wellness</strong> Survey | Spain 240Population profileJJOver three-quarters of Spain’s population is urban.JJThere is an increasing proportion of elderly peoplein the population. Adults aged 60+ years currentlyaccount for nearly 18% of the Spanish population.JJSmoking has increased dramatically, with 30% ofthe adult population using tobacco.JJIn Spain 54% of the adult population is overweight,<strong>and</strong> 15% are obese.Life expectancy <strong>and</strong> causes of deathJJThe top three causes of death in Spain since 1970have been cardiovascular diseases, cancer <strong>and</strong>respiratory diseases, although there has been asteady decrease in the actual mortality rates fromthese causes. Still, mortality rates for these causesare among the lowest in the WHO EuropeanRegion.JJAverage life expectancy for the Spanish populationis 73, which is higher than both the regional <strong>and</strong>global averages.<strong>Health</strong>care systemJJUnder constitutional provisions <strong>and</strong> their respectiveautonomy statutes, all the autonomous communitieshave taken up responsibilities with respect tohealthcare.JJEach autonomous community has its own healthservice, which is responsible for the managementof all the health centers, services <strong>and</strong> facilities in itsregion, provincial administrations, town councils <strong>and</strong>other intra-regional administrations.JJCentral government retains healthcare managementin the cities with autonomy statutes – Ceuta <strong>and</strong>Melilla – through the National <strong>Health</strong> ManagementInstitute (INGESA).JJEveryone is entitled to free healthcare.JJThe system provides for primary care based onhealth centers for preventive <strong>and</strong> curative care.Reimbursement policiesJJProvision of healthcare is free of charge at the pointof delivery with the exception of the pharmaceuticalsprescribed to people aged under 65, which entaila 40% co-payment with some exceptions. Mosttreatments for chronic conditions are funded at 90%with a limit of €4,13 per prescription (insulin, oralantidiabetics, antidepressants, etc.).JJPatients have to pay 100% for drugs not included onthe list.Spainwww.<strong>Kantar</strong><strong>Health</strong>.com
National <strong>Health</strong> <strong>and</strong> <strong>Wellness</strong> Survey | Spain 241General statisticsJJGross national income per capita (Intl $ 1 , 2012): 31,670JJLife expectancy at birth male/female (years): 79/85JJTotal expenditure on health per capita (Intl $, 2012): 3,145JJTotal expenditure on health as % of GDP (2012): 9.6%JJInternet penetration: Total population: 71.6%Lifestyle statistics 3JJTotal % of adult population that:27.4%14.7%64.9% 74.4%Smokes Exercises 2 Drinks Alcohol Is Obese (BMI ≥ 30)DemographicsJJTotal population: 46,755,000JJArea size: 505,370 km 2JJDoctors (per 10,000 population): 37.0JJHospital beds (per 10,000 population): 31Rank City % Population1 Madrid 7.6%522 Barcelona 3.9%13 Valencia 1.9%34 Seville 1.7%5 Zaragoza 1.6%41The international $ is a currency unit that is calculated using purchasing power parities (PPP), which are rates ofcurrency conversion constructed to account for differences in price level between countries.2At least one day per month of vigorous exercise lasting 20 minutes or more.3Adult population: 38,554,000Spainwww.<strong>Kantar</strong><strong>Health</strong>.com
National <strong>Health</strong> <strong>and</strong> <strong>Wellness</strong> Survey | Spain | Autoimmune Conditions 242Autoimmune ConditionsAutoimmune conditions include the adult population suffering from Ankylosing Spondylitis, Connective TissueDisease, Idiopathic Thrombocytopenia Purpura (ITP), Inflammatory Bowel Disease (Crohn’s Disease or UlcerativeColitis), Lupus, Psoriasis, Psoriatic Arthritis, Rheumatoid Arthritis <strong>and</strong> Sjögren’s Syndrome.% of adult population with Autoimmune conditions in SpainAge GroupTotal 18-34 35-44 45-54 55-64 65 +Self-<strong>Report</strong>ed (% total population) 8% 5% 8% 10% 10% 8%Male 47% 48% 54% 40% 55% 43%Female 53% 52% 46% 60% 45% 57%Diagnosed (% total population) 8% 5% 7% 9% 10% 8%Male 46% 46% 52% 40% 55% 42%Female 54% 54% 48% 60% 45% 58%Total adult population: 38,554,000Medication usageAge Group% of sufferers Total 18-34 35-44 45-54 55-64 65 +Prescription only 43% 33% 38% 44% 45% 52%OTC only* 11% 13% 9% 10% 6% 15%Prescription <strong>and</strong> OTC 9% 13% 9% 11% 10% 5%No product 37% 42% 44% 35% 40% 28%*Including over-the-counter <strong>and</strong> herbal products.AttitudesJJ8% of sufferers prefer to treat themselves with an over-the-counter medication than to depend on a doctor togive them a prescription medication.JJ51% of sufferers are willing to make any lifestyle changes necessary to avoid having to take a prescriptionmedication.Autoimmune Conditionswww.<strong>Kantar</strong><strong>Health</strong>.com
National <strong>Health</strong> <strong>and</strong> <strong>Wellness</strong> Survey | Spain | Autoimmune Conditions 243LifestyleAge Group% of sufferers Total 18-34 35-44 45-54 55-64 65 +Exercise* 61% 73% 57% 58% 61% 60%Smoke 33% 34% 36% 45% 33% 16%Drink alcohol 71% 79% 73% 75% 64% 64%Obese (BMI ≥ 30) 21% 15% 19% 23% 28% 22%*At least one day per month of vigorous exercise lasting 20 minutes or more.Quality of life60504046.349.847.443.845.9 45.642.7 42.7 42.8 43.643.647.13020100Total Population Age 18-34 Age 35-44 Age 45-54 Age 55-64 Age 65 +Physical summary scoreMental summary scoreWork productivity <strong>and</strong> activity impairmentAge GroupTotal 18-34 35-44 45-54 55-64 65 +Work Productivity Loss: % overallwork impairment due to health(Base: Employed Full-time)25.4 29.0 27.2 25.7 15.3 18.2Activity Impairment: % activity impairmentdue to health36.4 30.9 35.6 37.6 36.6 39.7Sufferers are self-reported.Autoimmune Conditionswww.<strong>Kantar</strong><strong>Health</strong>.com
National <strong>Health</strong> <strong>and</strong> <strong>Wellness</strong> Survey | Spain | Cancer Conditions 244Cancer ConditionsCancer conditions include the adult population suffering from Breast Cancer, Cervical Cancer, Colorectal Cancer,Leukemia, Lymphoma, Metastatic Solid Tumor, Non-Small Cell Lung Cancer, Prostate Cancer, Small-Cell LungCancer, Uterine Cancer <strong>and</strong> Other Cancer.% of adult population with Cancer conditions in SpainAge GroupTotal 18-34 35-44 45-54 55-64 65 +Self-<strong>Report</strong>ed (% total population) 4% 1% 1% 4% 7% 10%Male 38% 59% 35% 28% 48% 36%Female 62% 41% 65% 72% 52% 64%Diagnosed (% total population) 4% 1% 1% 3% 7% 10%Male 38% 56% 35% 28% 49% 36%Female 62% 44% 65% 72% 51% 64%Total adult population: 38,554,000Medication usageAge Group% of sufferers Total 18-34 35-44 45-54 55-64 65 +Using prescription 27% 29% 21% 21% 24% 32%Not using prescription 73% 71% 79% 79% 76% 68%Over-the-counter usage was not captured for Cancer.AttitudesJJ6% of sufferers prefer to treat themselves with an over-the-counter medication than to depend on a doctor togive them a prescription medication.JJ48% of sufferers are willing to make any lifestyle changes necessary to avoid having to take a prescriptionmedication.Cancer Conditionswww.<strong>Kantar</strong><strong>Health</strong>.com
National <strong>Health</strong> <strong>and</strong> <strong>Wellness</strong> Survey | Spain | Cancer Conditions 245LifestyleAge Group% of sufferers Total 18-34 35-44 45-54 55-64 65 +Exercise* 56% 87% 37% 58% 54% 54%Smoke 25% 44% 27% 44% 42% 10%Drink alcohol 74% 76% 76% 73% 87% 70%Obese (BMI ≥ 30) 16% 16% 17% 5% 22% 17%*At least one day per month of vigorous exercise lasting 20 minutes or more.Quality of life6050403045.8 46.6 45.143.140.2 41.847.044.344.7 46.3 46.448.920100Total Population Age 18-34 Age 35-44 Age 45-54 Age 55-64 Age 65 +Physical summary scoreMental summary scoreWork productivity <strong>and</strong> activity impairmentAge GroupTotal 18-34 35-44 45-54 55-64 65 +Work Productivity Loss: % overallwork impairment due to health(Base: Employed Full-time)25.9 67.5 21.9 19.3 9.1 20.0Activity Impairment: % activity impairmentdue to health33.7 51.4 40.3 31.0 38.3 29.5Sufferers are self-reported.Cancer Conditionswww.<strong>Kantar</strong><strong>Health</strong>.com
National <strong>Health</strong> <strong>and</strong> <strong>Wellness</strong> Survey | Spain | Cardiovascular Conditions 246Cardiovascular ConditionsCardiovascular conditions include the adult population suffering from Angina Pectoris, Arrhythmia, Atherosclerosis,Atrial Fibrillation, Congestive Heart Failure (CHF), Deep Vein Thrombosis (DVT), Heart Attack, Heart Murmur,High Cholesterol, Hypertension, Left Ventricular Hypertrophy (LVH), Peripheral Arterial Disease (PAD), PeripheralVascular Disease (PVD), Pulmonary Embolism, Stroke or Mini-Stroke/Transient Ischemia <strong>and</strong> Unstable Angina.% of adult population with Cardiovascular conditions in SpainAge GroupTotal 18-34 35-44 45-54 55-64 65 +Self-<strong>Report</strong>ed (% total population) 39% 25% 30% 41% 53% 57%Male 53% 52% 58% 54% 55% 49%Female 47% 48% 42% 46% 45% 51%Diagnosed (% total population) 37% 21% 28% 39% 53% 56%Male 53% 51% 59% 55% 56% 49%Female 47% 49% 41% 45% 44% 51%Total adult population: 38,554,000Medication usageAge Group% of sufferers Total 18-34 35-44 45-54 55-64 65 +Prescription only 48% 14% 25% 46% 64% 73%OTC only* 5% 8% 10% 5% 3% 2%Prescription <strong>and</strong> OTC 6% 7% 5% 5% 5% 7%No product 41% 71% 61% 44% 27% 17%*Including over-the-counter <strong>and</strong> herbal products.AttitudesJJ11% of sufferers prefer to treat themselves with an over-the-counter medication than to depend on a doctor togive them a prescription medication.JJ54% of sufferers are willing to make any lifestyle changes necessary to avoid having to take a prescriptionmedication.Cardiovascular Conditionswww.<strong>Kantar</strong><strong>Health</strong>.com
National <strong>Health</strong> <strong>and</strong> <strong>Wellness</strong> Survey | Spain | Cardiovascular Conditions 247LifestyleAge Group% of sufferers Total 18-34 35-44 45-54 55-64 65 +Exercise* 64% 76% 64% 61% 61% 62%Smoke 29% 29% 35% 36% 34% 16%Drink alcohol 75% 83% 79% 75% 78% 68%Obese (BMI ≥ 30) 21% 15% 18% 23% 26% 23%*At least one day per month of vigorous exercise lasting 20 minutes or more.Quality of life6050403048.945.951.1 50.848.7 48.2 47.242.2 43.8 45.0 46.349.420100Total Population Age 18-34 Age 35-44 Age 45-54 Age 55-64 Age 65 +Physical summary scoreMental summary scoreWork productivity <strong>and</strong> activity impairmentAge GroupTotal 18-34 35-44 45-54 55-64 65 +Work Productivity Loss: % overallwork impairment due to health(Base: Employed Full-time)20.6 28.4 21.3 18.8 15.9 12.1Activity Impairment: % activity impairmentdue to health27.5 26.6 25.9 27.8 28.5 28.3Sufferers are self-reported.Cardiovascular Conditionswww.<strong>Kantar</strong><strong>Health</strong>.com
National <strong>Health</strong> <strong>and</strong> <strong>Wellness</strong> Survey | Spain | Gastrointestinal Conditions 248Gastrointestinal ConditionsGastrointestinal conditions include the adult population suffering from Chronic Constipation, Diarrhea, Diverticulitis,Gastroesophageal Reflux Disease (GERD), Heartburn <strong>and</strong> Irritable Bowel Syndrome (IBS).% of adult population with Gastrointestinal conditions in SpainAge GroupTotal 18-34 35-44 45-54 55-64 65 +Self-<strong>Report</strong>ed (% total population) 34% 33% 34% 35% 35% 32%Male 44% 45% 49% 43% 46% 37%Female 56% 55% 51% 57% 54% 63%Diagnosed (% total population) 23% 19% 22% 26% 27% 26%Male 41% 44% 42% 41% 44% 36%Female 59% 56% 58% 59% 56% 64%Total adult population: 38,554,000Medication usageAge Group% of sufferers Total 18-34 35-44 45-54 55-64 65 +Prescription only 30% 20% 26% 33% 39% 38%OTC only* 21% 21% 21% 22% 19% 21%Prescription <strong>and</strong> OTC 8% 6% 7% 9% 7% 12%No product 41% 52% 46% 35% 35% 29%*Including over-the-counter <strong>and</strong> herbal products.AttitudesJJ13% of sufferers prefer to treat themselves with an over-the-counter medication than to depend on a doctor togive them a prescription medication.JJ54% of sufferers are willing to make any lifestyle changes necessary to avoid having to take a prescriptionmedication.Gastrointestinal Conditionswww.<strong>Kantar</strong><strong>Health</strong>.com
National <strong>Health</strong> <strong>and</strong> <strong>Wellness</strong> Survey | Spain | Gastrointestinal Conditions 249LifestyleAge Group% of sufferers Total 18-34 35-44 45-54 55-64 65 +Exercise* 63% 72% 63% 56% 59% 60%Smoke 30% 30% 32% 40% 34% 16%Drink alcohol 77% 81% 79% 78% 77% 69%Obese (BMI ≥ 30) 17% 12% 17% 20% 20% 19%*At least one day per month of vigorous exercise lasting 20 minutes or more.Quality of life60504049.151.7 50.648.6 47.244.5 46.143.1 43.5 44.1 44.548.13020100Total Population Age 18-34 Age 35-44 Age 45-54 Age 55-64 Age 65 +Physical summary scoreMental summary scoreWork productivity <strong>and</strong> activity impairmentAge GroupTotal 18-34 35-44 45-54 55-64 65 +Work Productivity Loss: % overallwork impairment due to health(Base: Employed Full-time)21.0 24.0 19.2 21.7 17.9 26.5Activity Impairment: % activity impairmentdue to health28.1 25.6 26.1 29.4 30.6 30.8Sufferers are self-reported.Gastrointestinal Conditionswww.<strong>Kantar</strong><strong>Health</strong>.com
National <strong>Health</strong> <strong>and</strong> <strong>Wellness</strong> Survey | Spain | Infectious Diseases 250Infectious DiseasesInfectious Diseases include the adult population suffering from AIDS, C. Difficile, Community-Acquired Pneumonia(CAP), Genital Herpes, Genital Warts, Hospital-Acquired Pneumonia (HAP), Hepatitis A, Hepatitis B, Hepatitis C,HIV, Tuberculosis <strong>and</strong> Yeast Infection.% of adult population with Infectious Diseases in SpainAge GroupTotal 18-34 35-44 45-54 55-64 65 +Self-<strong>Report</strong>ed (% total population) 8% 7% 8% 10% 9% 8%Male 50% 51% 55% 47% 57% 42%Female 50% 49% 45% 53% 43% 58%Diagnosed (% total population) 7% 5% 7% 10% 9% 8%Male 49% 48% 56% 49% 57% 40%Female 51% 52% 44% 51% 43% 60%Total adult population: 38,554,000Medication usageAge Group% of sufferers Total 18-34 35-44 45-54 55-64 65 +Using prescription 20% 28% 15% 18% 20% 20%Not using prescription 80% 72% 85% 82% 80% 80%Over-the-counter usage was not captured for Infectious Diseases.AttitudesJJ12% of sufferers prefer to treat themselves with an over-the-counter medication than to depend on a doctor togive them a prescription medication.JJ52% of sufferers are willing to make any lifestyle changes necessary to avoid having to take a prescriptionmedication.Infectious Diseaseswww.<strong>Kantar</strong><strong>Health</strong>.com
National <strong>Health</strong> <strong>and</strong> <strong>Wellness</strong> Survey | Spain | Infectious Diseases 251LifestyleAge Group% of sufferers Total 18-34 35-44 45-54 55-64 65 +Exercise* 66% 79% 71% 65% 56% 57%Smoke 38% 34% 43% 45% 49% 23%Drink alcohol 75% 82% 79% 77% 74% 64%Obese (BMI ≥ 30) 17% 11% 17% 15% 22% 25%*At least one day per month of vigorous exercise lasting 20 minutes or more.Quality of life6050403047.743.549.8 49.1 47.8 47.143.2 44.5 43.7 44.7 45.540.620100Total Population Age 18-34 Age 35-44 Age 45-54 Age 55-64 Age 65 +Physical summary scoreMental summary scoreWork productivity <strong>and</strong> activity impairmentAge GroupTotal 18-34 35-44 45-54 55-64 65 +Work Productivity Loss: % overallwork impairment due to health(Base: Employed Full-time)25.0 37.0 25.0 20.2 15.1 37.0Activity Impairment: % activity impairmentdue to health32.8 32.5 28.4 31.5 32.5 39.2Sufferers are self-reported.Infectious Diseaseswww.<strong>Kantar</strong><strong>Health</strong>.com
National <strong>Health</strong> <strong>and</strong> <strong>Wellness</strong> Survey | Spain | Metabolic Conditions 252Metabolic ConditionsMetabolic conditions include the adult population suffering from High Cholesterol, Hypertension, Obesity, ThyroidCondition, Type 1 Diabetes <strong>and</strong> Type 2 Diabetes.% of adult population with Metabolic conditions in SpainAge GroupTotal 18-34 35-44 45-54 55-64 65 +Self-<strong>Report</strong>ed (% total population) 43% 25% 36% 48% 58% 61%Male 51% 49% 53% 54% 55% 47%Female 49% 51% 47% 46% 45% 53%Diagnosed (% total population) 36% 16% 27% 39% 52% 56%Male 51% 47% 55% 53% 55% 46%Female 49% 53% 45% 47% 45% 54%Total adult population: 38,554,000Medication usageAge Group% of sufferers Total 18-34 35-44 45-54 55-64 65 +Prescription only 49% 17% 27% 46% 64% 72%OTC only* 4% 3% 7% 4% 3% 2%Prescription <strong>and</strong> OTC 5% 4% 2% 4% 6% 6%No product 43% 76% 63% 47% 28% 20%*Including over-the-counter <strong>and</strong> herbal products.AttitudesJJ10% of sufferers prefer to treat themselves with an over-the-counter medication than to depend on a doctor togive them a prescription medication.JJ53% of sufferers are willing to make any lifestyle changes necessary to avoid having to take a prescriptionmedication.Metabolic Conditionswww.<strong>Kantar</strong><strong>Health</strong>.com
National <strong>Health</strong> <strong>and</strong> <strong>Wellness</strong> Survey | Spain | Metabolic Conditions 253LifestyleAge Group% of sufferers Total 18-34 35-44 45-54 55-64 65 +Exercise* 63% 72% 63% 60% 61% 62%Smoke 27% 27% 32% 36% 32% 16%Drink alcohol 73% 76% 76% 74% 76% 67%Obese (BMI ≥ 30) 34% 41% 37% 35% 33% 29%*At least one day per month of vigorous exercise lasting 20 minutes or more.Quality of life60504049.046.451.1 51.249.1 48.3 47.043.3 44.7 45.5 46.549.53020100Total Population Age 18-34 Age 35-44 Age 45-54 Age 55-64 Age 65 +Physical summary scoreMental summary scoreWork productivity <strong>and</strong> activity impairmentAge GroupTotal 18-34 35-44 45-54 55-64 65 +Work Productivity Loss: % overallwork impairment due to health(Base: Employed Full-time)19.1 26.9 18.9 17.1 16.5 11.3Activity Impairment: % activity impairmentdue to health26.3 25.8 22.6 26.2 28.5 27.9Sufferers are self-reported.Metabolic Conditionswww.<strong>Kantar</strong><strong>Health</strong>.com
National <strong>Health</strong> <strong>and</strong> <strong>Wellness</strong> Survey | Spain | Musculoskeletal Conditions 254Musculoskeletal ConditionsMusculoskeletal conditions include the adult population suffering from Gout, Muscular Dystrophy, Osteoarthritis,Osteopenia, Osteoporosis <strong>and</strong> Paget’s Disease.% of adult population with Musculoskeletal conditions in SpainAge GroupTotal 18-34 35-44 45-54 55-64 65 +Self-<strong>Report</strong>ed (% total population) 15% 3% 5% 13% 26% 37%Male 34% 54% 42% 33% 39% 29%Female 66% 46% 58% 67% 61% 71%Diagnosed (% total population) 14% 3% 4% 12% 25% 35%Male 33% 54% 42% 32% 38% 28%Female 67% 46% 58% 68% 62% 72%Total adult population: 38,554,000Medication usageAge Group% of sufferers Total 18-34 35-44 45-54 55-64 65 +Prescription only 32% 27% 33% 26% 36% 33%OTC only* 11% 4% 10% 13% 8% 12%Prescription <strong>and</strong> OTC 28% 18% 18% 22% 30% 32%No product 29% 51% 39% 38% 26% 23%*Including over-the-counter <strong>and</strong> herbal products.AttitudesJJ8% of sufferers prefer to treat themselves with an over-the-counter medication than to depend on a doctor togive them a prescription medication.JJ52% of sufferers are willing to make any lifestyle changes necessary to avoid having to take a prescriptionmedication.Musculoskeletal Conditionswww.<strong>Kantar</strong><strong>Health</strong>.com
National <strong>Health</strong> <strong>and</strong> <strong>Wellness</strong> Survey | Spain | Musculoskeletal Conditions 255LifestyleAge Group% of sufferers Total 18-34 35-44 45-54 55-64 65 +Exercise* 64% 81% 61% 57% 58% 67%Smoke 25% 37% 38% 39% 34% 14%Drink alcohol 71% 89% 70% 72% 71% 68%Obese (BMI ≥ 30) 22% 11% 15% 26% 26% 21%*At least one day per month of vigorous exercise lasting 20 minutes or more.Quality of life6050403045.445.848.345.4 44.9 43.8 44.9 44.3 45.439.4 40.548.420100Total Population Age 18-34 Age 35-44 Age 45-54 Age 55-64 Age 65 +Physical summary scoreMental summary scoreWork productivity <strong>and</strong> activity impairmentAge GroupTotal 18-34 35-44 45-54 55-64 65 +Work Productivity Loss: % overallwork impairment due to health(Base: Employed Full-time)24.8 37.8 29.4 22.4 21.6 16.3Activity Impairment: % activity impairmentdue to health34.5 38.5 41.1 35.5 37.4 31.8Sufferers are self-reported.Musculoskeletal Conditionswww.<strong>Kantar</strong><strong>Health</strong>.com
National <strong>Health</strong> <strong>and</strong> <strong>Wellness</strong> Survey | Spain | Neurological Conditions 256Neurological ConditionsNeurological conditions include the adult population suffering from Epilepsy, Hemiplegia, Migraine, MultipleSclerosis, Parkinson’s Disease <strong>and</strong> Restless Legs Syndrome (RLS).% of adult population with Neurological conditions in SpainAge GroupTotal 18-34 35-44 45-54 55-64 65 +Self-<strong>Report</strong>ed (% total population) 15% 15% 15% 19% 16% 11%Male 35% 37% 34% 32% 35% 34%Female 65% 63% 66% 68% 65% 66%Diagnosed (% total population) 8% 8% 9% 9% 9% 5%Male 29% 31% 27% 28% 31% 28%Female 71% 69% 73% 72% 69% 72%Total adult population: 38,554,000Medication usageAge Group% of sufferers Total 18-34 35-44 45-54 55-64 65 +Prescription only 31% 29% 36% 28% 36% 26%OTC only* 13% 14% 14% 14% 8% 10%Prescription <strong>and</strong> OTC 3% 4% 1% 3% 2% 4%No product 54% 53% 48% 55% 53% 60%*Including over-the-counter <strong>and</strong> herbal products.AttitudesJJ13% of sufferers prefer to treat themselves with an over-the-counter medication than to depend on a doctor togive them a prescription medication.JJ54% of sufferers are willing to make any lifestyle changes necessary to avoid having to take a prescriptionmedication.Neurological Conditionswww.<strong>Kantar</strong><strong>Health</strong>.com
National <strong>Health</strong> <strong>and</strong> <strong>Wellness</strong> Survey | Spain | Neurological Conditions 257LifestyleAge Group% of sufferers Total 18-34 35-44 45-54 55-64 65 +Exercise* 60% 75% 53% 55% 61% 56%Smoke 33% 35% 37% 36% 28% 20%Drink alcohol 71% 79% 72% 68% 69% 61%Obese (BMI ≥ 30) 17% 11% 16% 22% 19% 22%*At least one day per month of vigorous exercise lasting 20 minutes or more.Quality of life60504048.351.1 49.643.3 41.847.5 46.243.7 42.9 43.5 44.845.43020100Total Population Age 18-34 Age 35-44 Age 45-54 Age 55-64 Age 65 +Physical summary scoreMental summary scoreWork productivity <strong>and</strong> activity impairmentAge GroupTotal 18-34 35-44 45-54 55-64 65 +Work Productivity Loss: % overallwork impairment due to health(Base: Employed Full-time)22.9 28.8 17.2 24.4 19.6 31.0Activity Impairment: % activity impairmentdue to health32.6 29.7 27.1 34.1 37.6 39.3Sufferers are self-reported.Neurological Conditionswww.<strong>Kantar</strong><strong>Health</strong>.com
National <strong>Health</strong> <strong>and</strong> <strong>Wellness</strong> Survey | Spain | Ophthalmic Conditions 258Ophthalmic ConditionsOphthalmic conditions include the adult population suffering from Cataracts, Dry Eye, Glaucoma <strong>and</strong> MacularDegeneration.% of adult population with Ophthalmic conditions in SpainAge GroupTotal 18-34 35-44 45-54 55-64 65 +Self-<strong>Report</strong>ed (% total population) 11% 6% 6% 9% 13% 22%Male 41% 42% 48% 30% 44% 41%Female 59% 58% 52% 70% 56% 59%Diagnosed (% total population) 10% 4% 6% 8% 13% 21%Male 40% 38% 45% 31% 44% 41%Female 60% 62% 55% 69% 56% 59%Total adult population: 38,554,000Medication usageAge Group% of sufferers Total 18-34 35-44 45-54 55-64 65 +Prescription only 48% 27% 54% 49% 51% 52%OTC only* 7% 14% 10% 8% 4% 4%Prescription <strong>and</strong> OTC 3% 5% 5% 6% 2% 2%No product 42% 55% 31% 36% 43% 42%*Including over-the-counter <strong>and</strong> herbal products.AttitudesJJ9% of sufferers prefer to treat themselves with an over-the-counter medication than to depend on a doctor togive them a prescription medication.JJ54% of sufferers are willing to make any lifestyle changes necessary to avoid having to take a prescriptionmedication.Ophthalmic Conditionswww.<strong>Kantar</strong><strong>Health</strong>.com
National <strong>Health</strong> <strong>and</strong> <strong>Wellness</strong> Survey | Spain | Ophthalmic Conditions 259LifestyleAge Group% of sufferers Total 18-34 35-44 45-54 55-64 65 +Exercise* 66% 77% 79% 61% 68% 58%Smoke 25% 29% 37% 41% 26% 13%Drink alcohol 72% 82% 79% 83% 69% 63%Obese (BMI ≥ 30) 18% 11% 12% 17% 25% 20%*At least one day per month of vigorous exercise lasting 20 minutes or more.Quality of life6050403047.245.350.0 48.9 47.9 46.2 45.840.5 42.2 43.045.148.920100Total Population Age 18-34 Age 35-44 Age 45-54 Age 55-64 Age 65 +Physical summary scoreMental summary scoreWork productivity <strong>and</strong> activity impairmentAge GroupTotal 18-34 35-44 45-54 55-64 65 +Work Productivity Loss: % overallwork impairment due to health(Base: Employed Full-time)30.3 35.3 30.7 30.5 27.4 11.5Activity Impairment: % activity impairmentdue to health33.1 32.1 34.4 33.3 38.2 31.2Sufferers are self-reported.Ophthalmic Conditionswww.<strong>Kantar</strong><strong>Health</strong>.com
National <strong>Health</strong> <strong>and</strong> <strong>Wellness</strong> Survey | Spain | Pain Conditions 260Pain ConditionsPain conditions include the adult population suffering from Arthritis, Back Problems, Bladder Pain, Broken Bones,Cancer, Carpal Tunnel Syndrome, Dental Pain, Diabetic Neuropathic Pain, Fibromyalgia, Headache, HerpesZoster/Shingles, Hip/Pelvic Pain, Joint Pain, Lower Back Pain, Menstrual Cycle, Migraine, Neck Pain, NeuropathicPain, Phantom Limb Pain, Pinched Nerve in Lower Back, Plantar Fasciitis, Post-Herpetic Neuralgia, Shoulder Painor Stiffness, Spinal Disk, Sprains or Strains, Surgery or Other Medical Procedure, Tendonitis <strong>and</strong> Other Pain.% of adult population with Pain conditions in SpainAge GroupTotal 18-34 35-44 45-54 55-64 65 +Self-<strong>Report</strong>ed (% total population) 32% 31% 32% 35% 34% 29%Male 42% 43% 45% 44% 47% 31%Female 58% 57% 55% 56% 53% 69%Diagnosed (% total population) 27% 23% 27% 32% 31% 27%Male 40% 42% 42% 42% 47% 30%Female 60% 58% 58% 58% 53% 70%Total adult population: 38,554,000Medication usageAge Group% of sufferers Total 18-34 35-44 45-54 55-64 65 +Prescription only 39% 28% 37% 46% 46% 45%OTC only* 23% 27% 28% 21% 19% 14%Prescription <strong>and</strong> OTC 9% 8% 8% 10% 10% 9%No product 29% 37% 27% 23% 25% 33%*Including over-the-counter <strong>and</strong> herbal products.AttitudesJJ12% of sufferers prefer to treat themselves with an over-the-counter medication than to depend on a doctor togive them a prescription medication.JJ54% of sufferers are willing to make any lifestyle changes necessary to avoid having to take a prescriptionmedication.Pain Conditionswww.<strong>Kantar</strong><strong>Health</strong>.com
National <strong>Health</strong> <strong>and</strong> <strong>Wellness</strong> Survey | Spain | Pain Conditions 261LifestyleAge Group% of sufferers Total 18-34 35-44 45-54 55-64 65 +Exercise* 62% 74% 62% 56% 58% 55%Smoke 30% 28% 33% 38% 35% 14%Drink alcohol 75% 80% 77% 73% 76% 66%Obese (BMI ≥ 30) 17% 10% 14% 20% 20% 22%*At least one day per month of vigorous exercise lasting 20 minutes or more.Quality of life60504047.350.8 49.244.346.5 45.242.9 43.7 43.8 44.042.947.63020100Total Population Age 18-34 Age 35-44 Age 45-54 Age 55-64 Age 65 +Physical summary scoreMental summary scoreWork productivity <strong>and</strong> activity impairmentAge GroupTotal 18-34 35-44 45-54 55-64 65 +Work Productivity Loss: % overallwork impairment due to health(Base: Employed Full-time)22.0 23.8 21.3 21.3 23.2 13.8Activity Impairment: % activity impairmentdue to health31.7 25.9 28.9 32.8 38.1 37.3Sufferers are self-reported.Pain Conditionswww.<strong>Kantar</strong><strong>Health</strong>.com
National <strong>Health</strong> <strong>and</strong> <strong>Wellness</strong> Survey | Spain | Psychiatric Conditions 262Psychiatric ConditionsPsychiatric conditions include the adult population suffering from Anxiety, Attention Deficit/Hyperactivity Disorder(ADHD), Bipolar Disorder, Depression, Generalized Anxiety Disorder (GAD), Obsessive Compulsive Disorder(OCD), Phobias, Post Traumatic Stress Disorder (PTSD), Schizophrenia <strong>and</strong> Social Anxiety Disorder (SAD).% of adult population with Psychiatric conditions in SpainAge GroupTotal 18-34 35-44 45-54 55-64 65 +Self-<strong>Report</strong>ed (% total population) 25% 28% 26% 29% 27% 17%Male 38% 38% 41% 39% 40% 27%Female 62% 62% 59% 61% 60% 73%Diagnosed (% total population) 19% 17% 19% 23% 23% 14%Male 34% 32% 36% 36% 40% 24%Female 66% 68% 64% 64% 60% 76%Total adult population: 38,554,000Medication usageAge Group% of sufferers Total 18-34 35-44 45-54 55-64 65 +Prescription only 31% 20% 27% 37% 45% 37%OTC only* 18% 23% 19% 16% 11% 13%Prescription <strong>and</strong> OTC 10% 8% 10% 12% 8% 13%No product 42% 49% 45% 35% 36% 37%*Including over-the-counter <strong>and</strong> herbal products.AttitudesJJ13% of sufferers prefer to treat themselves with an over-the-counter medication than to depend on a doctor togive them a prescription medication.JJ53% of sufferers are willing to make any lifestyle changes necessary to avoid having to take a prescriptionmedication.Psychiatric Conditionswww.<strong>Kantar</strong><strong>Health</strong>.com
National <strong>Health</strong> <strong>and</strong> <strong>Wellness</strong> Survey | Spain | Psychiatric Conditions 263LifestyleAge Group% of sufferers Total 18-34 35-44 45-54 55-64 65 +Exercise* 60% 68% 60% 53% 57% 60%Smoke 37% 33% 40% 46% 46% 17%Drink alcohol 73% 80% 75% 71% 69% 61%Obese (BMI ≥ 30) 19% 13% 15% 24% 22% 24%*At least one day per month of vigorous exercise lasting 20 minutes or more.Quality of life60504030201048.951.7 50.048.0 47.044.439.0 38.5 39.0 38.7 39.1 40.20Total Population Age 18-34 Age 35-44 Age 45-54 Age 55-64 Age 65 +Physical summary scoreMental summary scoreWork productivity <strong>and</strong> activity impairmentAge GroupTotal 18-34 35-44 45-54 55-64 65 +Work Productivity Loss: % overallwork impairment due to health(Base: Employed Full-time)27.9 29.3 26.8 29.4 25.0 19.7Activity Impairment: % activity impairmentdue to health35.8 32.2 32.6 37.9 39.4 42.4Sufferers are self-reported.Psychiatric Conditionswww.<strong>Kantar</strong><strong>Health</strong>.com
National <strong>Health</strong> <strong>and</strong> <strong>Wellness</strong> Survey | Spain | Respiratory Conditions 264Respiratory ConditionsRespiratory conditions include the adult population suffering from Asthma, Chronic Bronchitis, Chronic ObstructivePulmonary Disease (COPD), Cystic Fibrosis, Emphysema, Hay Fever <strong>and</strong> Nasal Allergies.% of adult population with Respiratory conditions in SpainAge GroupTotal 18-34 35-44 45-54 55-64 65 +Self-<strong>Report</strong>ed (% total population) 23% 26% 24% 22% 19% 20%Male 49% 49% 51% 46% 46% 48%Female 51% 51% 49% 54% 54% 52%Diagnosed (% total population) 21% 24% 22% 20% 17% 18%Male 47% 47% 50% 45% 45% 45%Female 53% 53% 50% 55% 55% 55%Total adult population: 38,554,000Medication usageAge Group% of sufferers Total 18-34 35-44 45-54 55-64 65 +Prescription only 45% 52% 44% 42% 40% 40%OTC only* 13% 10% 14% 16% 12% 14%Prescription <strong>and</strong> OTC 14% 12% 17% 11% 12% 16%No product 28% 25% 25% 30% 37% 30%*Including over-the-counter <strong>and</strong> herbal products.AttitudesJJ12% of sufferers prefer to treat themselves with an over-the-counter medication than to depend on a doctor togive them a prescription medication.JJ53% of sufferers are willing to make any lifestyle changes necessary to avoid having to take a prescriptionmedication.Respiratory Conditionswww.<strong>Kantar</strong><strong>Health</strong>.com
National <strong>Health</strong> <strong>and</strong> <strong>Wellness</strong> Survey | Spain | Respiratory Conditions 265LifestyleAge Group% of sufferers Total 18-34 35-44 45-54 55-64 65 +Exercise* 67% 75% 65% 67% 61% 60%Smoke 28% 23% 29% 39% 38% 16%Drink alcohol 76% 80% 79% 75% 76% 67%Obese (BMI ≥ 30) 17% 12% 15% 16% 28% 24%*At least one day per month of vigorous exercise lasting 20 minutes or more.Quality of life60504049.451.8 51.248.945.1 46.643.9 44.5 45.5 44.0 45.247.73020100Total Population Age 18-34 Age 35-44 Age 45-54 Age 55-64 Age 65 +Physical summary scoreMental summary scoreWork productivity <strong>and</strong> activity impairmentAge GroupTotal 18-34 35-44 45-54 55-64 65 +Work Productivity Loss: % overallwork impairment due to health(Base: Employed Full-time)20.6 23.5 20.9 18.2 18.0 15.3Activity Impairment: % activity impairmentdue to health27.4 26.4 23.6 26.0 35.3 31.6Sufferers are self-reported.Respiratory Conditionswww.<strong>Kantar</strong><strong>Health</strong>.com
National <strong>Health</strong> <strong>and</strong> <strong>Wellness</strong> Survey | Spain | Urologic Conditions 266Urologic ConditionsUrologic conditions include the adult population suffering from Benign Prostatic Hyperplasia (BPH), ErectileDysfunction, Overactive Bladder (OAB), Premature Ejaculation, Stress Urinary Incontinence (SUI) <strong>and</strong> Urinary TractInfection.% of adult population with Urologic conditions in SpainAge GroupTotal 18-34 35-44 45-54 55-64 65 +Self-<strong>Report</strong>ed (% total population) 29% 25% 25% 27% 36% 38%Male 71% 67% 70% 68% 77% 74%Female 29% 33% 30% 32% 23% 26%Diagnosed (% total population) 10% 6% 5% 8% 13% 20%Male 53% 31% 34% 42% 56% 68%Female 47% 69% 66% 58% 44% 32%Total adult population: 38,554,000Medication usageAge Group% of sufferers Total 18-34 35-44 45-54 55-64 65 +Prescription only 14% 10% 7% 13% 19% 20%OTC only* 3% 2% 4% 2% 4% 3%Prescription <strong>and</strong> OTC 2% 2% 1% 1% 1% 2%No product 82% 86% 88% 85% 76% 75%*Including over-the-counter <strong>and</strong> herbal products.AttitudesJJ12% of sufferers prefer to treat themselves with an over-the-counter medication than to depend on a doctor togive them a prescription medication.JJ50% of sufferers are willing to make any lifestyle changes necessary to avoid having to take a prescriptionmedication.Urologic Conditionswww.<strong>Kantar</strong><strong>Health</strong>.com
National <strong>Health</strong> <strong>and</strong> <strong>Wellness</strong> Survey | Spain | Urologic Conditions 267LifestyleAge Group% of sufferers Total 18-34 35-44 45-54 55-64 65 +Exercise* 64% 76% 64% 61% 60% 59%Smoke 31% 30% 36% 40% 37% 18%Drink alcohol 78% 79% 79% 77% 80% 75%Obese (BMI ≥ 30) 20% 14% 17% 21% 26% 22%*At least one day per month of vigorous exercise lasting 20 minutes or more.Quality of life6050403048.845.150.7 50.247.8 47.9 47.342.1 42.8 43.9 45.649.620100Total Population Age 18-34 Age 35-44 Age 45-54 Age 55-64 Age 65 +Physical summary scoreMental summary scoreWork productivity <strong>and</strong> activity impairmentAge GroupTotal 18-34 35-44 45-54 55-64 65 +Work Productivity Loss: % overallwork impairment due to health(Base: Employed Full-time)24.7 29.8 25.8 22.7 18.7 17.8Activity Impairment: % activity impairmentdue to health29.5 30.2 29.8 31.1 30.2 27.3Sufferers are self-reported.Urologic Conditionswww.<strong>Kantar</strong><strong>Health</strong>.com
United Kingdomwww.<strong>Kantar</strong><strong>Health</strong>.com
National <strong>Health</strong> <strong>and</strong> <strong>Wellness</strong> Survey | United Kingdom 269Population profileJJThe proportion of elderly people in the population isincreasing, with the population aged 65 <strong>and</strong> olderexpected to be 21% in 2030.JJThe birth rate in the UK is slightly higher than theEuropean average. Net migration is also positive<strong>and</strong> below the European average.JJThe steadily rising levels of alcohol consumption <strong>and</strong>alcohol-related deaths <strong>and</strong> the sharp increases inadult <strong>and</strong> child obesity are among the most pressingpublic health concerns, along with the (albeit steadilydecreasing) rate of smoking prevalence, with 21%of men <strong>and</strong> 20% of women in Engl<strong>and</strong> being regularsmokers in 2012.Life expectancy <strong>and</strong> causes of deathJJVarious indicators show that the health of thepopulation is improving. Life expectancy at birth hasincreased by 2.0 years for both men <strong>and</strong> womensince 2004.JJNoncommunicable diseases cause over threequartersof deaths in the United Kingdom. Of these,cardiovascular diseases <strong>and</strong> cancers, accounting for60% of deaths.<strong>Health</strong>care systemJJThe UK’s National <strong>Health</strong> Service (NHS) is one ofthe world’s largest publicly funded health services.JJ<strong>Health</strong> services in the United Kingdom are largelyfree at the point of use through the NHS.JJ11% of the population is covered by private medicalinsurance (PMI), which mainly provides access toacute elective care in the private sector.Reimbursement policiesJJWhile most NHS healthcare is free at the point ofuse, some services are either not covered by theNHS or are only covered for specific patient groups(such as children). Therefore, patients must eitherpay for treatment themselves (direct payments) orpay part of the costs in the form of co-paymentssuch as for NHS dental care <strong>and</strong> prescriptioncharges. For patients with PMI, this may cover partor all of treatment costs not covered by the NHS.In addition, patients may elect to use their PMI forservices covered by the NHS.JJIn 2014, NHS charge increased from £7.85 to £8.05for each prescription, <strong>and</strong> is expected to increase to£8.25 in 2015.United Kingdomwww.<strong>Kantar</strong><strong>Health</strong>.com
National <strong>Health</strong> <strong>and</strong> <strong>Wellness</strong> Survey | United Kingdom 270General statisticsJJGross national income per capita (Intl $ 1 , 2012): 37,340JJLife expectancy at birth male/female (years): 79/83JJTotal expenditure on health per capita (Intl $, 2012): 3,495JJTotal expenditure on health as % of GDP (2012): 9.4%JJInternet penetration: Total population: 89.8%Lifestyle statistics 3JJTotal % of adult population that:20.0%22.1%58.5%82.0%Smokes Exercises 2 Drinks Alcohol Is Obese (BMI ≥ 30)DemographicsJJTotal population: 62,783,000JJArea size: 243,610 km 2JJDoctors (per 10,000 population): 27.9JJHospital beds (per 10,000 population): 29Rank City % Population1 London 12.9%2 Birmingham 1.7%33 Glasgow 0.9%4 Liverpool 0.9%5 Bristol 0.8%45211The international $ is a currency unit that is calculated using purchasing power parities (PPP), which are rates ofcurrency conversion constructed to account for differences in price level between countries.2At least one day per month of vigorous exercise lasting 20 minutes or more.3Adult population: 49,809,000United Kingdomwww.<strong>Kantar</strong><strong>Health</strong>.com
National <strong>Health</strong> <strong>and</strong> <strong>Wellness</strong> Survey | United Kingdom | Autoimmune Conditions 271Autoimmune ConditionsAutoimmune conditions include the adult population suffering from Ankylosing Spondylitis, Connective TissueDisease, Idiopathic Thrombocytopenia Purpura (ITP), Inflammatory Bowel Disease (Crohn’s Disease or UlcerativeColitis), Lupus, Psoriasis, Psoriatic Arthritis, Rheumatoid Arthritis <strong>and</strong> Sjögren’s Syndrome.% of adult population with Autoimmune conditions in the United KingdomAge GroupTotal 18-34 35-44 45-54 55-64 65 +Self-<strong>Report</strong>ed (% total population) 9% 5% 8% 9% 12% 13%Male 43% 39% 45% 44% 43% 42%Female 57% 61% 55% 56% 57% 58%Diagnosed (% total population) 8% 4% 7% 8% 11% 13%Male 42% 38% 43% 45% 43% 42%Female 58% 62% 57% 55% 57% 58%Total adult population: 49,809,000Medication usageAge Group% of sufferers Total 18-34 35-44 45-54 55-64 65 +Prescription only 52% 42% 47% 57% 57% 53%OTC only* 12% 14% 14% 9% 10% 12%Prescription <strong>and</strong> OTC 9% 10% 13% 8% 8% 7%No product 28% 35% 26% 27% 24% 29%*Including over-the-counter <strong>and</strong> herbal products.AttitudesJJ24% of sufferers prefer to treat themselves with an over-the-counter medication than to depend on a doctor togive them a prescription medication.JJ54% of sufferers are willing to make any lifestyle changes necessary to avoid having to take a prescriptionmedication.Autoimmune Conditionswww.<strong>Kantar</strong><strong>Health</strong>.com
National <strong>Health</strong> <strong>and</strong> <strong>Wellness</strong> Survey | United Kingdom | Autoimmune Conditions 272LifestyleAge Group% of sufferers Total 18-34 35-44 45-54 55-64 65 +Exercise* 48% 69% 55% 49% 42% 38%Smoke 23% 35% 32% 25% 25% 11%Drink alcohol 81% 83% 84% 79% 82% 79%Obese (BMI ≥ 30) 30% 21% 23% 35% 33% 34%*At least one day per month of vigorous exercise lasting 20 minutes or more.Quality of life6050403043.144.548.146.245.241.6 40.8 41.8 41.9 41.2 40.948.620100Total Population Age 18-34 Age 35-44 Age 45-54 Age 55-64 Age 65 +Physical summary scoreMental summary scoreWork productivity <strong>and</strong> activity impairmentAge GroupTotal 18-34 35-44 45-54 55-64 65 +Work Productivity Loss: % overallwork impairment due to health(Base: Employed Full-time)27.6 27.6 27.5 29.6 27.0 17.1Activity Impairment: % activity impairmentdue to health41.1 35.1 39.3 44.3 43.7 41.6Sufferers are self-reported.Autoimmune Conditionswww.<strong>Kantar</strong><strong>Health</strong>.com
National <strong>Health</strong> <strong>and</strong> <strong>Wellness</strong> Survey | United Kingdom | Cancer Conditions 273Cancer ConditionsCancer conditions include the adult population suffering from Breast Cancer, Cervical Cancer, Colorectal Cancer,Leukemia, Lymphoma, Metastatic Solid Tumor, Non-Small Cell Lung Cancer, Prostate Cancer, Small-Cell LungCancer, Uterine Cancer <strong>and</strong> Other Cancer.% of adult population with Cancer conditions in the United KingdomAge GroupTotal 18-34 35-44 45-54 55-64 65 +Self-<strong>Report</strong>ed (% total population) 5% 1% 2% 4% 8% 13%Male 40% 60% 43% 28% 43% 39%Female 60% 40% 57% 72% 57% 61%Diagnosed (% total population) 5% 1% 2% 4% 8% 13%Male 40% 63% 41% 27% 43% 39%Female 60% 37% 59% 73% 57% 61%Total adult population: 49,809,000Medication usageAge Group% of sufferers Total 18-34 35-44 45-54 55-64 65 +Using prescription 24% 40% 13% 26% 22% 22%Not using prescription 76% 60% 87% 74% 78% 78%Over-the-counter usage was not captured for Cancer.AttitudesJJ22% of sufferers prefer to treat themselves with an over-the-counter medication than to depend on a doctor togive them a prescription medication.JJ54% of sufferers are willing to make any lifestyle changes necessary to avoid having to take a prescriptionmedication.Cancer Conditionswww.<strong>Kantar</strong><strong>Health</strong>.com
National <strong>Health</strong> <strong>and</strong> <strong>Wellness</strong> Survey | United Kingdom | Cancer Conditions 274LifestyleAge Group% of sufferers Total 18-34 35-44 45-54 55-64 65 +Exercise* 48% 76% 53% 53% 48% 42%Smoke 19% 58% 42% 29% 14% 10%Drink alcohol 79% 88% 88% 71% 81% 79%Obese (BMI ≥ 30) 26% 19% 16% 24% 31% 27%*At least one day per month of vigorous exercise lasting 20 minutes or more.Quality of life6050403044.647.042.4 44.138.146.1 44.546.744.641.5 42.850.120100Total Population Age 18-34 Age 35-44 Age 45-54 Age 55-64 Age 65 +Physical summary scoreMental summary scoreWork productivity <strong>and</strong> activity impairmentAge GroupTotal 18-34 35-44 45-54 55-64 65 +Work Productivity Loss: % overallwork impairment due to health(Base: Employed Full-time)38.6 62.6 49.0 33.6 29.2 8.3Activity Impairment: % activity impairmentdue to health36.4 55.3 50.2 38.8 34.6 32.4Sufferers are self-reported.Cancer Conditionswww.<strong>Kantar</strong><strong>Health</strong>.com
National <strong>Health</strong> <strong>and</strong> <strong>Wellness</strong> Survey | United Kingdom | Cardiovascular Conditions 275Cardiovascular ConditionsCardiovascular conditions include the adult population suffering from Angina Pectoris, Arrhythmia, Atherosclerosis,Atrial Fibrillation, Congestive Heart Failure (CHF), Deep Vein Thrombosis (DVT), Heart Attack, Heart Murmur,High Cholesterol, Hypertension, Left Ventricular Hypertrophy (LVH), Peripheral Arterial Disease (PAD), PeripheralVascular Disease (PVD), Pulmonary Embolism, Stroke or Mini-Stroke/Transient Ischemia <strong>and</strong> Unstable Angina.% of adult population with Cardiovascular conditions in the United KingdomAge GroupTotal 18-34 35-44 45-54 55-64 65 +Self-<strong>Report</strong>ed (% total population) 35% 13% 20% 33% 53% 64%Male 52% 51% 59% 56% 55% 47%Female 48% 49% 41% 44% 45% 53%Diagnosed (% total population) 33% 10% 18% 31% 52% 63%Male 52% 50% 58% 55% 55% 47%Female 48% 50% 42% 45% 45% 53%Total adult population: 49,809,000Medication usageAge Group% of sufferers Total 18-34 35-44 45-54 55-64 65 +Prescription only 59% 22% 36% 49% 66% 74%OTC only* 4% 8% 10% 4% 4% 2%Prescription <strong>and</strong> OTC 8% 9% 7% 6% 7% 9%No product 29% 61% 46% 41% 23% 14%*Including over-the-counter <strong>and</strong> herbal products.AttitudesJJ24% of sufferers prefer to treat themselves with an over-the-counter medication than to depend on a doctor togive them a prescription medication.JJ55% of sufferers are willing to make any lifestyle changes necessary to avoid having to take a prescriptionmedication.Cardiovascular Conditionswww.<strong>Kantar</strong><strong>Health</strong>.com
National <strong>Health</strong> <strong>and</strong> <strong>Wellness</strong> Survey | United Kingdom | Cardiovascular Conditions 276LifestyleAge Group% of sufferers Total 18-34 35-44 45-54 55-64 65 +Exercise* 51% 71% 65% 54% 47% 44%Smoke 19% 33% 32% 23% 18% 12%Drink alcohol 82% 83% 82% 81% 81% 82%Obese (BMI ≥ 30) 32% 21% 33% 39% 35% 30%*At least one day per month of vigorous exercise lasting 20 minutes or more.Quality of life6050403045.646.547.8 47.838.845.9 45.3 47.144.441.4 42.951.120100Total Population Age 18-34 Age 35-44 Age 45-54 Age 55-64 Age 65 +Physical summary scoreMental summary scoreWork productivity <strong>and</strong> activity impairmentAge GroupTotal 18-34 35-44 45-54 55-64 65 +Work Productivity Loss: % overallwork impairment due to health(Base: Employed Full-time)25.7 39.7 25.8 23.6 18.7 11.0Activity Impairment: % activity impairmentdue to health33.8 38.0 34.5 36.2 32.6 32.1Sufferers are self-reported.Cardiovascular Conditionswww.<strong>Kantar</strong><strong>Health</strong>.com
National <strong>Health</strong> <strong>and</strong> <strong>Wellness</strong> Survey | United Kingdom | Gastrointestinal Conditions 277Gastrointestinal ConditionsGastrointestinal conditions include the adult population suffering from Chronic Constipation, Diarrhea, Diverticulitis,Gastroesophageal Reflux Disease (GERD), Heartburn <strong>and</strong> Irritable Bowel Syndrome (IBS).% of adult population with Gastrointestinal conditions in the United KingdomAge GroupTotal 18-34 35-44 45-54 55-64 65 +Self-<strong>Report</strong>ed (% total population) 36% 31% 36% 38% 41% 37%Male 43% 41% 48% 45% 47% 38%Female 57% 59% 52% 55% 53% 62%Diagnosed (% total population) 21% 16% 20% 22% 26% 26%Male 38% 36% 40% 41% 42% 35%Female 62% 64% 60% 59% 58% 65%Total adult population: 49,809,000Medication usageAge Group% of sufferers Total 18-34 35-44 45-54 55-64 65 +Prescription only 22% 15% 17% 21% 25% 33%OTC only* 35% 33% 38% 39% 38% 31%Prescription <strong>and</strong> OTC 11% 10% 11% 10% 13% 12%No product 31% 42% 34% 29% 24% 24%*Including over-the-counter <strong>and</strong> herbal products.AttitudesJJ35% of sufferers prefer to treat themselves with an over-the-counter medication than to depend on a doctor togive them a prescription medication.JJ57% of sufferers are willing to make any lifestyle changes necessary to avoid having to take a prescriptionmedication.Gastrointestinal Conditionswww.<strong>Kantar</strong><strong>Health</strong>.com
National <strong>Health</strong> <strong>and</strong> <strong>Wellness</strong> Survey | United Kingdom | Gastrointestinal Conditions 278LifestyleAge Group% of sufferers Total 18-34 35-44 45-54 55-64 65 +Exercise* 55% 69% 59% 50% 46% 47%Smoke 22% 28% 28% 25% 20% 11%Drink alcohol 82% 83% 81% 83% 82% 80%Obese (BMI ≥ 30) 27% 20% 27% 33% 32% 26%*At least one day per month of vigorous exercise lasting 20 minutes or more.Quality of life6050403047.544.451.2 49.947.041.2 42.8 42.844.6 45.7 43.949.520100Total Population Age 18-34 Age 35-44 Age 45-54 Age 55-64 Age 65 +Physical summary scoreMental summary scoreWork productivity <strong>and</strong> activity impairmentAge GroupTotal 18-34 35-44 45-54 55-64 65 +Work Productivity Loss: % overallwork impairment due to health(Base: Employed Full-time)22.6 25.2 19.8 22.9 21.1 17.2Activity Impairment: % activity impairmentdue to health31.6 28.2 28.2 33.7 34.6 34.1Sufferers are self-reported.Gastrointestinal Conditionswww.<strong>Kantar</strong><strong>Health</strong>.com
National <strong>Health</strong> <strong>and</strong> <strong>Wellness</strong> Survey | United Kingdom | Infectious Diseases 279Infectious DiseasesInfectious Diseases include the adult population suffering from AIDS, C. Difficile, Community-Acquired Pneumonia(CAP), Genital Herpes, Genital Warts, Hospital-Acquired Pneumonia (HAP), Hepatitis A, Hepatitis B, Hepatitis C,HIV, Tuberculosis <strong>and</strong> Yeast Infection.% of adult population with Infectious Diseases in the United KingdomAge GroupTotal 18-34 35-44 45-54 55-64 65 +Self-<strong>Report</strong>ed (% total population) 4% 4% 4% 5% 4% 4%Male 50% 51% 47% 53% 57% 42%Female 50% 49% 53% 47% 43% 58%Diagnosed (% total population) 4% 4% 3% 4% 4% 4%Male 49% 48% 46% 54% 58% 44%Female 51% 52% 54% 46% 42% 56%Total adult population: 49,809,000Medication usageAge Group% of sufferers Total 18-34 35-44 45-54 55-64 65 +Using prescription 21% 31% 25% 18% 23% 8%Not using prescription 79% 69% 75% 82% 77% 92%Over-the-counter usage was not captured for Infectious Diseases.AttitudesJJ29% of sufferers prefer to treat themselves with an over-the-counter medication than to depend on a doctor togive them a prescription medication.JJ54% of sufferers are willing to make any lifestyle changes necessary to avoid having to take a prescriptionmedication.Infectious Diseaseswww.<strong>Kantar</strong><strong>Health</strong>.com
National <strong>Health</strong> <strong>and</strong> <strong>Wellness</strong> Survey | United Kingdom | Infectious Diseases 280LifestyleAge Group% of sufferers Total 18-34 35-44 45-54 55-64 65 +Exercise* 61% 77% 66% 55% 47% 49%Smoke 29% 44% 36% 24% 28% 11%Drink alcohol 83% 87% 81% 83% 80% 81%Obese (BMI ≥ 30) 23% 14% 27% 25% 24% 28%*At least one day per month of vigorous exercise lasting 20 minutes or more.Quality of life6050403046.5 48.3 47.6 47.643.141.537.144.0 43.345.2 44.749.820100Total Population Age 18-34 Age 35-44 Age 45-54 Age 55-64 Age 65 +Physical summary scoreMental summary scoreWork productivity <strong>and</strong> activity impairmentAge GroupTotal 18-34 35-44 45-54 55-64 65 +Work Productivity Loss: % overallwork impairment due to health(Base: Employed Full-time)31.1 40.4 29.1 21.3 19.8 5.9Activity Impairment: % activity impairmentdue to health36.3 39.8 37.0 32.7 36.9 34.2Sufferers are self-reported.Infectious Diseaseswww.<strong>Kantar</strong><strong>Health</strong>.com
National <strong>Health</strong> <strong>and</strong> <strong>Wellness</strong> Survey | United Kingdom | Metabolic Conditions 281Metabolic ConditionsMetabolic conditions include the adult population suffering from High Cholesterol, Hypertension, Obesity, ThyroidCondition, Type 1 Diabetes <strong>and</strong> Type 2 Diabetes.% of adult population with Metabolic conditions in the United KingdomAge GroupTotal 18-34 35-44 45-54 55-64 65 +Self-<strong>Report</strong>ed (% total population) 45% 22% 35% 47% 62% 69%Male 49% 47% 52% 52% 53% 46%Female 51% 53% 48% 48% 47% 54%Diagnosed (% total population) 33% 8% 19% 32% 52% 63%Male 49% 46% 53% 52% 53% 46%Female 51% 54% 47% 48% 47% 54%Total adult population: 49,809,000Medication usageAge Group% of sufferers Total 18-34 35-44 45-54 55-64 65 +Prescription only 50% 17% 27% 42% 61% 71%OTC only* 3% 2% 5% 3% 3% 2%Prescription <strong>and</strong> OTC 6% 3% 4% 4% 5% 8%No product 41% 78% 63% 51% 31% 19%*Including over-the-counter <strong>and</strong> herbal products.AttitudesJJ27% of sufferers prefer to treat themselves with an over-the-counter medication than to depend on a doctor togive them a prescription medication.JJ55% of sufferers are willing to make any lifestyle changes necessary to avoid having to take a prescriptionmedication.Metabolic Conditionswww.<strong>Kantar</strong><strong>Health</strong>.com
National <strong>Health</strong> <strong>and</strong> <strong>Wellness</strong> Survey | United Kingdom | Metabolic Conditions 282LifestyleAge Group% of sufferers Total 18-34 35-44 45-54 55-64 65 +Exercise* 52% 69% 62% 51% 46% 45%Smoke 19% 28% 27% 21% 17% 12%Drink alcohol 81% 81% 79% 81% 81% 81%Obese (BMI ≥ 30) 49% 66% 62% 57% 45% 36%*At least one day per month of vigorous exercise lasting 20 minutes or more.Quality of life6050403046.546.549.4 49.540.846.7 45.7 47.543.3 43.644.551.120100Total Population Age 18-34 Age 35-44 Age 45-54 Age 55-64 Age 65 +Physical summary scoreMental summary scoreWork productivity <strong>and</strong> activity impairmentAge GroupTotal 18-34 35-44 45-54 55-64 65 +Work Productivity Loss: % overallwork impairment due to health(Base: Employed Full-time)23.1 32.0 22.1 21.2 17.8 12.4Activity Impairment: % activity impairmentdue to health31.7 32.7 28.7 33.2 31.2 31.9Sufferers are self-reported.Metabolic Conditionswww.<strong>Kantar</strong><strong>Health</strong>.com
National <strong>Health</strong> <strong>and</strong> <strong>Wellness</strong> Survey | United Kingdom | Musculoskeletal Conditions 283Musculoskeletal ConditionsMusculoskeletal conditions include the adult population suffering from Gout, Muscular Dystrophy, Osteoarthritis,Osteopenia, Osteoporosis <strong>and</strong> Paget’s Disease.% of adult population with Musculoskeletal conditions in the United KingdomAge GroupTotal 18-34 35-44 45-54 55-64 65 +Self-<strong>Report</strong>ed (% total population) 18% 3% 7% 15% 30% 40%Male 41% 45% 51% 48% 44% 36%Female 59% 55% 49% 52% 56% 64%Diagnosed (% total population) 17% 3% 7% 14% 28% 38%Male 41% 46% 51% 48% 44% 35%Female 59% 54% 49% 52% 56% 65%Total adult population: 49,809,000Medication usageAge Group% of sufferers Total 18-34 35-44 45-54 55-64 65 +Prescription only 38% 36% 35% 40% 39% 38%OTC only* 17% 15% 13% 16% 19% 17%Prescription <strong>and</strong> OTC 15% 18% 11% 12% 15% 16%No product 30% 32% 42% 33% 27% 29%*Including over-the-counter <strong>and</strong> herbal products.AttitudesJJ21% of sufferers prefer to treat themselves with an over-the-counter medication than to depend on a doctor togive them a prescription medication.JJ53% of sufferers are willing to make any lifestyle changes necessary to avoid having to take a prescriptionmedication.Musculoskeletal Conditionswww.<strong>Kantar</strong><strong>Health</strong>.com
National <strong>Health</strong> <strong>and</strong> <strong>Wellness</strong> Survey | United Kingdom | Musculoskeletal Conditions 284LifestyleAge Group% of sufferers Total 18-34 35-44 45-54 55-64 65 +Exercise* 46% 74% 54% 44% 41% 44%Smoke 18% 42% 33% 24% 20% 11%Drink alcohol 79% 76% 79% 77% 80% 80%Obese (BMI ≥ 30) 34% 23% 38% 38% 36% 33%*At least one day per month of vigorous exercise lasting 20 minutes or more.Quality of life60504030201046.846.041.7 42.3 43.541.1 41.7 42.6 41.4 41.538.550.10Total Population Age 18-34 Age 35-44 Age 45-54 Age 55-64 Age 65 +Physical summary scoreMental summary scoreWork productivity <strong>and</strong> activity impairmentAge GroupTotal 18-34 35-44 45-54 55-64 65 +Work Productivity Loss: % overallwork impairment due to health(Base: Employed Full-time)31.8 49.6 31.1 29.7 27.7 22.1Activity Impairment: % activity impairmentdue to health41.3 51.4 43.8 44.9 41.8 38.5Sufferers are self-reported.Musculoskeletal Conditionswww.<strong>Kantar</strong><strong>Health</strong>.com
National <strong>Health</strong> <strong>and</strong> <strong>Wellness</strong> Survey | United Kingdom | Neurological Conditions 285Neurological ConditionsNeurological conditions include the adult population suffering from Epilepsy, Hemiplegia, Migraine, MultipleSclerosis, Parkinson’s Disease <strong>and</strong> Restless Legs Syndrome (RLS).% of adult population with Neurological conditions in the United KingdomAge GroupTotal 18-34 35-44 45-54 55-64 65 +Self-<strong>Report</strong>ed (% total population) 25% 21% 24% 29% 28% 24%Male 36% 33% 38% 40% 36% 33%Female 64% 67% 62% 60% 64% 67%Diagnosed (% total population) 10% 8% 11% 13% 12% 10%Male 33% 29% 32% 39% 34% 29%Female 67% 71% 68% 61% 66% 71%Total adult population: 49,809,000Medication usageAge Group% of sufferers Total 18-34 35-44 45-54 55-64 65 +Prescription only 17% 14% 18% 19% 18% 18%OTC only* 22% 28% 29% 22% 19% 13%Prescription <strong>and</strong> OTC 4% 5% 5% 4% 4% 2%No product 57% 53% 49% 55% 59% 67%*Including over-the-counter <strong>and</strong> herbal products.AttitudesJJ35% of sufferers prefer to treat themselves with an over-the-counter medication than to depend on a doctor togive them a prescription medication.JJ58% of sufferers are willing to make any lifestyle changes necessary to avoid having to take a prescriptionmedication.Neurological Conditionswww.<strong>Kantar</strong><strong>Health</strong>.com
National <strong>Health</strong> <strong>and</strong> <strong>Wellness</strong> Survey | United Kingdom | Neurological Conditions 286LifestyleAge Group% of sufferers Total 18-34 35-44 45-54 55-64 65 +Exercise* 54% 65% 59% 50% 46% 46%Smoke 22% 27% 29% 21% 18% 13%Drink alcohol 81% 82% 81% 80% 80% 80%Obese (BMI ≥ 30) 28% 19% 27% 31% 35% 30%*At least one day per month of vigorous exercise lasting 20 minutes or more.Quality of life6050403047.144.150.840.648.846.4 44.7 46.042.6 42.744.449.320100Total Population Age 18-34 Age 35-44 Age 45-54 Age 55-64 Age 65 +Physical summary scoreMental summary scoreWork productivity <strong>and</strong> activity impairmentAge GroupTotal 18-34 35-44 45-54 55-64 65 +Work Productivity Loss: % overallwork impairment due to health(Base: Employed Full-time)23.2 26.0 21.9 21.8 22.8 8.4Activity Impairment: % activity impairmentdue to health32.8 28.9 32.1 34.8 34.7 34.5Sufferers are self-reported.Neurological Conditionswww.<strong>Kantar</strong><strong>Health</strong>.com
National <strong>Health</strong> <strong>and</strong> <strong>Wellness</strong> Survey | United Kingdom | Ophthalmic Conditions 287Ophthalmic ConditionsOphthalmic conditions include the adult population suffering from Cataracts, Dry Eye, Glaucoma <strong>and</strong> MacularDegeneration.% of adult population with Ophthalmic conditions in the United KingdomAge GroupTotal 18-34 35-44 45-54 55-64 65 +Self-<strong>Report</strong>ed (% total population) 10% 4% 5% 7% 12% 23%Male 39% 50% 46% 45% 37% 34%Female 61% 50% 54% 55% 63% 66%Diagnosed (% total population) 8% 3% 3% 5% 10% 21%Male 37% 53% 41% 39% 37% 34%Female 63% 47% 59% 61% 63% 66%Total adult population: 49,809,000Medication usageAge Group% of sufferers Total 18-34 35-44 45-54 55-64 65 +Prescription only 29% 22% 19% 28% 29% 33%OTC only* 18% 17% 33% 21% 24% 13%Prescription <strong>and</strong> OTC 6% 15% 9% 3% 5% 4%No product 47% 47% 39% 49% 42% 50%*Including over-the-counter <strong>and</strong> herbal products.AttitudesJJ26% of sufferers prefer to treat themselves with an over-the-counter medication than to depend on a doctor togive them a prescription medication.JJ58% of sufferers are willing to make any lifestyle changes necessary to avoid having to take a prescriptionmedication.Ophthalmic Conditionswww.<strong>Kantar</strong><strong>Health</strong>.com
National <strong>Health</strong> <strong>and</strong> <strong>Wellness</strong> Survey | United Kingdom | Ophthalmic Conditions 288LifestyleAge Group% of sufferers Total 18-34 35-44 45-54 55-64 65 +Exercise* 49% 70% 65% 48% 49% 43%Smoke 17% 32% 25% 20% 15% 11%Drink alcohol 81% 86% 79% 81% 81% 80%Obese (BMI ≥ 30) 28% 24% 29% 32% 30% 27%*At least one day per month of vigorous exercise lasting 20 minutes or more.Quality of life6050403044.346.047.5 48.344.0 43.946.043.138.5 39.6 40.650.120100Total Population Age 18-34 Age 35-44 Age 45-54 Age 55-64 Age 65 +Physical summary scoreMental summary scoreWork productivity <strong>and</strong> activity impairmentAge GroupTotal 18-34 35-44 45-54 55-64 65 +Work Productivity Loss: % overallwork impairment due to health(Base: Employed Full-time)29.5 40.1 26.1 26.1 26.0 9.6Activity Impairment: % activity impairmentdue to health36.6 37.4 35.1 40.2 36.2 35.9Sufferers are self-reported.Ophthalmic Conditionswww.<strong>Kantar</strong><strong>Health</strong>.com
National <strong>Health</strong> <strong>and</strong> <strong>Wellness</strong> Survey | United Kingdom | Pain Conditions 289Pain ConditionsPain conditions include the adult population suffering from Arthritis, Back Problems, Bladder Pain, Broken Bones,Cancer, Carpal Tunnel Syndrome, Dental Pain, Diabetic Neuropathic Pain, Fibromyalgia, Headache, HerpesZoster/Shingles, Hip/Pelvic Pain, Joint Pain, Lower Back Pain, Menstrual Cycle, Migraine, Neck Pain, NeuropathicPain, Phantom Limb Pain, Pinched Nerve in Lower Back, Plantar Fasciitis, Post-Herpetic Neuralgia, Shoulder Painor Stiffness, Spinal Disk, Sprains or Strains, Surgery or Other Medical Procedure, Tendonitis <strong>and</strong> Other Pain.% of adult population with Pain conditions in the United KingdomAge GroupTotal 18-34 35-44 45-54 55-64 65 +Self-<strong>Report</strong>ed (% total population) 39% 30% 35% 43% 48% 45%Male 44% 42% 47% 47% 49% 39%Female 56% 58% 53% 53% 51% 61%Diagnosed (% total population) 30% 17% 25% 34% 39% 39%Male 42% 35% 43% 45% 48% 38%Female 58% 65% 57% 55% 52% 62%Total adult population: 49,809,000Medication usageAge Group% of sufferers Total 18-34 35-44 45-54 55-64 65 +Prescription only 29% 16% 23% 30% 33% 39%OTC only* 39% 48% 47% 43% 36% 27%Prescription <strong>and</strong> OTC 10% 8% 11% 11% 11% 10%No product 22% 28% 20% 16% 19% 25%*Including over-the-counter <strong>and</strong> herbal products.AttitudesJJ31% of sufferers prefer to treat themselves with an over-the-counter medication than to depend on a doctor togive them a prescription medication.JJ56% of sufferers are willing to make any lifestyle changes necessary to avoid having to take a prescriptionmedication.Pain Conditionswww.<strong>Kantar</strong><strong>Health</strong>.com
National <strong>Health</strong> <strong>and</strong> <strong>Wellness</strong> Survey | United Kingdom | Pain Conditions 290LifestyleAge Group% of sufferers Total 18-34 35-44 45-54 55-64 65 +Exercise* 51% 67% 57% 49% 45% 41%Smoke 21% 25% 28% 25% 20% 12%Drink alcohol 80% 81% 81% 80% 81% 79%Obese (BMI ≥ 30) 28% 18% 28% 33% 34% 30%*At least one day per month of vigorous exercise lasting 20 minutes or more.Quality of life6050403045.045.149.5 47.744.246.241.5 43.0 43.6 43.0 41.750.120100Total Population Age 18-34 Age 35-44 Age 45-54 Age 55-64 Age 65 +Physical summary scoreMental summary scoreWork productivity <strong>and</strong> activity impairmentAge GroupTotal 18-34 35-44 45-54 55-64 65 +Work Productivity Loss: % overallwork impairment due to health(Base: Employed Full-time)24.5 27.1 21.8 25.4 23.0 14.5Activity Impairment: % activity impairmentdue to health35.9 30.9 32.7 38.6 37.4 38.8Sufferers are self-reported.Pain Conditionswww.<strong>Kantar</strong><strong>Health</strong>.com
National <strong>Health</strong> <strong>and</strong> <strong>Wellness</strong> Survey | United Kingdom | Psychiatric Conditions 291Psychiatric ConditionsPsychiatric conditions include the adult population suffering from Anxiety, Attention Deficit/Hyperactivity Disorder(ADHD), Bipolar Disorder, Depression, Generalized Anxiety Disorder (GAD), Obsessive Compulsive Disorder(OCD), Phobias, Post Traumatic Stress Disorder (PTSD), Schizophrenia <strong>and</strong> Social Anxiety Disorder (SAD).% of adult population with Psychiatric conditions in the United KingdomAge GroupTotal 18-34 35-44 45-54 55-64 65 +Self-<strong>Report</strong>ed (% total population) 31% 36% 33% 36% 31% 17%Male 43% 42% 46% 45% 44% 35%Female 57% 58% 54% 55% 56% 65%Diagnosed (% total population) 22% 24% 25% 27% 24% 13%Male 42% 40% 45% 44% 45% 35%Female 58% 60% 55% 56% 55% 65%Total adult population: 49,809,000Medication usageAge Group% of sufferers Total 18-34 35-44 45-54 55-64 65 +Prescription only 35% 26% 38% 45% 41% 34%OTC only* 11% 12% 11% 9% 11% 10%Prescription <strong>and</strong> OTC 4% 6% 5% 4% 2% 2%No product 50% 57% 46% 43% 46% 54%*Including over-the-counter <strong>and</strong> herbal products.AttitudesJJ34% of sufferers prefer to treat themselves with an over-the-counter medication than to depend on a doctor togive them a prescription medication.JJ56% of sufferers are willing to make any lifestyle changes necessary to avoid having to take a prescriptionmedication.Psychiatric Conditionswww.<strong>Kantar</strong><strong>Health</strong>.com
National <strong>Health</strong> <strong>and</strong> <strong>Wellness</strong> Survey | United Kingdom | Psychiatric Conditions 292LifestyleAge Group% of sufferers Total 18-34 35-44 45-54 55-64 65 +Exercise* 55% 67% 57% 50% 43% 42%Smoke 27% 30% 32% 27% 25% 16%Drink alcohol 81% 82% 82% 81% 78% 78%Obese (BMI ≥ 30) 26% 18% 26% 32% 31% 30%*At least one day per month of vigorous exercise lasting 20 minutes or more.Quality of life6050403048.351.9 50.146.944.2 43.337.7 36.5 37.1 37.1 38.942.020100Total Population Age 18-34 Age 35-44 Age 45-54 Age 55-64 Age 65 +Physical summary scoreMental summary scoreWork productivity <strong>and</strong> activity impairmentAge GroupTotal 18-34 35-44 45-54 55-64 65 +Work Productivity Loss: % overallwork impairment due to health(Base: Employed Full-time)31.5 33.3 28.1 31.5 32.7 9.7Activity Impairment: % activity impairmentdue to health38.1 33.4 35.6 40.9 44.2 42.2Sufferers are self-reported.Psychiatric Conditionswww.<strong>Kantar</strong><strong>Health</strong>.com
National <strong>Health</strong> <strong>and</strong> <strong>Wellness</strong> Survey | United Kingdom | Respiratory Conditions 293Respiratory ConditionsRespiratory conditions include the adult population suffering from Asthma, Chronic Bronchitis, Chronic ObstructivePulmonary Disease (COPD), Cystic Fibrosis, Emphysema, Hay Fever <strong>and</strong> Nasal Allergies.% of adult population with Respiratory conditions in the United KingdomAge GroupTotal 18-34 35-44 45-54 55-64 65 +Self-<strong>Report</strong>ed (% total population) 28% 29% 30% 27% 27% 25%Male 44% 45% 47% 46% 47% 39%Female 56% 55% 53% 54% 53% 61%Diagnosed (% total population) 22% 22% 23% 23% 22% 22%Male 43% 44% 45% 45% 45% 38%Female 57% 56% 55% 55% 55% 62%Total adult population: 49,809,000Medication usageAge Group% of sufferers Total 18-34 35-44 45-54 55-64 65 +Prescription only 39% 32% 33% 39% 45% 53%OTC only* 30% 31% 37% 32% 29% 21%Prescription <strong>and</strong> OTC 17% 18% 18% 18% 14% 14%No product 14% 18% 12% 10% 12% 12%*Including over-the-counter <strong>and</strong> herbal products.AttitudesJJ35% of sufferers prefer to treat themselves with an over-the-counter medication than to depend on a doctor togive them a prescription medication.JJ57% of sufferers are willing to make any lifestyle changes necessary to avoid having to take a prescriptionmedication.Respiratory Conditionswww.<strong>Kantar</strong><strong>Health</strong>.com
National <strong>Health</strong> <strong>and</strong> <strong>Wellness</strong> Survey | United Kingdom | Respiratory Conditions 294LifestyleAge Group% of sufferers Total 18-34 35-44 45-54 55-64 65 +Exercise* 58% 71% 65% 53% 47% 42%Smoke 20% 22% 22% 21% 18% 13%Drink alcohol 82% 82% 83% 83% 82% 81%Obese (BMI ≥ 30) 25% 16% 25% 31% 29% 29%*At least one day per month of vigorous exercise lasting 20 minutes or more.Quality of life6050403048.045.151.7 50.847.742.6 43.7 44.7 44.646.542.349.620100Total Population Age 18-34 Age 35-44 Age 45-54 Age 55-64 Age 65 +Physical summary scoreMental summary scoreWork productivity <strong>and</strong> activity impairmentAge GroupTotal 18-34 35-44 45-54 55-64 65 +Work Productivity Loss: % overallwork impairment due to health(Base: Employed Full-time)22.2 24.4 20.2 21.2 21.0 15.7Activity Impairment: % activity impairmentdue to health30.3 26.5 26.0 31.5 34.9 36.1Sufferers are self-reported.Respiratory Conditionswww.<strong>Kantar</strong><strong>Health</strong>.com
National <strong>Health</strong> <strong>and</strong> <strong>Wellness</strong> Survey | United Kingdom | Urologic Conditions 295Urologic ConditionsUrologic conditions include the adult population suffering from Benign Prostatic Hyperplasia (BPH), ErectileDysfunction, Overactive Bladder (OAB), Premature Ejaculation, Stress Urinary Incontinence (SUI) <strong>and</strong> Urinary TractInfection.% of adult population with Urologic conditions in the United KingdomAge GroupTotal 18-34 35-44 45-54 55-64 65 +Self-<strong>Report</strong>ed (% total population) 31% 29% 24% 28% 36% 40%Male 67% 67% 71% 64% 70% 65%Female 33% 33% 29% 36% 30% 35%Diagnosed (% total population) 11% 7% 6% 9% 14% 20%Male 51% 34% 41% 45% 60% 59%Female 49% 66% 59% 55% 40% 41%Total adult population: 49,809,000Medication usageAge Group% of sufferers Total 18-34 35-44 45-54 55-64 65 +Prescription only 15% 6% 9% 14% 20% 25%OTC only* 2% 2% 3% 2% 2% 2%Prescription <strong>and</strong> OTC 2% 4% 2% 1% 1% 1%No product 81% 88% 86% 83% 77% 72%*Including over-the-counter <strong>and</strong> herbal products.AttitudesJJ30% of sufferers prefer to treat themselves with an over-the-counter medication than to depend on a doctor togive them a prescription medication.JJ54% of sufferers are willing to make any lifestyle changes necessary to avoid having to take a prescriptionmedication.Urologic Conditionswww.<strong>Kantar</strong><strong>Health</strong>.com
National <strong>Health</strong> <strong>and</strong> <strong>Wellness</strong> Survey | United Kingdom | Urologic Conditions 296LifestyleAge Group% of sufferers Total 18-34 35-44 45-54 55-64 65 +Exercise* 55% 71% 62% 50% 44% 45%Smoke 22% 29% 30% 27% 21% 10%Drink alcohol 83% 82% 84% 82% 84% 82%Obese (BMI ≥ 30) 27% 16% 25% 35% 36% 30%*At least one day per month of vigorous exercise lasting 20 minutes or more.Quality of life6050403046.444.149.4 48.839.545.9 44.3 45.943.941.5 41.650.020100Total Population Age 18-34 Age 35-44 Age 45-54 Age 55-64 Age 65 +Physical summary scoreMental summary scoreWork productivity <strong>and</strong> activity impairmentAge GroupTotal 18-34 35-44 45-54 55-64 65 +Work Productivity Loss: % overallwork impairment due to health(Base: Employed Full-time)29.3 35.8 29.0 23.1 21.9 12.7Activity Impairment: % activity impairmentdue to health35.0 34.4 34.9 37.1 35.3 34.2Sufferers are self-reported.Urologic Conditionswww.<strong>Kantar</strong><strong>Health</strong>.com
United Stateswww.<strong>Kantar</strong><strong>Health</strong>.com
National <strong>Health</strong> <strong>and</strong> <strong>Wellness</strong> Survey | United States 298Population profileJJThe US population growth is one of the highest inthe industrialized world, increasing by about 1%annually. The majority of this is due to immigrationrather than births.JJHispanics make up 16% of the adult population <strong>and</strong>are now the largest minority group in the US.JJOne-third of the total adult population is obese. Itis estimated that almost 10% of all US adults havetype 2 diabetes.Life expectancy <strong>and</strong> causes of deathJJLife expectancy continues to steadily improve,reaching a high of 78.7 years as of 2012. Thoughgaps still exist between male <strong>and</strong> female theycontinue to narrow. Women are expected to live 5.0years longer than men.JJCardiovascular disease is the leading cause ofdeath in the US, accounting for 31% of deathsannually. It is followed closely by cancer, whichaccounts for 23% of deaths.<strong>Health</strong>care systemJJState health insurance exchanges, one of theprimary features of the Affordable Care Act, becameoperational in 2014. Despite challenges during theopen enrollment period, approximately 8 millionpeople enrolled in a health insurance exchangeplan; 58% of them were previously uninsured.JJInsurance companies can no longer deny coveragefor pre-existing conditions or place upper limits onthe benefits a member can receive.JJWhile subsidies to buy health insurance areprovided to lower- <strong>and</strong> middle-income individuals,many are still left struggling to afford their premiums,deductibles <strong>and</strong> co-pays or co-insuranceReimbursement policiesJJWhile healthcare providers are still paid primarilyon a negotiated fee for the services delivered, lessa co-pay or percent that they patient is responsiblefor, both the government <strong>and</strong> private insurers areexperimenting with different approaches that pay forthe value of care delivered.JJA new care delivery model known as AccountableCare Organizations (ACOs) are becomingincreasingly numerous <strong>and</strong> prominent. Thesemodels encourage better integration care amongproviders (hospitals <strong>and</strong> physicians in particular)while shifting the burden of cost management to theproviders as well.United Stateswww.<strong>Kantar</strong><strong>Health</strong>.com
National <strong>Health</strong> <strong>and</strong> <strong>Wellness</strong> Survey | United States 299General statisticsJJGross national income per capita (Intl $ 1 , 2009): 52,610JJLife expectancy at birth male/female (years): 76/81JJTotal expenditure on health per capita (Intl $, 2006): 8,895JJTotal expenditure on health as % of GDP (2006): 17.9%JJInternet penetration: Total population: 84.2%Lifestyle statistics 3JJTotal % of adult population that:19.1%31.5%65.7% 64.7%Smokes Exercises 2 Drinks Alcohol Is Obese (BMI ≥ 30)DemographicsJJTotal population: 318,000,000JJArea size: 9,631,420 km 2JJDoctors (per 10,000 population): 24.2JJHospital beds (per 10,000 population): 29Rank City % Population1 New York City 2.6%2 Los Angeles 1.2%3 Chicago 0.9%23154 Houston 0.7%5 Philadelphia 0.5%41The international $ is a currency unit that is calculated using purchasing power parities (PPP), which are rates ofcurrency conversion constructed to account for differences in price level between countries.2At least one day per month of vigorous exercise lasting 20 minutes or more.3Adult population: 233,806,000United Stateswww.<strong>Kantar</strong><strong>Health</strong>.com
National <strong>Health</strong> <strong>and</strong> <strong>Wellness</strong> Survey | United States | Autoimmune Conditions 300Autoimmune ConditionsAutoimmune conditions include the adult population suffering from Ankylosing Spondylitis, Connective TissueDisease, Idiopathic Thrombocytopenia Purpura (ITP), Inflammatory Bowel Disease (Crohn’s Disease or UlcerativeColitis), Lupus, Psoriasis, Psoriatic Arthritis, Rheumatoid Arthritis <strong>and</strong> Sjögren’s Syndrome.% of adult population with Autoimmune conditions in the United StatesAge GroupTotal 18-34 35-44 45-54 55-64 65 +Self-<strong>Report</strong>ed (% total population) 7% 4% 6% 8% 9% 9%Male 44% 49% 46% 48% 43% 36%Female 56% 51% 54% 52% 57% 64%Diagnosed (% total population) 7% 4% 6% 8% 9% 9%Male 43% 47% 44% 46% 43% 36%Female 57% 53% 56% 54% 57% 64%Total adult population: 233,806,000Medication usageAge Group% of sufferers Total 18-34 35-44 45-54 55-64 65 +Prescription only 38% 36% 35% 41% 39% 39%OTC only* 18% 20% 18% 18% 20% 16%Prescription <strong>and</strong> OTC 16% 15% 17% 16% 17% 17%No product 27% 29% 30% 24% 25% 28%*Including over-the-counter <strong>and</strong> herbal products.AttitudesJJ28% of sufferers prefer to treat themselves with an over-the-counter medication than to depend on a doctor togive them a prescription medication.JJ57% of sufferers are willing to make any lifestyle changes necessary to avoid having to take a prescriptionmedication.Autoimmune Conditionswww.<strong>Kantar</strong><strong>Health</strong>.com
National <strong>Health</strong> <strong>and</strong> <strong>Wellness</strong> Survey | United States | Autoimmune Conditions 301LifestyleAge Group% of sufferers Total 18-34 35-44 45-54 55-64 65 +Exercise* 59% 78% 67% 57% 53% 45%Smoke 24% 30% 26% 32% 21% 11%Drink alcohol 64% 76% 69% 64% 57% 57%Obese (BMI ≥ 30) 39% 28% 37% 45% 45% 39%*At least one day per month of vigorous exercise lasting 20 minutes or more.Quality of life6050403043.045.247.440.745.242.9 42.6 43.146.440.7 40.551.120100Total Population Age 18-34 Age 35-44 Age 45-54 Age 55-64 Age 65 +Physical summary scoreMental summary scoreWork productivity <strong>and</strong> activity impairmentAge GroupTotal 18-34 35-44 45-54 55-64 65 +Work Productivity Loss: % overallwork impairment due to health(Base: Employed Full-time)28.9 38.0 30.4 24.3 21.2 19.0Activity Impairment: % activity impairmentdue to health41.2 37.5 39.0 43.5 45.2 39.7Sufferers are self-reported.Autoimmune Conditionswww.<strong>Kantar</strong><strong>Health</strong>.com
National <strong>Health</strong> <strong>and</strong> <strong>Wellness</strong> Survey | United States | Cancer Conditions 302Cancer ConditionsCancer conditions include the adult population suffering from Breast Cancer, Cervical Cancer, Colorectal Cancer,Leukemia, Lymphoma, Metastatic Solid Tumor, Non-Small Cell Lung Cancer, Prostate Cancer, Small-Cell LungCancer, Uterine Cancer <strong>and</strong> Other Cancer.% of adult population with Cancer conditions in the United StatesAge GroupTotal 18-34 35-44 45-54 55-64 65 +Self-<strong>Report</strong>ed (% total population) 8% 2% 3% 5% 11% 23%Male 43% 44% 30% 29% 42% 48%Female 57% 56% 70% 71% 58% 52%Diagnosed (% total population) 8% 2% 3% 5% 10% 23%Male 43% 44% 30% 28% 41% 48%Female 57% 56% 70% 72% 59% 52%Total adult population: 233,806,000Medication usageAge Group% of sufferers Total 18-34 35-44 45-54 55-64 65 +Using prescription 15% 26% 18% 15% 14% 14%Not using prescription 85% 74% 82% 85% 86% 86%*Over-the-counter usage was not captured for Cancer.AttitudesJJ23% of sufferers prefer to treat themselves with an over-the-counter medication than to depend on a doctor togive them a prescription medication.JJ52% of sufferers are willing to make any lifestyle changes necessary to avoid having to take a prescriptionmedication.Cancer Conditionswww.<strong>Kantar</strong><strong>Health</strong>.com
National <strong>Health</strong> <strong>and</strong> <strong>Wellness</strong> Survey | United States | Cancer Conditions 303LifestyleAge Group% of sufferers Total 18-34 35-44 45-54 55-64 65 +Exercise* 57% 80% 67% 62% 58% 51%Smoke 16% 40% 26% 25% 17% 9%Drink alcohol 64% 83% 75% 66% 63% 60%Obese (BMI ≥ 30) 33% 22% 30% 35% 38% 33%*At least one day per month of vigorous exercise lasting 20 minutes or more.Quality of life60504030201050.245.6 46.9 47.7 49.346.3 46.644.245.5 45.140.453.40Total Population Age 18-34 Age 35-44 Age 45-54 Age 55-64 Age 65 +Physical summary scoreMental summary scoreWork productivity <strong>and</strong> activity impairmentAge GroupTotal 18-34 35-44 45-54 55-64 65 +Work Productivity Loss: % overallwork impairment due to health(Base: Employed Full-time)22.1 44.3 24.9 18.0 15.6 10.7Activity Impairment: % activity impairmentdue to health30.9 39.9 33.6 32.3 31.2 29.0Sufferers are self-reported.Cancer Conditionswww.<strong>Kantar</strong><strong>Health</strong>.com
National <strong>Health</strong> <strong>and</strong> <strong>Wellness</strong> Survey | United States | Cardiovascular Conditions 304Cardiovascular ConditionsCardiovascular conditions include the adult population suffering from Angina Pectoris, Arrhythmia, Atherosclerosis,Atrial Fibrillation, Congestive Heart Failure (CHF), Deep Vein Thrombosis (DVT), Heart Attack, Heart Murmur,High Cholesterol, Hypertension, Left Ventricular Hypertrophy (LVH), Peripheral Arterial Disease (PAD), PeripheralVascular Disease (PVD), Pulmonary Embolism, Stroke or Mini-Stroke/Transient Ischemia <strong>and</strong> Unstable Angina.% of adult population with Cardiovascular conditions in the United StatesAge GroupTotal 18-34 35-44 45-54 55-64 65 +Self-<strong>Report</strong>ed (% total population) 45% 19% 33% 48% 64% 79%Male 50% 55% 54% 53% 50% 45%Female 50% 45% 46% 47% 50% 55%Diagnosed (% total population) 43% 16% 31% 46% 63% 78%Male 50% 55% 54% 53% 50% 45%Female 50% 45% 46% 47% 50% 55%Total adult population: 233,806,000Medication usageAge Group% of sufferers Total 18-34 35-44 45-54 55-64 65 +Prescription only 48% 23% 41% 50% 53% 55%OTC only* 6% 8% 9% 8% 7% 3%Prescription <strong>and</strong> OTC 24% 8% 13% 18% 27% 36%No product 22% 60% 37% 24% 13% 7%*Including over-the-counter <strong>and</strong> herbal products.AttitudesJJ27% of sufferers prefer to treat themselves with an over-the-counter medication than to depend on a doctor togive them a prescription medication.JJ56% of sufferers are willing to make any lifestyle changes necessary to avoid having to take a prescriptionmedication.Cardiovascular Conditionswww.<strong>Kantar</strong><strong>Health</strong>.com
National <strong>Health</strong> <strong>and</strong> <strong>Wellness</strong> Survey | United States | Cardiovascular Conditions 305LifestyleAge Group% of sufferers Total 18-34 35-44 45-54 55-64 65 +Exercise* 60% 76% 67% 61% 58% 52%Smoke 19% 26% 23% 24% 19% 10%Drink alcohol 63% 73% 69% 65% 61% 56%Obese (BMI ≥ 30) 41% 34% 46% 46% 44% 36%*At least one day per month of vigorous exercise lasting 20 minutes or more.Quality of life6050403046.948.349.8 48.8 49.447.044.4 46.1 46.2 45.441.353.420100Total Population Age 18-34 Age 35-44 Age 45-54 Age 55-64 Age 65 +Physical summary scoreMental summary scoreWork productivity <strong>and</strong> activity impairmentAge GroupTotal 18-34 35-44 45-54 55-64 65 +Work Productivity Loss: % overallwork impairment due to health(Base: Employed Full-time)18.7 28.1 21.0 17.3 13.4 9.6Activity Impairment: % activity impairmentdue to health29.7 30.8 30.0 31.2 29.9 28.1Sufferers are self-reported.Cardiovascular Conditionswww.<strong>Kantar</strong><strong>Health</strong>.com
National <strong>Health</strong> <strong>and</strong> <strong>Wellness</strong> Survey | United States | Gastrointestinal Conditions 306Gastrointestinal ConditionsGastrointestinal conditions include the adult population suffering from Chronic Constipation, Diarrhea, Diverticulitis,Gastroesophageal Reflux Disease (GERD), Heartburn <strong>and</strong> Irritable Bowel Syndrome (IBS).% of adult population with Gastrointestinal conditions in the United StatesAge GroupTotal 18-34 35-44 45-54 55-64 65 +Self-<strong>Report</strong>ed (% total population) 35% 34% 35% 38% 37% 34%Male 46% 48% 50% 48% 44% 38%Female 54% 52% 50% 52% 56% 62%Diagnosed (% total population) 21% 16% 19% 23% 25% 26%Male 42% 44% 45% 44% 41% 36%Female 58% 56% 55% 56% 59% 64%Total adult population: 233,806,000Medication usageAge Group% of sufferers Total 18-34 35-44 45-54 55-64 65 +Prescription only 19% 13% 15% 20% 23% 27%OTC only* 40% 37% 45% 42% 42% 37%Prescription <strong>and</strong> OTC 12% 8% 11% 13% 15% 19%No product 29% 43% 30% 25% 19% 18%*Including over-the-counter <strong>and</strong> herbal products.AttitudesJJ37% of sufferers prefer to treat themselves with an over-the-counter medication than to depend on a doctor togive them a prescription medication.JJ58% of sufferers are willing to make any lifestyle changes necessary to avoid having to take a prescriptionmedication.Gastrointestinal Conditionswww.<strong>Kantar</strong><strong>Health</strong>.com
National <strong>Health</strong> <strong>and</strong> <strong>Wellness</strong> Survey | United States | Gastrointestinal Conditions 307LifestyleAge Group% of sufferers Total 18-34 35-44 45-54 55-64 65 +Exercise* 63% 76% 66% 59% 55% 49%Smoke 23% 25% 25% 28% 21% 11%Drink alcohol 67% 73% 71% 67% 61% 58%Obese (BMI ≥ 30) 38% 32% 41% 42% 44% 36%*At least one day per month of vigorous exercise lasting 20 minutes or more.Quality of life60504047.745.951.349.446.842.7 44.4 45.347.744.9 43.751.73020100Total Population Age 18-34 Age 35-44 Age 45-54 Age 55-64 Age 65 +Physical summary scoreMental summary scoreWork productivity <strong>and</strong> activity impairmentAge GroupTotal 18-34 35-44 45-54 55-64 65 +Work Productivity Loss: % overallwork impairment due to health(Base: Employed Full-time)19.5 22.2 19.6 18.3 16.6 12.8Activity Impairment: % activity impairmentdue to health30.2 26.2 28.3 32.3 33.7 32.5Sufferers are self-reported.Gastrointestinal Conditionswww.<strong>Kantar</strong><strong>Health</strong>.com
National <strong>Health</strong> <strong>and</strong> <strong>Wellness</strong> Survey | United States | Infectious Diseases 308Infectious DiseasesInfectious Diseases include the adult population suffering from AIDS, C. Difficile, Community-Acquired Pneumonia(CAP), Genital Herpes, Genital Warts, Hospital-Acquired Pneumonia (HAP), Hepatitis A, Hepatitis B, Hepatitis C,HIV, Tuberculosis <strong>and</strong> Yeast Infection.% of adult population with Infectious Diseases in the United StatesAge GroupTotal 18-34 35-44 45-54 55-64 65 +Self-<strong>Report</strong>ed (% total population) 9% 9% 10% 10% 10% 7%Male 33% 23% 30% 38% 43% 37%Female 67% 77% 70% 62% 57% 63%Diagnosed (% total population) 8% 7% 8% 9% 9% 6%Male 35% 24% 33% 41% 44% 38%Female 65% 76% 67% 59% 56% 62%Total adult population: 233,806,000Medication usageAge Group% of sufferers Total 18-34 35-44 45-54 55-64 65 +Using prescription 25% 25% 26% 30% 23% 20%Not using prescription 75% 75% 74% 70% 77% 80%*Over-the-counter usage was not captured for Infectious Diseases.AttitudesJJ34% of sufferers prefer to treat themselves with an over-the-counter medication than to depend on a doctor togive them a prescription medication.JJ58% of sufferers are willing to make any lifestyle changes necessary to avoid having to take a prescriptionmedication.Infectious Diseaseswww.<strong>Kantar</strong><strong>Health</strong>.com
National <strong>Health</strong> <strong>and</strong> <strong>Wellness</strong> Survey | United States | Infectious Diseases 309LifestyleAge Group% of sufferers Total 18-34 35-44 45-54 55-64 65 +Exercise* 63% 75% 66% 61% 54% 50%Smoke 26% 26% 28% 32% 27% 11%Drink alcohol 67% 76% 70% 65% 59% 53%Obese (BMI ≥ 30) 35% 27% 36% 40% 41% 40%*At least one day per month of vigorous exercise lasting 20 minutes or more.Quality of life6050403047.044.750.3 49.341.743.845.7 44.0 44.146.342.451.620100Total Population Age 18-34 Age 35-44 Age 45-54 Age 55-64 Age 65 +Physical summary scoreMental summary scoreWork productivity <strong>and</strong> activity impairmentAge GroupTotal 18-34 35-44 45-54 55-64 65 +Work Productivity Loss: % overallwork impairment due to health(Base: Employed Full-time)23.2 28.8 21.5 20.5 17.2 15.3Activity Impairment: % activity impairmentdue to health33.4 30.1 29.8 36.2 38.0 35.6Sufferers are self-reported.Infectious Diseaseswww.<strong>Kantar</strong><strong>Health</strong>.com
National <strong>Health</strong> <strong>and</strong> <strong>Wellness</strong> Survey | United States | Metabolic Conditions 310Metabolic ConditionsMetabolic conditions include the adult population suffering from High Cholesterol, Hypertension, Obesity, ThyroidCondition, Type 1 Diabetes <strong>and</strong> Type 2 Diabetes.% of adult population with Metabolic conditions in the United StatesAge GroupTotal 18-34 35-44 45-54 55-64 65 +Self-<strong>Report</strong>ed (% total population) 57% 34% 50% 62% 73% 83%Male 48% 48% 51% 51% 49% 45%Female 52% 52% 49% 49% 51% 55%Diagnosed (% total population) 43% 15% 32% 48% 65% 79%Male 49% 52% 51% 52% 49% 44%Female 51% 48% 49% 48% 51% 56%Total adult population: 233,806,000Medication usageAge Group% of sufferers Total 18-34 35-44 45-54 55-64 65 +Prescription only 42% 18% 33% 44% 51% 55%OTC only* 4% 4% 5% 5% 5% 3%Prescription <strong>and</strong> OTC 19% 4% 9% 15% 24% 34%No product 35% 74% 52% 36% 20% 9%*Including over-the-counter <strong>and</strong> herbal products.AttitudesJJ30% of sufferers prefer to treat themselves with an over-the-counter medication than to depend on a doctor togive them a prescription medication.JJ56% of sufferers are willing to make any lifestyle changes necessary to avoid having to take a prescriptionmedication.Metabolic Conditionswww.<strong>Kantar</strong><strong>Health</strong>.com
National <strong>Health</strong> <strong>and</strong> <strong>Wellness</strong> Survey | United States | Metabolic Conditions 311LifestyleAge Group% of sufferers Total 18-34 35-44 45-54 55-64 65 +Exercise* 61% 74% 65% 61% 57% 52%Smoke 18% 21% 20% 23% 19% 10%Drink alcohol 63% 70% 67% 64% 61% 56%Obese (BMI ≥ 30) 55% 70% 65% 58% 51% 40%*At least one day per month of vigorous exercise lasting 20 minutes or more.Quality of life60504047.848.350.6 49.843.047.849.745.4 46.9 46.6 45.653.53020100Total Population Age 18-34 Age 35-44 Age 45-54 Age 55-64 Age 65 +Physical summary scoreMental summary scoreWork productivity <strong>and</strong> activity impairmentAge GroupTotal 18-34 35-44 45-54 55-64 65 +Work Productivity Loss: % overallwork impairment due to health(Base: Employed Full-time)17.3 23.3 18.7 15.9 13.1 8.9Activity Impairment: % activity impairmentdue to health27.6 26.4 26.5 28.6 28.6 27.5Sufferers are self-reported.Metabolic Conditionswww.<strong>Kantar</strong><strong>Health</strong>.com
National <strong>Health</strong> <strong>and</strong> <strong>Wellness</strong> Survey | United States | Musculoskeletal Conditions 312Musculoskeletal ConditionsMusculoskeletal conditions include the adult population suffering from Gout, Muscular Dystrophy, Osteoarthritis,Osteopenia, Osteoporosis <strong>and</strong> Paget’s Disease.% of adult population with Musculoskeletal conditions in the United StatesAge GroupTotal 18-34 35-44 45-54 55-64 65 +Self-<strong>Report</strong>ed (% total population) 20% 4% 9% 18% 33% 48%Male 39% 54% 52% 44% 38% 32%Female 61% 46% 48% 56% 62% 68%Diagnosed (% total population) 19% 3% 8% 16% 32% 47%Male 38% 53% 49% 43% 38% 32%Female 62% 47% 51% 57% 62% 68%Total adult population: 233,806,000Medication usageAge Group% of sufferers Total 18-34 35-44 45-54 55-64 65 +Prescription only 21% 19% 23% 28% 22% 18%OTC only* 40% 33% 37% 35% 41% 42%Prescription <strong>and</strong> OTC 20% 16% 13% 15% 20% 24%No product 19% 33% 27% 23% 17% 16%*Including over-the-counter <strong>and</strong> herbal products.AttitudesJJ25% of sufferers prefer to treat themselves with an over-the-counter medication than to depend on a doctor togive them a prescription medication.JJ55% of sufferers are willing to make any lifestyle changes necessary to avoid having to take a prescriptionmedication.Musculoskeletal Conditionswww.<strong>Kantar</strong><strong>Health</strong>.com
National <strong>Health</strong> <strong>and</strong> <strong>Wellness</strong> Survey | United States | Musculoskeletal Conditions 313LifestyleAge Group% of sufferers Total 18-34 35-44 45-54 55-64 65 +Exercise* 55% 74% 61% 58% 57% 50%Smoke 18% 32% 27% 28% 20% 10%Drink alcohol 61% 74% 69% 64% 60% 56%Obese (BMI ≥ 30) 41% 35% 47% 49% 44% 37%*At least one day per month of vigorous exercise lasting 20 minutes or more.Quality of life6050403049.043.5 45.2 44.741.548.743.6 42.544.7 43.6 43.452.820100Total Population Age 18-34 Age 35-44 Age 45-54 Age 55-64 Age 65 +Physical summary scoreMental summary scoreWork productivity <strong>and</strong> activity impairmentAge GroupTotal 18-34 35-44 45-54 55-64 65 +Work Productivity Loss: % overallwork impairment due to health(Base: Employed Full-time)23.2 42.6 28.9 22.7 16.8 13.4Activity Impairment: % activity impairmentdue to health36.3 41.8 40.6 42.5 36.1 32.6Sufferers are self-reported.Musculoskeletal Conditionswww.<strong>Kantar</strong><strong>Health</strong>.com
National <strong>Health</strong> <strong>and</strong> <strong>Wellness</strong> Survey | United States | Neurological Conditions 314Neurological ConditionsNeurological conditions include the adult population suffering from Epilepsy, Hemiplegia, Migraine, MultipleSclerosis, Parkinson’s Disease <strong>and</strong> Restless Legs Syndrome (RLS).% of adult population with Neurological conditions in the United StatesAge GroupTotal 18-34 35-44 45-54 55-64 65 +Self-<strong>Report</strong>ed (% total population) 18% 22% 21% 19% 15% 11%Male 36% 37% 36% 34% 37% 36%Female 64% 63% 64% 66% 63% 64%Diagnosed (% total population) 12% 13% 15% 14% 12% 8%Male 33% 33% 32% 32% 36% 36%Female 67% 67% 68% 68% 64% 64%Total adult population: 233,806,000Medication usageAge Group% of sufferers Total 18-34 35-44 45-54 55-64 65 +Prescription only 25% 16% 24% 29% 35% 36%OTC only* 35% 44% 37% 32% 24% 16%Prescription <strong>and</strong> OTC 11% 12% 12% 11% 10% 7%No product 29% 28% 27% 28% 31% 42%*Including over-the-counter <strong>and</strong> herbal products.AttitudesJJ38% of sufferers prefer to treat themselves with an over-the-counter medication than to depend on a doctor togive them a prescription medication.JJ58% of sufferers are willing to make any lifestyle changes necessary to avoid having to take a prescriptionmedication.Neurological Conditionswww.<strong>Kantar</strong><strong>Health</strong>.com
National <strong>Health</strong> <strong>and</strong> <strong>Wellness</strong> Survey | United States | Neurological Conditions 315LifestyleAge Group% of sufferers Total 18-34 35-44 45-54 55-64 65 +Exercise* 63% 74% 64% 57% 54% 47%Smoke 24% 25% 25% 28% 22% 10%Drink alcohol 66% 73% 69% 63% 57% 49%Obese (BMI ≥ 30) 36% 28% 39% 41% 42% 40%*At least one day per month of vigorous exercise lasting 20 minutes or more.Quality of life6050403047.244.050.848.345.341.7 43.3 44.0 45.942.9 41.950.420100Total Population Age 18-34 Age 35-44 Age 45-54 Age 55-64 Age 65 +Physical summary scoreMental summary scoreWork productivity <strong>and</strong> activity impairmentAge GroupTotal 18-34 35-44 45-54 55-64 65 +Work Productivity Loss: % overallwork impairment due to health(Base: Employed Full-time)23.7 25.1 23.9 23.3 19.9 16.1Activity Impairment: % activity impairmentdue to health33.9 28.4 33.5 37.8 40.9 37.8Sufferers are self-reported.Neurological Conditionswww.<strong>Kantar</strong><strong>Health</strong>.com
National <strong>Health</strong> <strong>and</strong> <strong>Wellness</strong> Survey | United States | Ophthalmic Conditions 316Ophthalmic ConditionsOphthalmic conditions include the adult population suffering from Cataracts, Dry Eye, Glaucoma <strong>and</strong> MacularDegeneration.% of adult population with Ophthalmic conditions in the United StatesAge GroupTotal 18-34 35-44 45-54 55-64 65 +Self-<strong>Report</strong>ed (% total population) 16% 6% 7% 10% 19% 44%Male 40% 54% 43% 42% 37% 37%Female 60% 46% 57% 58% 63% 63%Diagnosed (% total population) 13% 3% 5% 8% 17% 42%Male 38% 51% 41% 40% 36% 37%Female 62% 49% 59% 60% 64% 63%Total adult population: 233,806,000Medication usageAge Group% of sufferers Total 18-34 35-44 45-54 55-64 65 +Prescription only 19% 16% 16% 20% 19% 20%OTC only* 28% 36% 41% 35% 32% 21%Prescription <strong>and</strong> OTC 8% 8% 6% 6% 8% 8%No product 45% 40% 37% 38% 42% 51%*Including over-the-counter <strong>and</strong> herbal products.AttitudesJJ26% of sufferers prefer to treat themselves with an over-the-counter medication than to depend on a doctor togive them a prescription medication.JJ55% of sufferers are willing to make any lifestyle changes necessary to avoid having to take a prescriptionmedication.Ophthalmic Conditionswww.<strong>Kantar</strong><strong>Health</strong>.com
National <strong>Health</strong> <strong>and</strong> <strong>Wellness</strong> Survey | United States | Ophthalmic Conditions 317LifestyleAge Group% of sufferers Total 18-34 35-44 45-54 55-64 65 +Exercise* 58% 81% 67% 60% 58% 51%Smoke 16% 26% 26% 24% 18% 9%Drink alcohol 61% 74% 72% 65% 58% 56%Obese (BMI ≥ 30) 35% 25% 36% 41% 42% 33%*At least one day per month of vigorous exercise lasting 20 minutes or more.Quality of life6050403045.548.949.7 47.941.048.045.543.2 44.7 44.8 44.453.220100Total Population Age 18-34 Age 35-44 Age 45-54 Age 55-64 Age 65 +Physical summary scoreMental summary scoreWork productivity <strong>and</strong> activity impairmentAge GroupTotal 18-34 35-44 45-54 55-64 65 +Work Productivity Loss: % overallwork impairment due to health(Base: Employed Full-time)22.1 31.7 24.5 19.7 17.4 10.7Activity Impairment: % activity impairmentdue to health31.9 31.4 32.8 35.5 34.7 29.9Sufferers are self-reported.Ophthalmic Conditionswww.<strong>Kantar</strong><strong>Health</strong>.com
National <strong>Health</strong> <strong>and</strong> <strong>Wellness</strong> Survey | United States | Pain Conditions 318Pain ConditionsPain conditions include the adult population suffering from Arthritis, Back Problems, Bladder Pain, Broken Bones,Cancer, Carpal Tunnel Syndrome, Dental Pain, Diabetic Neuropathic Pain, Fibromyalgia, Headache, HerpesZoster/Shingles, Hip/Pelvic Pain, Joint Pain, Lower Back Pain, Menstrual Cycle, Migraine, Neck Pain, NeuropathicPain, Phantom Limb Pain, Pinched Nerve in Lower Back, Plantar Fasciitis, Post-Herpetic Neuralgia, Shoulder Painor Stiffness, Spinal Disk, Sprains or Strains, Surgery or Other Medical Procedure, Tendonitis <strong>and</strong> Other Pain.% of adult population with Pain conditions in the United StatesAge GroupTotal 18-34 35-44 45-54 55-64 65 +Self-<strong>Report</strong>ed (% total population) 38% 32% 34% 41% 44% 44%Male 47% 49% 49% 47% 47% 41%Female 53% 51% 51% 53% 53% 59%Diagnosed (% total population) 29% 19% 24% 32% 37% 39%Male 44% 44% 47% 46% 46% 40%Female 56% 56% 53% 54% 54% 60%Total adult population: 233,806,000Medication usageAge Group% of sufferers Total 18-34 35-44 45-54 55-64 65 +Prescription only 19% 12% 18% 23% 23% 21%OTC only* 47% 52% 51% 46% 44% 39%Prescription <strong>and</strong> OTC 15% 10% 14% 15% 18% 17%No product 20% 26% 17% 15% 15% 23%*Including over-the-counter <strong>and</strong> herbal products.AttitudesJJ35% of sufferers prefer to treat themselves with an over-the-counter medication than to depend on a doctor togive them a prescription medication.JJ56% of sufferers are willing to make any lifestyle changes necessary to avoid having to take a prescriptionmedication.Pain Conditionswww.<strong>Kantar</strong><strong>Health</strong>.com
National <strong>Health</strong> <strong>and</strong> <strong>Wellness</strong> Survey | United States | Pain Conditions 319LifestyleAge Group% of sufferers Total 18-34 35-44 45-54 55-64 65 +Exercise* 60% 75% 64% 57% 53% 47%Smoke 23% 25% 26% 29% 23% 11%Drink alcohol 64% 71% 71% 65% 59% 55%Obese (BMI ≥ 30) 39% 28% 41% 43% 45% 40%*At least one day per month of vigorous exercise lasting 20 minutes or more.Quality of life60504045.546.550.047.347.843.0 44.1 44.5 45.442.8 41.952.23020100Total Population Age 18-34 Age 35-44 Age 45-54 Age 55-64 Age 65 +Physical summary scoreMental summary scoreWork productivity <strong>and</strong> activity impairmentAge GroupTotal 18-34 35-44 45-54 55-64 65 +Work Productivity Loss: % overallwork impairment due to health(Base: Employed Full-time)22.1 25.0 22.6 21.2 19.4 12.0Activity Impairment: % activity impairmentdue to health34.2 27.9 33.0 37.3 38.4 36.2Sufferers are self-reported.Pain Conditionswww.<strong>Kantar</strong><strong>Health</strong>.com
National <strong>Health</strong> <strong>and</strong> <strong>Wellness</strong> Survey | United States | Psychiatric Conditions 320Psychiatric ConditionsPsychiatric conditions include the adult population suffering from Anxiety, Attention Deficit/Hyperactivity Disorder(ADHD), Bipolar Disorder, Depression, Generalized Anxiety Disorder (GAD), Obsessive Compulsive Disorder(OCD), Phobias, Post Traumatic Stress Disorder (PTSD), Schizophrenia <strong>and</strong> Social Anxiety Disorder (SAD).% of adult population with Psychiatric conditions in the United StatesAge GroupTotal 18-34 35-44 45-54 55-64 65 +Self-<strong>Report</strong>ed (% total population) 32% 43% 35% 33% 28% 15%Male 44% 44% 45% 45% 42% 39%Female 56% 56% 55% 55% 58% 61%Diagnosed (% total population) 23% 26% 26% 26% 23% 13%Male 42% 42% 43% 43% 42% 37%Female 58% 58% 57% 57% 58% 63%Total adult population: 233,806,000Medication usageAge Group% of sufferers Total 18-34 35-44 45-54 55-64 65 +Prescription only 40% 27% 41% 50% 55% 59%OTC only* 9% 10% 10% 8% 6% 5%Prescription <strong>and</strong> OTC 5% 6% 5% 4% 6% 5%No product 46% 57% 44% 38% 33% 32%*Including over-the-counter <strong>and</strong> herbal products.AttitudesJJ38% of sufferers prefer to treat themselves with an over-the-counter medication than to depend on a doctor togive them a prescription medication.JJ57% of sufferers are willing to make any lifestyle changes necessary to avoid having to take a prescriptionmedication.Psychiatric Conditionswww.<strong>Kantar</strong><strong>Health</strong>.com
National <strong>Health</strong> <strong>and</strong> <strong>Wellness</strong> Survey | United States | Psychiatric Conditions 321LifestyleAge Group% of sufferers Total 18-34 35-44 45-54 55-64 65 +Exercise* 64% 76% 65% 58% 51% 44%Smoke 26% 26% 28% 31% 26% 13%Drink alcohol 68% 73% 70% 65% 60% 55%Obese (BMI ≥ 30) 36% 27% 39% 43% 45% 41%*At least one day per month of vigorous exercise lasting 20 minutes or more.Quality of life6050403048.652.149.646.544.140.542.439.8 40.0 40.2 41.344.320100Total Population Age 18-34 Age 35-44 Age 45-54 Age 55-64 Age 65 +Physical summary scoreMental summary scoreWork productivity <strong>and</strong> activity impairmentAge GroupTotal 18-34 35-44 45-54 55-64 65 +Work Productivity Loss: % overallwork impairment due to health(Base: Employed Full-time)24.7 25.7 24.9 23.9 22.0 27.1Activity Impairment: % activity impairmentdue to health34.3 27.9 33.7 38.6 42.5 42.5Sufferers are self-reported.Psychiatric Conditionswww.<strong>Kantar</strong><strong>Health</strong>.com
National <strong>Health</strong> <strong>and</strong> <strong>Wellness</strong> Survey | United States | Respiratory Conditions 322Respiratory ConditionsRespiratory conditions include the adult population suffering from Asthma, Chronic Bronchitis, Chronic ObstructivePulmonary Disease (COPD), Cystic Fibrosis, Emphysema, Hay Fever <strong>and</strong> Nasal Allergies.% of adult population with Respiratory conditions in the United StatesAge GroupTotal 18-34 35-44 45-54 55-64 65 +Self-<strong>Report</strong>ed (% total population) 31% 28% 30% 34% 35% 32%Male 42% 42% 42% 44% 43% 42%Female 58% 58% 58% 56% 57% 58%Diagnosed (% total population) 26% 22% 25% 29% 30% 29%Male 41% 41% 40% 42% 42% 41%Female 59% 59% 60% 58% 58% 59%Total adult population: 233,806,000Medication usageAge Group% of sufferers Total 18-34 35-44 45-54 55-64 65 +Prescription only 26% 23% 22% 23% 26% 36%OTC only* 39% 38% 44% 41% 40% 30%Prescription <strong>and</strong> OTC 19% 19% 17% 20% 19% 19%No product 17% 20% 17% 16% 15% 14%*Including over-the-counter <strong>and</strong> herbal products.AttitudesJJ36% of sufferers prefer to treat themselves with an over-the-counter medication than to depend on a doctor togive them a prescription medication.JJ59% of sufferers are willing to make any lifestyle changes necessary to avoid having to take a prescriptionmedication.Respiratory Conditionswww.<strong>Kantar</strong><strong>Health</strong>.com
National <strong>Health</strong> <strong>and</strong> <strong>Wellness</strong> Survey | United States | Respiratory Conditions 323LifestyleAge Group% of sufferers Total 18-34 35-44 45-54 55-64 65 +Exercise* 65% 77% 69% 63% 58% 51%Smoke 21% 22% 22% 25% 22% 12%Drink alcohol 66% 72% 71% 67% 59% 57%Obese (BMI ≥ 30) 36% 28% 37% 39% 42% 35%*At least one day per month of vigorous exercise lasting 20 minutes or more.Quality of life60504047.847.051.4 50.243.545.647.6 46.745.148.643.352.33020100Total Population Age 18-34 Age 35-44 Age 45-54 Age 55-64 Age 65 +Physical summary scoreMental summary scoreWork productivity <strong>and</strong> activity impairmentAge GroupTotal 18-34 35-44 45-54 55-64 65 +Work Productivity Loss: % overallwork impairment due to health(Base: Employed Full-time)18.2 21.8 18.0 17.0 15.0 11.0Activity Impairment: % activity impairmentdue to health29.0 25.0 25.8 29.7 32.5 33.6Sufferers are self-reported.Respiratory Conditionswww.<strong>Kantar</strong><strong>Health</strong>.com
National <strong>Health</strong> <strong>and</strong> <strong>Wellness</strong> Survey | United States | Urologic Conditions 324Urologic ConditionsUrologic conditions include the adult population suffering from Benign Prostatic Hyperplasia (BPH), ErectileDysfunction, Overactive Bladder (OAB), Premature Ejaculation, Stress Urinary Incontinence (SUI) <strong>and</strong> Urinary TractInfection.% of adult population with Urologic conditions in the United StatesAge GroupTotal 18-34 35-44 45-54 55-64 65 +Self-<strong>Report</strong>ed (% total population) 30% 23% 24% 28% 36% 47%Male 66% 67% 70% 65% 67% 63%Female 34% 33% 30% 35% 33% 37%Diagnosed (% total population) 14% 7% 8% 11% 18% 29%Male 50% 24% 41% 47% 60% 60%Female 50% 76% 59% 53% 40% 40%Total adult population: 233,806,000Medication usageAge Group% of sufferers Total 18-34 35-44 45-54 55-64 65 +Prescription only 18% 8% 11% 16% 23% 27%OTC only* 4% 4% 5% 5% 4% 3%Prescription <strong>and</strong> OTC 2% 3% 2% 1% 2% 3%No product 76% 86% 82% 78% 71% 67%*Including over-the-counter <strong>and</strong> herbal products.AttitudesJJ32% of sufferers prefer to treat themselves with an over-the-counter medication than to depend on a doctor togive them a prescription medication.JJ54% of sufferers are willing to make any lifestyle changes necessary to avoid having to take a prescriptionmedication.Urologic Conditionswww.<strong>Kantar</strong><strong>Health</strong>.com
National <strong>Health</strong> <strong>and</strong> <strong>Wellness</strong> Survey | United States | Urologic Conditions 325LifestyleAge Group% of sufferers Total 18-34 35-44 45-54 55-64 65 +Exercise* 61% 76% 68% 60% 56% 51%Smoke 22% 27% 26% 28% 22% 11%Drink alcohol 67% 75% 73% 67% 63% 60%Obese (BMI ≥ 30) 37% 25% 39% 45% 45% 37%*At least one day per month of vigorous exercise lasting 20 minutes or more.Quality of life6050403046.846.450.0 48.546.3 47.845.2 44.741.5 42.8 44.452.420100Total Population Age 18-34 Age 35-44 Age 45-54 Age 55-64 Age 65 +Physical summary scoreMental summary scoreWork productivity <strong>and</strong> activity impairmentAge GroupTotal 18-34 35-44 45-54 55-64 65 +Work Productivity Loss: % overallwork impairment due to health(Base: Employed Full-time)24.4 33.4 25.9 20.7 15.9 11.9Activity Impairment: % activity impairmentdue to health32.5 31.5 33.0 34.6 33.1 31.1Sufferers are self-reported.Urologic Conditionswww.<strong>Kantar</strong><strong>Health</strong>.com
Appendixwww.<strong>Kantar</strong><strong>Health</strong>.com
National <strong>Health</strong> <strong>and</strong> <strong>Wellness</strong> Survey | Appendix 327DefinitionsSF-36v2 Quality of Life ScaleThe SF-36v2 is a series of 36 validated questions that are scored to provide an index of respondents’ mentalhealth, physical health <strong>and</strong> overall quality of life. The individual components of the SF-36v2 scale include physicalfunctioning, role limitations due to physical health problems, bodily pain, general health, vitality, social functioning<strong>and</strong> role limitations due to emotional problems <strong>and</strong> mental health.In the National <strong>Health</strong> <strong>and</strong> <strong>Wellness</strong> Survey, SF-36v2 scores for analysis groups are compared to the generalpopulation <strong>and</strong> therapeutic category average to assess the physical <strong>and</strong> mental well-being of patients in eachgroup.Work Productivity <strong>and</strong> Impairment ScalesThe WPAI scale is a validated scale used to measure lost work productivity <strong>and</strong> impairment in daily activities. TheWPAI yields four types of scores:1. Absenteeism (work time missed)2. Presenteeism (impairment at work/reduced on-the-job effectiveness)3. Work productivity loss (overall work impairment/absenteeism plus presenteeism)4. Activity impairmentWPAI outcomes are expressed as impairment percentages, with higher numbers indicating greater impairment <strong>and</strong>less productivity.AttitudesRespondents to the National <strong>Health</strong> <strong>and</strong> <strong>Wellness</strong> Survey were asked to rate their attitudes on healthcare ingeneral, advertising campaigns <strong>and</strong> alternative care on a five-point scale (Strongly Disagree, Disagree, NeitherDisagree nor Agree, Agree, Strongly Agree). Patients were considered to express a particular attitude if they choseAgree or Strongly Agree.IRB Approval <strong>and</strong> Publication CitationThe National <strong>Health</strong> <strong>and</strong> <strong>Wellness</strong> Survey is Institutional Review Board (IRB) approved to adhere to the abstract<strong>and</strong> publication submission criteria of peer-reviewed journals <strong>and</strong> medical conferences. The following citationshould be used for publication submissions using the National <strong>Health</strong> <strong>and</strong> <strong>Wellness</strong> Survey.<strong>Kantar</strong> <strong>Health</strong>. Month/Year of data. National <strong>Health</strong> <strong>and</strong> <strong>Wellness</strong> Survey. Year of Survey [Country]. New York, NY.Appendixwww.<strong>Kantar</strong><strong>Health</strong>.com
National <strong>Health</strong> <strong>and</strong> <strong>Wellness</strong> Survey | Appendix 328SourcesJJJJJJJJJJJJJJJJJJJJJJJJJJJJJJJJJJJJEpi Database ® . <strong>Kantar</strong> <strong>Health</strong>. www.epidb.comEpidemiology, World <strong>Health</strong> Organization (WHO). www.who.int/topics/epidemiology/enEurope at a glance. www.europa-auf-einen-blick.deGov UK. www.gov.ukGuardian. www.theguardian.comHuman Development <strong>Report</strong>s. www.hdr.undp.orgNational <strong>Health</strong> Service (NHS). www.nhs.ukPrivate <strong>Health</strong>care UK. www.privatehealth.co.ukRussian Federation Federal State Statistics Service. www.gks.ruServiço Único de Saúde (SUS, Brazil Ministry of <strong>Health</strong>). www.ripsa.org.brThe European Observatory on <strong>Health</strong> Care Systems. www.euro.who.int/observatoryU.S. Census Bureau. www.census.govU.S. Department of <strong>Health</strong> <strong>and</strong> Human Services. www.hhs.gov/healthcare/World Atlas. www.worldatlas.comWorld Bank. data.worldbank.orgWorld <strong>Health</strong> Organization (WHO) Europe. www.euro.who.intWorld <strong>Health</strong> Organization (WHO) Western Pacific Region. www.wpro.who.intWorld <strong>Health</strong> Organization (WHO), World <strong>Health</strong> Statistics 2012. www.who.intAppendixwww.<strong>Kantar</strong><strong>Health</strong>.com
The <strong>Global</strong> <strong>Health</strong> <strong>and</strong> <strong>Wellness</strong> <strong>Report</strong>www.kantarhealth.com© 2014 <strong>Kantar</strong> <strong>Health</strong>