The Relationship Between pH, Phosphate, and Algae Levels in the ...
The Relationship Between pH, Phosphate, and Algae Levels in the ...
The Relationship Between pH, Phosphate, and Algae Levels in the ...
Create successful ePaper yourself
Turn your PDF publications into a flip-book with our unique Google optimized e-Paper software.
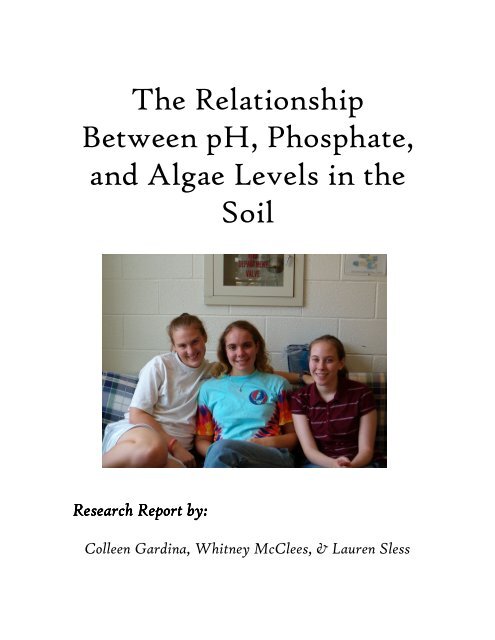
<strong>The</strong> <strong>Relationship</strong><strong>Between</strong> <strong>pH</strong>, <strong>Phosphate</strong>,<strong>and</strong> <strong>Algae</strong> <strong>Levels</strong> <strong>in</strong> <strong>the</strong>SoilResearch Report by:Colleen Gard<strong>in</strong>a, Whitney McClees, & Lauren Sless
ABSTRACTAnomalies were noticed for soil algae <strong>and</strong> <strong>pH</strong> levels dur<strong>in</strong>g a soil biota survey <strong>in</strong><strong>the</strong> backwoods of Rol<strong>and</strong> Park Country School. Site 1 had unusually high levels of algaefor such a shady <strong>and</strong> dry area, while Site 4 had a much lower algae count, <strong>in</strong> spite ofadditional moisture <strong>and</strong> sunlight (ideal conditions for algae to thrive). It is known that<strong>pH</strong> levels <strong>in</strong> soil have an <strong>in</strong>verse relationship with phosphate levels <strong>in</strong> soil <strong>and</strong> thatphosphate is a key nutrient for algae. <strong>The</strong>refore, we hypo<strong>the</strong>sized that <strong>the</strong> unusually highlevels of algae <strong>in</strong> site 1 are due to <strong>the</strong> low <strong>pH</strong> values <strong>in</strong> that site <strong>and</strong> <strong>the</strong> correspond<strong>in</strong>ghigh phosphorous levels. We tested soil samples for algae, <strong>pH</strong> <strong>and</strong> phosphate <strong>in</strong> 12different spots <strong>in</strong> both sites. We failed to observe <strong>the</strong> expected relationship between <strong>pH</strong><strong>and</strong> phosphate, but did observe <strong>the</strong> expected relationship between phosphate <strong>and</strong> algae.<strong>The</strong>refore, our hypo<strong>the</strong>sis was <strong>in</strong>correct <strong>and</strong> we decided that our next step for ourresearch was to test <strong>the</strong> water <strong>in</strong> <strong>the</strong> site because we now suspect runoff from <strong>the</strong>surround<strong>in</strong>g campus may be <strong>the</strong> source of <strong>the</strong> discrepancy between <strong>pH</strong> <strong>and</strong> phosphate.
INTRODUCTION<strong>Algae</strong>, specifically <strong>the</strong> terrestrial algae we studied <strong>in</strong> our <strong>in</strong>vestigation of <strong>the</strong>woodl<strong>and</strong>s on <strong>the</strong> Rol<strong>and</strong> Park Country School campus, are widely known to thrive <strong>in</strong>moist environments with a large amount of sunlight. In addition, algae especiallypopulate wet soils, such as silt <strong>and</strong> clay, <strong>and</strong> <strong>in</strong> shallow, freshwater areas (Dodge <strong>and</strong>Shubert, 1996). However, after perform<strong>in</strong>g a soil biota survey of <strong>the</strong> woodl<strong>and</strong>s, wefound that Site 1 (39.35794º N; 076.63977º W), <strong>the</strong> site with <strong>the</strong> driest <strong>and</strong> shadiestenvironment, conta<strong>in</strong>ed statistically significantly higher algae levels (2.5 / mm 2 ) than Site4 (39.35733º N; 076.63840º W), a flat, muddy area with very little tree cover, thatconta<strong>in</strong>ed 0.91 / mm 2 [p = 0.019] (ESSRE Microclimate Database, 2006).This anomaly puzzled us; <strong>the</strong>refore, we performed additional research <strong>in</strong> <strong>the</strong> literature<strong>in</strong> order to attempt to expla<strong>in</strong> why this natural relationship might be disrupted <strong>in</strong> <strong>the</strong>setwo sites. We discovered that, <strong>in</strong> addition to <strong>the</strong> amounts of water <strong>and</strong> sunlight <strong>in</strong> anecosystem, <strong>the</strong> <strong>pH</strong> <strong>and</strong> phosphate levels can both <strong>in</strong>directly <strong>and</strong> directly affect <strong>the</strong>quantity of algae <strong>in</strong> any environment as well. In fact, Jarvis (2005) states that ecosystemswith low, acidic <strong>pH</strong> levels have higher phosphate levels <strong>in</strong> <strong>the</strong> soil. <strong>The</strong>se higherphosphate levels can cause higher algae levels because phosphate is a nutrient that algaeneed to live <strong>and</strong> grow (Jarvis, 2005). <strong>Phosphate</strong> is a critical component of nucleic acids(Raven <strong>and</strong> Johnson, 1991), <strong>and</strong> <strong>the</strong>refore with higher phosphate concentrations, <strong>the</strong>algae will be able to reproduce more (Pote, 2003).When we returned to <strong>the</strong> results of our biota survey, we found that our dataactually corresponded with Jarvis’s (2005) assertion that <strong>pH</strong> could affect <strong>the</strong> size of analgae population. A lower <strong>pH</strong> should correspond to a significantly higher quantity ofalgae <strong>in</strong> <strong>the</strong> soil, <strong>and</strong>, <strong>in</strong> fact, Site 1, with <strong>the</strong> higher algae count, had an average <strong>pH</strong> levelof 5.7, whereas <strong>in</strong> Site 4, <strong>the</strong> <strong>pH</strong> level was 6.5 (ESSRE Microclimate Database, 2006).Given that <strong>the</strong> differences between both average algae levels <strong>and</strong> average <strong>pH</strong> levelsbetween <strong>the</strong> two sites were statistically significant (p = 0.019; p = 0.005, respectively),we decided that this difference <strong>in</strong> <strong>pH</strong> possibly expla<strong>in</strong>s <strong>the</strong> anomalous algae numbers <strong>in</strong>Site 1 because <strong>the</strong> lower <strong>pH</strong> may have made more phosphate available to <strong>the</strong> algae fornutritional purposes.<strong>The</strong>refore, we designed an experiment to test <strong>the</strong> hypo<strong>the</strong>sis that <strong>the</strong> lower <strong>pH</strong>level <strong>in</strong> <strong>the</strong> Site 1 ecosystem leads to <strong>the</strong> higher phosphate levels that could account for<strong>the</strong> higher algae levels <strong>in</strong> that site. In order to confirm our hypo<strong>the</strong>sis, we exam<strong>in</strong>ed Sites1 <strong>and</strong> 4 for algae, phosphate, <strong>and</strong> <strong>pH</strong> levels.
METHODS24 glass microscope slides were marked with a l<strong>in</strong>e 1.5 cm from one end. 24slides were <strong>the</strong>n taken outside to be cultured for algae. For three consecutive days, 3slides per day were <strong>in</strong>serted each day <strong>in</strong> each quadrat <strong>in</strong> site one (39.35794 o N;076.63977 o W) <strong>and</strong> site four (39.35733 o N; 076.63840 o W) <strong>in</strong> <strong>the</strong> woodl<strong>and</strong>s on <strong>the</strong>Rol<strong>and</strong> Park Country School campus. <strong>The</strong>y were <strong>in</strong>serted 6 cm <strong>in</strong> <strong>the</strong> ground, leav<strong>in</strong>g 1.5cm out of <strong>the</strong> ground, exposed to sunlight (Pipe <strong>and</strong> Cullimore, 1980). <strong>The</strong> slides wereallowed to sit for five consecutive days from <strong>the</strong>ir day of <strong>in</strong>sertion. After five days, eachday’s collection of slides was carefully removed from <strong>the</strong> soil, <strong>and</strong> excess soil wascleaned from <strong>the</strong> slides with distilled water. <strong>The</strong>n, a column of soil, 6 cm long by 2.3 cm<strong>in</strong> diameter, was removed from <strong>the</strong> exact spot where <strong>the</strong> slide was taken out of <strong>the</strong> groundus<strong>in</strong>g a soil core. <strong>The</strong>n, <strong>the</strong> algae were observed at a power of 40x us<strong>in</strong>g a compoundlight microscope. Five fields of view were observed <strong>and</strong> <strong>the</strong> algae was counted for eachfield of view. <strong>The</strong> five algae counts were averaged toge<strong>the</strong>r <strong>and</strong> <strong>the</strong> average was dividedby 17.3 mm 2 to determ<strong>in</strong>e <strong>the</strong> number of algae per mm 2 (ESSRE Soil Ecology Protocols,2003). Concurrently, <strong>pH</strong> <strong>and</strong> phosphate tests were performed on each correspond<strong>in</strong>g soilsample, us<strong>in</strong>g <strong>the</strong> LaMotte STH-14 Series soil test kit. <strong>The</strong> amount of phosphate wasmeasured <strong>in</strong> parts per million.
RESULTS<strong>pH</strong>Before Experiment: Average <strong>pH</strong> <strong>Levels</strong> for Site 1vs. Site 4<strong>pH</strong> Level76543210Site 1Site 4After Experiment: Average <strong>pH</strong> <strong>Levels</strong> for Site 1 vs.Site 4<strong>pH</strong> Level876543210Site 1Site 4In <strong>the</strong> two graphs pictured above, it is clear that <strong>the</strong> difference between <strong>the</strong> soil<strong>pH</strong> <strong>in</strong> Site 1 <strong>and</strong> Site 4 became more pronounced, with <strong>the</strong> <strong>pH</strong> <strong>in</strong> Site 1 decreas<strong>in</strong>g from5.7 to 5.6 <strong>and</strong> <strong>the</strong> <strong>pH</strong> <strong>in</strong> Site 4 <strong>in</strong>creas<strong>in</strong>g from 6.5 to 7.0. <strong>The</strong> p-values between <strong>the</strong>before <strong>and</strong> after graphs went from p = 0.005 to p = 0.00, respectively. This shows thatboth times <strong>the</strong> <strong>pH</strong> tests were performed on <strong>the</strong> soil <strong>in</strong> <strong>the</strong>se two sites, a significantdifference was found to exist between <strong>the</strong> two sites.
<strong>Phosphate</strong>Before Experiment: Ave. <strong>Phosphate</strong> <strong>Levels</strong> forSite 1 vs. Site 4<strong>Phosphate</strong> Level (ppm)6050403020100Site 1Site 4After Experiment: Average <strong>Phosphate</strong> <strong>Levels</strong> forSite 1 vs. Site 4<strong>Phosphate</strong> Level (ppm)100806040200Site 1Site 4<strong>Phosphate</strong> experienced a different change than <strong>pH</strong>. As can be seen <strong>in</strong> <strong>the</strong> twophosphate graphs above, <strong>the</strong> relationship between <strong>the</strong> phosphate levels <strong>in</strong> Site 1 <strong>and</strong> Site4 changed drastically. In <strong>the</strong> graph of <strong>the</strong> data taken before we performed our experiment,it is clear that <strong>the</strong> difference <strong>in</strong> phosphate levels <strong>in</strong> <strong>the</strong> soils of <strong>the</strong>se two sites was<strong>in</strong>significant (p = 0.85). However, <strong>in</strong> <strong>the</strong> graph illustrat<strong>in</strong>g our post-experiment f<strong>in</strong>d<strong>in</strong>gs,we can see that <strong>the</strong>re is now a considerable difference between <strong>the</strong> amount of phosphate<strong>in</strong> <strong>the</strong> soils of <strong>the</strong> two sites (<strong>the</strong> levels went from a difference of 2.5 ppm to a differenceof 35.35 ppm). <strong>The</strong>re is, <strong>in</strong> fact, now a significant difference between <strong>the</strong> two sites <strong>in</strong> thiscase, with a p-value of 0.01.
<strong>Algae</strong>Before Experiment: Average <strong>Algae</strong> <strong>Levels</strong> for Site1 vs. Site 4<strong>Algae</strong> Level (#/sq. mm)32.521.510.50-Site 1Site 4After Experiment: Average <strong>Algae</strong> <strong>Levels</strong> for Site 1vs. Site 4<strong>Algae</strong> Level (#/sq. mm)21.510.50Site 1Site 4As <strong>the</strong> last two graphs show, algae levels <strong>in</strong> <strong>the</strong> soils of <strong>the</strong> two sites changedsignificantly <strong>in</strong> a pattern that corresponds to <strong>the</strong> pattern of change <strong>in</strong> phosphate levels.<strong>Between</strong> <strong>the</strong> start <strong>and</strong> end of our experiment, a drastic change occurred <strong>in</strong> <strong>the</strong> algae levels<strong>in</strong> Site 1 <strong>and</strong> Site 4. In fact, where <strong>the</strong>re was once a statistically significantly lower levelof algae <strong>in</strong> Site 4 (p = 0.02), <strong>the</strong>re are now abundant amounts of algae <strong>in</strong> Site 4 (p =0.31).
DISCUSSIONOur f<strong>in</strong>d<strong>in</strong>gs contradict our hypo<strong>the</strong>sis. We predicted that <strong>the</strong> orig<strong>in</strong>al differences<strong>in</strong> <strong>pH</strong> <strong>in</strong> <strong>the</strong> soil between site 1 <strong>and</strong> site 4 would account for differences <strong>in</strong> <strong>the</strong> levels ofphosphate <strong>in</strong> <strong>the</strong> soil that would account for <strong>the</strong> observed difference <strong>in</strong> algae density.However, <strong>the</strong> soil <strong>pH</strong> <strong>in</strong> site 1 <strong>in</strong> fact became slightly more acidic (decreas<strong>in</strong>g from 5.7 to5.6), while <strong>the</strong> soil <strong>pH</strong> <strong>in</strong> site 4 became more basic (<strong>in</strong>creas<strong>in</strong>g from 6.5 to 7). This made<strong>the</strong> difference between <strong>the</strong> two sites even more significant because <strong>the</strong> p-values wentfrom 0.005 to 0.00. Meanwhile though, <strong>the</strong> amount of phosphate <strong>in</strong> <strong>the</strong> soil <strong>in</strong> site 1actually went down from 50.42 ppm to 40.9 ppm <strong>and</strong> <strong>the</strong>se changes <strong>in</strong> <strong>the</strong> amount ofphosphate actually <strong>in</strong>creased from 52.92 ppm to 76.25 ppm (p = 0.01). <strong>The</strong>refore, ourdata displayed <strong>the</strong> exact opposite of <strong>the</strong> known relationship between <strong>pH</strong> <strong>and</strong> phosphate <strong>in</strong>soils (Jarvis, 2005). In fact, we observed a direct l<strong>in</strong>ear correlation (r 2 = 24.686%) ra<strong>the</strong>rthan <strong>the</strong> usual <strong>in</strong>verse relationship.This presents <strong>the</strong> question of what is caus<strong>in</strong>g <strong>the</strong> abnormal relationship between<strong>pH</strong> <strong>and</strong> phosphate levels <strong>in</strong> <strong>the</strong> soil at site 1 <strong>and</strong> site 4, especially because <strong>the</strong> expectedrelationship between phosphate <strong>and</strong> algae was observed (r 2 =38.472). A possibleexplanation for <strong>the</strong> unusual <strong>and</strong> unexpected disturbance of <strong>the</strong> relationship between <strong>pH</strong><strong>and</strong> phosphate could be <strong>the</strong> fact that on <strong>the</strong> days immediately preced<strong>in</strong>g our collect<strong>in</strong>g ofdata, a very heavy ra<strong>in</strong>storm had occurred. Accord<strong>in</strong>g to Busman et al (2002), <strong>the</strong>freshwater stream runn<strong>in</strong>g through site 4 could have been flooded with excess phosphatefrom <strong>the</strong> hill located near site 4 that is heavily fertilized. This excess phosphate couldaccount for <strong>the</strong> sudden <strong>in</strong>crease <strong>in</strong> algae <strong>in</strong> site 4, while <strong>the</strong> excess water could accountfor <strong>the</strong> <strong>in</strong>crease <strong>in</strong> <strong>pH</strong>. For fur<strong>the</strong>r research, we could test phosphate levels <strong>in</strong> <strong>the</strong> streamto see if <strong>the</strong> stream is flooded with phosphate.
BibliographyBusman, L., Lamb, J., R<strong>and</strong>all, G., Rehm, G., <strong>and</strong> Schmitt, M. (2002) <strong>The</strong> Nature ofPhosphorus <strong>in</strong> Soils. Available Onl<strong>in</strong>ehttp://www.extension.umn.edu/distribution/cropsystems/DC6795.html.Dodge, J. <strong>and</strong> Shubert, L. (1996) <strong>Algae</strong>. Methods for <strong>the</strong> Exam<strong>in</strong>ation of OrganismalDiversity <strong>in</strong> Soils <strong>and</strong> Sediments. Pg. 67-78.ESSRE (2006) Microclimate Databases. Available Onl<strong>in</strong>ehttps://faculty.rpcs.org/brockda/ESSRE%20Microclimate%20Survey.htm.ESSRE (2003) Soil Ecology Protocols. Available Onl<strong>in</strong>ehttps://faculty.rpcs.org/brockda/ESSRE%20Protocols.htm.Jarvis, B. (2005) Phosphorus Effect on <strong>pH</strong>. Available Onl<strong>in</strong>ehttp://www.ra<strong>in</strong>gardens.com/forum/<strong>in</strong>dex.cgi?noframes;read=10167.Pipe, A.E. <strong>and</strong> Cullimore, D.R. (1980) An implanted slide technique for exam<strong>in</strong><strong>in</strong>g <strong>the</strong>effects of <strong>the</strong> herbicide Diuron on soil algae. Bullet<strong>in</strong> of EnvironmentalContam<strong>in</strong>ation <strong>and</strong> Toxicology 24, 306-312.Pote, D. (2003) Does Initial Soil P Level Affect Water-Extractable Soil P Response toApplied P? Available Onl<strong>in</strong>ehttp://www.ars.usda.gov/research/publications/publications.htm?SEQ_NO_115=129563.Raven, P. <strong>and</strong> Johnson, G. (1991) Underst<strong>and</strong><strong>in</strong>g Biology Second Edition. pg. 58-60


