Röhlig Annual Report 2012 Rohlig_Annual_Report_2012.pdf
Röhlig Annual Report 2012 Rohlig_Annual_Report_2012.pdf
Röhlig Annual Report 2012 Rohlig_Annual_Report_2012.pdf

Create successful ePaper yourself
Turn your PDF publications into a flip-book with our unique Google optimized e-Paper software.
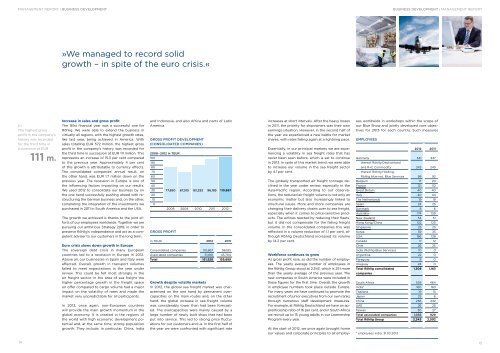
MANAGEMENT REPORT | BUSINESS DEVELOPMENTBUSINESS DEVELOPMENT | MANAGEMENT REPORT»We managed to record solidgrowth – in spite of the euro crisis.«(i)the highest grossprofit in the company’shistory was recordedfor the third time insuccession at eur111 m.Increase in sales and gross profitthe 161st financial year was a successful one forröhlig. We were able to extend the business invirtually all regions, with the highest growth rates,like last year, being achieved in America. Withsales totalling eur 572 million, the highest grossprofit in the company’s history was recorded forthe third time in succession at eur 111 million. thisrepresents an increase of 15.3 per cent comparedto the previous year. Approximately 4 per centof this growth is attributable to currency effects.the consolidated companies’ annual result, onthe other hand, was eur 1.7 million down on theprevious year. the recession in europe is one ofthe influen cing factors impacting on our results.We used <strong>2012</strong> to consolidate our business by onthe one hand successfully pushing ahead with restructuringthe German business and, on the other,completing the integration of the investments wepurchased in 2011 in South America and the uSA.the growth we achieved is thanks to the joint effortsof our employees worldwide. together we arepursuing our ambitious Strategy 2018, in order topreserve röhlig’s independence and act as a competentadviser to our customers in the long term.Euro crisis slows down growth in Europethe sovereign debt crisis in many europeancountries led to a recession in europe in <strong>2012</strong>.Above all, our businesses in Spain and Italy wereaffected. Overall, growth in transport volumesfailed to meet expectations in the year underreview. this could be felt most strongly in theair freight sector. In the area of sea freight thehigher percentage growth in the freight spaceon offer compared to cargo volume had a majorimpact on the volatility of rates and made themarket very unpredictable for all participants.In 2013, once again, non-european countrieswill provide the main growth momentum in theglobal economy. It is created in the regions ofthe world with high economic development potentialand, at the same time, strong populationgrowth. they include, in particular, China, Indiaand Indonesia, and also Africa and parts of latinAmerica.GroSS ProFIT deveLoPMeNT(CoNSoLIdATed CoMPANIeS)2008 – <strong>2012</strong> in TeUr100908070605040302010077,850200867,515200983,292201096,1852011110,867<strong>2012</strong>GroSS ProFITin teur <strong>2012</strong> 2011Consolidated companies 110,867 96,185Associated companies 51,061 43,704Total 161,928 139,889Growth despite volatile marketsIn <strong>2012</strong>, the global sea freight market was characterisedon the one hand by permanent overcapacitieson the main routes and, on the otherhand, the global increase in sea freight volumewas considerably lower than had been forecasted.the overcapacities were mainly caused by alarge number of newly built ships that had beenput into service. this led to strong price fluctuationsfor our customers and us. In the first half ofthe year we were confronted with significant rateincreases at short intervals. After the heavy lossesin 2011, the priority for shipowners was their ownearnings situation. However, in the second half ofthe year we experienced a new battle for marketshares, with rates falling again at a lightning pace.essentially, in our principal markets we are experiencinga volatility in sea freight rates that hasnever been seen before, which is set to continuein 2013. In spite of this market trend, we were ableto increase our volume in the sea freight sectorby 4.1 per cent.the globally transported air freight tonnage declinedin the year under review, especially in theAsia-pacific region. According to our observations,the reduced air freight volume is not only aneconomic matter but also increasingly linked tostructural issues. More and more companies arechanging their delivery chains over to sea freight,especially when it comes to price-sensitive products.the airlines reacted by reducing their fleets,but it did not compensate for the falling freightvolume. In the consolidated companies this wasreflected in a volume reduction of 1.1 per cent, althoughröhlig Deutschland increased its volumeby 14.2 per cent.Workforce continues to growAs gross profit rose, so did the number of employees.the yearly average number of employees inthe röhlig Group stood at 2,343, which is 251 morethan the yearly average of the previous year. thenew companies in South America were included inthese figures for the first time. Overall, the growthin employee numbers took place outside europe.For many years we have continued to promote therecruitment of junior executives from our own ranksthrough numerous staff development measures.For example, at röhlig Deutschland we have an apprenticeshipratio of 16 per cent, and in South Africawe recruit up to 15 young adults in our learnershipprogram every year.At the start of <strong>2012</strong>, we once again brought homeour values and corporate principles to all employeesworldwide in workshops within the scope ofour Blue Show and jointly developed core objectivesfor 2013 for each country. Such measureseMPLoyeeS<strong>2012</strong> 2011Germany 341 337thereof röhlig Deutschlandand r+C Commodity 243 245thereof röhlig Holding,röhlig blue-net, Blue Services 98 92Belgium 17 20France 121 112Great Britain 40 40Italy 40 44the netherlands 19 19Spain 24 25Denmark 8 6Australia 174 159new Zealand 54 51Hong Kong/China 122 125Singapore 25 25Korea 39 35uSA 186 128Canada 11 12Chile 26 25India (rohlig Blue Services) 10 0Argentina 22 0paraguay 8 0uruguay 24 0Total <strong>Röhlig</strong> consolidatedcompanies1,308 1,163South Africa 539 464India* 160 163thailand 19 13Japan 25 6China 236 232uAe 26 25taiwan 30 27Total associated companies 1,035 929Total <strong>Röhlig</strong> Group 2,343 2,092* employees India: 31.03.<strong>2012</strong>14 15