Algebra II Curriculum Map - Claremore Public Schools
Algebra II Curriculum Map - Claremore Public Schools
Algebra II Curriculum Map - Claremore Public Schools
Create successful ePaper yourself
Turn your PDF publications into a flip-book with our unique Google optimized e-Paper software.
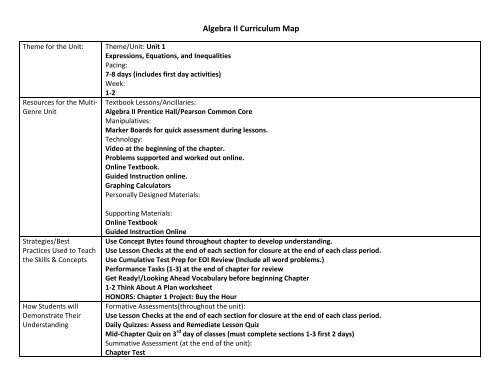
Standards-basedEssentials Skills andConcepts to be Targeted1-1:Review A.SSE.3: Choose and produce an equivalent form of an expression to reveal andexplain properties of the quantity represented by the expression.1-2:Review N.RN.3: Explain why the sum or product of two rational numbers is rational;that the sum of a rational number and an irrational number is irrational;and that the product of a nonzero rational number and an irrationalnumber is irrational.1-3:Review A.SSE.1.a: Interpret parts of an expression, such as terms, factors, andcoefficients.1-4:A.CED.1: Create equations and inequalities in one variable and use them tosolve problems. Include equations arising from linear and quadraticfunctions, and simple rational and exponential functions.A.CED.4: Rearrange formulas to highlight a quantity of interest, using the samereasoning as in solving equations. For example, rearrange Ohm’s law V =IR to highlight resistance R.1-5:A.CED.1: Create equations and inequalities in one variable and use them tosolve problems. Include equations arising from linear and quadraticfunctions, and simple rational and exponential functions.1-6:A.SSE.1.b: Interpret complicated expressions by viewing one or more of theirparts as a single entity. For example, interpret P(1+r)n as the productof P and a factor not depending on P.A.CED.1: Create equations and inequalities in one variable and use them tosolve problems. Include equations arising from linear and quadraticfunctions, and simple rational and exponential functions.
Theme for the Unit: Theme/Unit: Unit 2Functions, Equations, and GraphsPacing:7-8 daysWeek:3-4Resources for the Multi-Genre UnitTextbook Lessons/Ancillaries:<strong>Algebra</strong> <strong>II</strong> Prentice Hall/Pearson Common CoreManipulatives:Marker Boards for quick assessment during lessons.Technology:Video at the beginning of the chapter.Problems supported and worked out online.Online Textbook.Guided Instruction online.Graphing CalculatorsPersonally Designed Materials:Strategies/BestPractices Used to Teachthe Skills & ConceptsHow Students willDemonstrate TheirUnderstandingStandards-basedEssentials Skills andSupporting Materials:Online TextbookGuided Instruction OnlineUse Concept Bytes found throughout chapter to develop understanding.Use Lesson Checks at the end of each section for closure at the end of each class period.Use Cumulative Test Prep for EOI Review (Include all word problems.)Performance Tasks (1-3) at the end of chapter for reviewGet Ready!/Looking Ahead Vocabulary before beginning ChapterChapter 2 Project: Time SqueezeFormative Assessments(throughout the unit):Use Lesson Checks at the end of each section for closure at the end of each class period.Daily Quizzes: Assess and Remediate Lesson QuizMid-Chapter QuizSummative Assessment (at the end of the unit):Chapter Test2-1:Review F.IF.1: Understand that a function from one set (called the domain) to
Concepts to be Targetedanother set (called the range) assigns to each element of the domainexactly one element of the range. If f is a function and x is an elementof its domain, then f(x) denotes the output of f corresponding to theinput x. The graph of f is the graph of the equation y = f(x).F.IF.2: Use function notation, evaluate functions for inputs in their domains,and interpret statements that use function notation in terms of acontext.2-2:A.CED.2: Create equations in two or more variables to represent relationshipsbetween quantities; graph equations on coordinate axes with labelsand scales.2-3:A.CED.2: Create equations in two or more variables to represent relationshipsbetween quantities; graph equations on coordinate axes with labelsand scales.F.IF.4: For a function that models a relationship between two quantities,interpret key features of graphs and tables in terms of the quantities,and sketch graphs showing key features given a verbal descriptionof the relationship. Key features include: intercepts; intervals where thefunction is increasing, decreasing, positive, or negative; relative maximumsand minimums; symmetries; end behavior; and periodicity.★2-4:F.IF.8: Write a function defined by an expression in different but equivalentforms to reveal and explain different properties of the function.F.IF.9: Compare properties of two functions each represented in a differentway (algebraically, graphically, numerically in tables, or by verbaldescriptions). For example, given a graph of one quadratic function andan algebraic expression for another, say which has the larger maximum.F.IF.2: Use function notation, evaluate functions for inputs in their domains,and interpret statements that use function notation in terms of acontext.A.CED.2: Create equations in two or more variables to represent relationshipsbetween quantities; graph equations on coordinate axes with labelsand scales.Concept Byte 2-4:F.IF.7.b: Graph square root, cube root, and piecewise-defined functions,
including step functions and absolute value functions.2-5:F.IF.4: For a function that models a relationship between two quantities,interpret key features of graphs and tables in terms of the quantities,and sketch graphs showing key features given a verbal descriptionof the relationship. Key features include: intercepts; intervals where thefunction is increasing, decreasing, positive, or negative; relative maximumsand minimums; symmetries; end behavior; and periodicity.★A.CED.2: Create equations in two or more variables to represent relationshipsbetween quantities; graph equations on coordinate axes with labelsand scales.F.IF.6: Calculate and interpret the average rate of change of a function(presented symbolically or as a table) over a specified interval.Estimate the rate of change from a graph.★2-6:F.BF.3: Recognize that sequences are functions, sometimes definedrecursively, whose domain is a subset of the integers. For example, theFibonacci sequence is defined recursively by f(0) = f(1) = 1, f(n+1) = f(n) +f(n-1) for n ≥ 1.2-7:F.BF.3: Recognize that sequences are functions, sometimes definedrecursively, whose domain is a subset of the integers. For example, theFibonacci sequence is defined recursively by f(0) = f(1) = 1, f(n+1) = f(n) +f(n-1) for n ≥ 1.F.IF.7.b: Graph square root, cube root, and piecewise-defined functions,including step functions and absolute value functions.2-8:A.CED.2: Create equations in two or more variables to represent relationshipsbetween quantities; graph equations on coordinate axes with labelsand scales.F.IF.7.b: Graph square root, cube root, and piecewise-defined functions,including step functions and absolute value functions.
Theme for the Unit: Theme/Unit: Unit 3Linear SystemsPacing:7-8 daysWeek:4-5Resources for the Multi-Genre UnitTextbook Lessons/Ancillaries:<strong>Algebra</strong> <strong>II</strong> Prentice Hall/Pearson Common CoreManipulatives:Marker Boards for quick assessment during lessons.Technology:Video at the beginning of the chapter.Problems supported and worked out online.Online Textbook.Guided Instruction online.Graphing CalculatorsPersonally Designed Materials:Strategies/BestPractices Used to Teachthe Skills & ConceptsHow Students willDemonstrate TheirUnderstandingStandards-basedEssentials Skills andSupporting Materials:Online TextbookGuided Instruction OnlineUse Concept Bytes found throughout chapter to develop understanding.Use Lesson Checks at the end of each section for closure at the end of each class period.Use Cumulative Test Prep for EOI Review (Include all word problems.)Performance Tasks (1-3) at the end of chapter for reviewGet Ready!/Looking Ahead Vocabulary before beginning ChapterChapter 3 Project: Hot! Hot! Hot!Formative Assessments(throughout the unit):Use Lesson Checks at the end of each section for closure at the end of each class period.Daily Quizzes: Assess and Remediate Lesson QuizMid-Chapter QuizSummative Assessment (at the end of the unit):Chapter Test3-1:A.CED.2: Create equations in two or more variables to represent relationships
Concepts to be Targetedbetween quantities; graph equations on coordinate axes with labelsand scales.A.REI.6: Solve systems of linear equations exactly and approximately (e.g., withgraphs), focusing on pairs of linear equations in two variables.A.REI.11: Explain why the x-coordinates of the points where the graphs ofthe equations y = f(x) and y = g(x) intersect are the solutions of theequation f(x) = g(x); find the solutions approximately, e.g., usingtechnology to graph the functions, make tables of values, or findsuccessive approximations. Include cases where f(x) and/or g(x)are linear, polynomial, rational, absolute value, exponential, andlogarithmic functions.A.CED.3: Represent constraints by equations or inequalities, and by systems ofequations and/or inequalities, and interpret solutions as viable or nonviableoptions in a modeling context. For example, represent inequalitiesdescribing nutritional and cost constraints on combinations of differentfoods.3-2:A.REI.6: Solve systems of linear equations exactly and approximately (e.g., withgraphs), focusing on pairs of linear equations in two variables.A.REI.5: Prove that, given a system of two equations in two variables, replacingone equation by the sum of that equation and a multiple of the otherproduces a system with the same solutions.A.CED.2: Create equations in two or more variables to represent relationshipsbetween quantities; graph equations on coordinate axes with labelsand scales.3-3:A.REI.12: Graph the solutions to a linear inequality in two variables as a halfplane(excluding the boundary in the case of a strict inequality), andgraph the solution set to a system of linear inequalities in two variablesas the intersection of the corresponding half-planes.A.REI.6: Solve systems of linear equations exactly and approximately (e.g., withgraphs), focusing on pairs of linear equations in two variables.A.CED.3: Represent constraints by equations or inequalities, and by systems ofequations and/or inequalities, and interpret solutions as viable or nonviableoptions in a modeling context. For example, represent inequalitiesdescribing nutritional and cost constraints on combinations of different
foods.3-4:A.CED.3: Represent constraints by equations or inequalities, and by systems ofequations and/or inequalities, and interpret solutions as viable or nonviableoptions in a modeling context. For example, represent inequalitiesdescribing nutritional and cost constraints on combinations of differentfoods.Concept Byte 3-4:A.CED.3: Represent constraints by equations or inequalities, and by systems ofequations and/or inequalities, and interpret solutions as viable or nonviableoptions in a modeling context. For example, represent inequalitiesdescribing nutritional and cost constraints on combinations of differentfoods.Concept Byte 3-5:A.REI.6: Solve systems of linear equations exactly and approximately (e.g., withgraphs), focusing on pairs of linear equations in two variables.3-5:Extends A.REI.6: Solve systems of linear equations exactly and approximately (e.g., withgraphs), focusing on pairs of linear equations in two variables.3-6:A.REI.8: (+) Represent a system of linear equations as a single matrix equationin a vector variable.
Theme for the Unit: Theme/Unit: Unit 4Quadratic Functions and EquationsPacing:8-10 daysWeek:6-7Resources for the Multi-Genre UnitStrategies/BestPractices Used to Teachthe Skills & ConceptsHow Students willDemonstrate TheirUnderstandingStandards-basedEssentials Skills andTextbook Lessons/Ancillaries:<strong>Algebra</strong> <strong>II</strong> Prentice Hall/Pearson Common CoreManipulatives:Marker Boards for quick assessment during lessons.Technology:Video at the beginning of the chapter.Problems supported and worked out online.Online Textbook.Guided Instruction online.Graphing CalculatorsPersonally Designed Materials:Supporting Materials:Online TextbookGuided Instruction OnlineUse Concept Bytes found throughout chapter to develop understanding.Use Lesson Checks at the end of each section for closure at the end of each class period.Use Cumulative Test Prep for EOI Review (Include all word problems.)Performance Tasks (1-3) at the end of chapter for reviewGet Ready!/Looking Ahead Vocabulary before beginning ChapterUse <strong>Algebra</strong> Review before starting section 4-54-1 Think About A Plan Worksheet4-2 Think About A Plan WorksheetFormative Assessments(throughout the unit):Use Lesson Checks at the end of each section for closure at the end of each class period.Daily Quizzes: Assess and Remediate Lesson QuizMid-Chapter QuizSummative Assessment (at the end of the unit):Chapter Test4-1:F.BF.3: Identify the effect on the graph of replacing f(x) by f(x) + k, k f(x),
Concepts to be Targetedf(kx), and f(x + k) for specific values of k (both positive and negative);find the value of k given the graphs. Experiment with cases andillustrate an explanation of the effects on the graph using technology.Include recognizing even and odd functions from their graphs andalgebraic expressions for them.A.CED.1: Create equations and inequalities in one variable and use them tosolve problems. Include equations arising from linear and quadraticfunctions, and simple rational and exponential functions.F.IF.4: For a function that models a relationship between two quantities,interpret key features of graphs and tables in terms of the quantities,and sketch graphs showing key features given a verbal descriptionof the relationship. Key features include: intercepts; intervals where thefunction is increasing, decreasing, positive, or negative; relative maximumsand minimums; symmetries; end behavior; and periodicity.F.IF.6: Calculate and interpret the average rate of change of a function(presented symbolically or as a table) over a specified interval.Estimate the rate of change from a graph.4-2:A.CED.2: Create equations in two or more variables to represent relationshipsbetween quantities; graph equations on coordinate axes with labelsand scales.F.IF.4: For a function that models a relationship between two quantities,interpret key features of graphs and tables in terms of the quantities,and sketch graphs showing key features given a verbal descriptionof the relationship. Key features include: intercepts; intervals where thefunction is increasing, decreasing, positive, or negative; relative maximumsand minimums; symmetries; end behavior; and periodicity.F.IF.6: Calculate and interpret the average rate of change of a function(presented symbolically or as a table) over a specified interval.Estimate the rate of change from a graph.F.IF.8: Write a function defined by an expression in different but equivalentforms to reveal and explain different properties of the function.F.IF.9: Compare properties of two functions each represented in a differentway (algebraically, graphically, numerically in tables, or by verbaldescriptions). For example, given a graph of one quadratic function andan algebraic expression for another, say which has the larger maximum.
4-3:F.IF.5: Relate the domain of a function to its graph and, where applicable, tothe quantitative relationship it describes. For example, if the functionh(n) gives the number of person-hours it takes to assemble n engines in afactory, then the positive integers would be an appropriate domain for thefunction.F.IF.4: For a function that models a relationship between two quantities,interpret key features of graphs and tables in terms of the quantities,and sketch graphs showing key features given a verbal descriptionof the relationship. Key features include: intercepts; intervals where thefunction is increasing, decreasing, positive, or negative; relative maximumsand minimums; symmetries; end behavior; and periodicity.Concept Byte 4-3:F.IF.6: Calculate and interpret the average rate of change of a function(presented symbolically or as a table) over a specified interval.Estimate the rate of change from a graph.4-4:A.SSE.2: Use the structure of an expression to identify ways to rewrite it. Forexample, see x4 – y4 as (x2)2 – (y2)2, thus recognizing it as a difference ofsquares that can be factored as (x2 – y2)(x2 + y2).4-5:Review N.RN.2: Rewrite expressions involving radicals and rational exponents usingthe properties of exponents.A.CED.1: Create equations and inequalities in one variable and use them tosolve problems. Include equations arising from linear and quadraticfunctions, and simple rational and exponential functions.A.APR.3: Identify zeros of polynomials when suitable factorizations areavailable, and use the zeros to construct a rough graph of the functiondefined by the polynomial.A.SSE.1.a: Interpret parts of an expression, such as terms, factors, andcoefficients.Concept Byte 4-5:A.CED.2: Create equations in two or more variables to represent relationshipsbetween quantities; graph equations on coordinate axes with labelsand scales.4-6:
the equations y = f(x) and y = g(x) intersect are the solutions of theequation f(x) = g(x); find the solutions approximately, e.g., usingtechnology to graph the functions, make tables of values, or findsuccessive approximations. Include cases where f(x) and/or g(x)are linear, polynomial, rational, absolute value, exponential, andlogarithmic functions.Concept Byte 4-9:Extends N.CN.2: Use the relation i2 = –1 and the commutative, associative, anddistributive properties to add, subtract, and multiply complexnumbers.Theme for the Unit: Theme/Unit: Unit 5Polynomials and Polynomial FunctionsPacing:8-10 daysWeek:7-8Resources for the Multi-Genre UnitTextbook Lessons/Ancillaries:<strong>Algebra</strong> <strong>II</strong> Prentice Hall/Pearson Common CoreManipulatives:Marker Boards for quick assessment during lessons.Technology:Video at the beginning of the chapter.Problems supported and worked out online.Online Textbook.Guided Instruction online.Graphing CalculatorsPersonally Designed Materials:Supporting Materials:Online TextbookGuided Instruction Online
Strategies/BestPractices Used to Teachthe Skills & ConceptsHow Students willDemonstrate TheirUnderstandingUse Concept Bytes found throughout chapter to develop understanding.Use Lesson Checks at the end of each section for closure at the end of each class period.Use Cumulative Test Prep for EOI Review (Include all word problems.)Performance Tasks (1-3) at the end of chapter for reviewGet Ready!/Looking Ahead Vocabulary before beginning ChapterFormative Assessments(throughout the unit):Use Lesson Checks at the end of each section for closure at the end of each class period.Daily Quizzes: Assess and Remediate Lesson QuizMid-Chapter QuizSummative Assessment (at the end of the unit):Chapter TestStandards-basedEssentials Skills andConcepts to be Targeted5-1:F.IF.7.c: Graph polynomial functions, identifying zeros when suitable factorizations are available, and showing endbehavior.A.SSE.1.a: Interpret parts of an expression, such as terms, factors, and coefficients.5-2:F.IF.7.c: Graph polynomial functions, identifying zeros when suitable factorizations are available, and showing endbehavior.A.APR.3: Identify zeros of polynomials when suitable factorizations are available, and use the zeros to construct a roughgraph of the function defined by the polynomial.5-3:A.REI.11: Explain why the x-coordinates of the points where the graphs of the equations y = f(x) and y = g(x) intersect arethe solutions of the equation f(x) = g(x); find the solutions approximately, e.g., using technology to graph the functions,make tables of values, or find successive approximations. Include cases where f(x) and/or g(x) are linear, polynomial,rational, absolute value, exponential, and logarithmic functions.A.SSE.2: Use the structure of an expression to identify ways to rewrite it. For example, see x4 – y4 as (x2)2 – (y2)2, thusrecognizing it as a difference of squares that can be factored as (x2 – y2)(x2 + y2).5-4:A.APR.2: Know and apply the Remainder Theorem: For a polynomial p(x) and a number a, the remainder on division by x– a is p(a), so p(a) = 0 if and only if (x – a) is a factor of p(x).A.APR.1: Understand that polynomials form a system analogous to the integers, namely, they are closed under theoperations of addition, subtraction, and multiplication; add, subtract, and multiply polynomials.A.APR.6: Rewrite simple rational expressions in different forms; write a(x)/b(x) in the form q(x) + r(x)/b(x), where a(x),
(x), q(x), and r(x) are polynomials with the degree of r(x) less than the degree of b(x), using inspection, long division, or,for the more complicated examples, a computer algebra system.5-5:N.CN.7: Solve quadratic equations with real coefficients that have complex solutions.N.CN.8: Extend polynomial identities to the complex numbers. For example, rewrite x2 + 4 as (x + 2i)(x – 2i).Concept Byte 5-5:A.APR.4: Prove polynomial identities and use them to describe numerical relationships. For example, the polynomialidentity (x2 + y2)2 = (x2 – y2)2 + (2xy)2 can be used to generate Pythagorean triples.5-6:N.CN.7: Solve quadratic equations with real coefficients that have complex solutions.N.CN.8: Extend polynomial identities to the complex numbers. For example, rewrite x2 + 4 as (x + 2i)(x – 2i).N.CN.9: Know the Fundamental Theorem of <strong>Algebra</strong>; show that it is true for quadratic polynomials.A.APR.3: Identify zeros of polynomials when suitable factorizations are available, and use the zeros to construct a roughgraph of the function defined by the polynomial.Concept Byte 5-6:A.APR.3: Identify zeros of polynomials when suitable factorizations are available, and use the zeros to construct a roughgraph of the function defined by the polynomial.5-7:A.APR.5: (+) Know and apply the Binomial Theorem for the expansion of (x + y)n in powers of x and y for a positiveinteger n, where x and y are any numbers, with coefficients determined for example by Pascal’s Triangle.5-8:F.IF.5: Relate the domain of a function to its graph and, where applicable, to the quantitative relationship it describes.For example, if the function h(n) gives the number of person-hours it takes to assemble n engines in a factory, then thepositive integers would be an appropriate domain for the function.F.IF.4: For a function that models a relationship between two quantities, interpret key features of graphs and tables interms of the quantities, and sketch graphs showing key features given a verbal description of the relationship. Keyfeatures include: intercepts; intervals where the function is increasing, decreasing, positive, or negative; relativemaximums and minimums; symmetries; end behavior; and periodicity.F.IF.6: Calculate and interpret the average rate of change of a function (presented symbolically or as a table) over aspecified interval. Estimate the rate of change from a graph.5-9:F.BF.3: Identify the effect on the graph of replacing f(x) by f(x) + k, k f(x), f(kx), and f(x + k) for specific values of k (bothpositive and negative); find the value of k given the graphs. Experiment with cases and illustrate an explanation of theeffects on the graph using technology. Include recognizing even and odd functions from their graphs and algebraicexpressions for them.F.IF.7.c: Graph polynomial functions, identifying zeros when suitable factorizations are available, and showing end
ehavior.F.IF.8: Write a function defined by an expression in different but equivalent forms to reveal and explain differentproperties of the function.F.IF.9: Compare properties of two functions each represented in a different way (algebraically, graphically, numericallyin tables, or by verbal descriptions). For example, given a graph of one quadratic function and an algebraic expression foranother, say which has the larger maximum.Theme for the Unit: Theme/Unit: Unit 6Radical Functions and Rational ExponentsPacing:7-8 daysWeek:8-9Resources for the Multi-Genre UnitStrategies/BestPractices Used to Teachthe Skills & ConceptsTextbook Lessons/Ancillaries:<strong>Algebra</strong> <strong>II</strong> Prentice Hall/Pearson Common CoreManipulatives:Marker Boards for quick assessment during lessons.Technology:Video at the beginning of the chapter.Problems supported and worked out online.Online Textbook.Guided Instruction online.Graphing CalculatorsPersonally Designed Materials:Supporting Materials:Online TextbookGuided Instruction OnlineUse Concept Bytes found throughout chapter to develop understanding.Use Lesson Checks at the end of each section for closure at the end of each class period.Use Cumulative Test Prep for EOI Review (Include all word problems.)Performance Tasks (1-3) at the end of chapter for reviewGet Ready!/Looking Ahead Vocabulary before beginning Chapter
How Students willDemonstrate TheirUnderstandingFormative Assessments(throughout the unit):Use Lesson Checks at the end of each section for closure at the end of each class period.Daily Quizzes: Assess and Remediate Lesson QuizMid-Chapter QuizSummative Assessment (at the end of the unit):Chapter TestStandards-basedEssentials Skills andConcepts to be TargetedConcept Byte 6-1:Prepares N.RN.1: Explain how the definition of the meaning of rational exponents follows from extending the propertiesof integer exponents to those values, allowing for a notation for radicals in terms of rational exponents. For example, wedefine 51/3 to be the cube root of 5 because we want (51/3)3 = 5(1/3)3 to hold, so (51/3)3 must equal 5.6-1:A.SSE.2: Use the structure of an expression to identify ways to rewrite it. For example, see x4 – y4 as (x2)2 – (y2)2, thusrecognizing it as a difference of squares that can be factored as (x2 – y2)(x2 + y2).6-2:A.SSE.2: Use the structure of an expression to identify ways to rewrite it. For example, see x4 – y4 as (x2)2 – (y2)2, thusrecognizing it as a difference of squares that can be factored as (x2 – y2)(x2 + y2).6-3:A.SSE.2: Use the structure of an expression to identify ways to rewrite it. For example, see x4 – y4 as (x2)2 – (y2)2, thusrecognizing it as a difference of squares that can be factored as (x2 – y2)(x2 + y2).6-4:Reviews N.RN.2: Explain why the sum or product of two rational numbers is rational; that the sum of a rational numberand an irrational number is irrational; and that the product of a nonzero rational number and an irrational number isirrational.N.RN.1: Explain how the definition of the meaning of rational exponents follows from extending the properties ofinteger exponents to those values, allowing for a notation for radicals in terms of rational exponents. For example, wedefine 51/3 to be the cube root of 5 because we want (51/3)3 = 5(1/3)3 to hold, so (51/3)3 must equal 5.6-5:A.REI.2: Solve simple rational and radical equations in one variable, and give examples showing how extraneoussolutions may arise.A.CED.4: Rearrange formulas to highlight a quantity of interest, using the same reasoning as in solving equations. Forexample, rearrange Ohm’s law V = IR to highlight resistance R.6-6:F.BF.1.b: Combine standard function types using arithmetic operations. For example, build a function that models the
temperature of a cooling body by adding a constant function to a decaying exponential, andrelate these functions to the model.F.BF.1.c: Compose functions. For example, if T(y) is the temperature in the atmosphere as a function of height, and h(t) isthe height of a weather balloon as a function of time, then T(h(t)) is the temperature at the location of the weatherballoon as a function of time.6-7:F.BF.4.a: Solve an equation of the form f(x) = c for a simple function f that has an inverse and write an expression for theinverse. For example, f(x) =2 x3 for x > 0 or f(x) = (x+1)/(x–1) for x ≠ 1.F.BF.4.c: Read values of an inverse function from a graph or a table, given that the function has an inverse.Extends F.BF.4.a: Solve an equation of the form f(x) = c for a simple function f that has an inverse and write anexpression for the inverse. For example, f(x) =2 x3 for x > 0 or f(x) = (x+1)/(x–1) for x ≠ 1.6-8:F.IF.7.b: Graph square root, cube root, and piecewise-defined functions, including step functions and absolute valuefunctions.F.IF.8: Write a function defined by an expression in different but equivalent forms to reveal and explain differentproperties of the function.Theme for the Unit: Theme/Unit: Unit 7Exponential and Logarithmic FunctionsPacing:5-6 daysWeek:10Resources for the Multi-Genre UnitTextbook Lessons/Ancillaries:<strong>Algebra</strong> <strong>II</strong> Prentice Hall/Pearson Common CoreManipulatives:Marker Boards for quick assessment during lessons.Technology:Video at the beginning of the chapter.Problems supported and worked out online.Online Textbook.Guided Instruction online.Graphing Calculators
Strategies/BestPractices Used to Teachthe Skills & ConceptsHow Students willDemonstrate TheirUnderstandingPersonally Designed Materials:Supporting Materials:Online TextbookGuided Instruction OnlineUse Concept Bytes found throughout chapter to develop understanding.Use Lesson Checks at the end of each section for closure at the end of each class period.Use Cumulative Test Prep for EOI Review (Include all word problems.)Performance Tasks (1-3) at the end of chapter for reviewGet Ready!/Looking Ahead Vocabulary before beginning ChapterFormative Assessments(throughout the unit):Use Lesson Checks at the end of each section for closure at the end of each class period.Daily Quizzes: Assess and Remediate Lesson QuizMid-Chapter QuizSummative Assessment (at the end of the unit):Chapter TestStandards-basedEssentials Skills andConcepts to be Targeted7-1:F.IF.7.e: Graph exponential and logarithmic functions, showing intercepts and end behavior, and trigonometricfunctions, showing period, midline, and amplitude.A.CED.2: Create equations in two or more variables to represent relationships between quantities; graph equations oncoordinate axes with labels and scales.F.IF.8: Write a function defined by an expression in different but equivalent forms to reveal and explain differentproperties of the function.A.SSE.1.b: Interpret complicated expressions by viewing one or more of their parts as a single entity. For example,interpret P(1+r)n as the product of P and a factor not depending on P.7-2:F.IF.8: Write a function defined by an expression in different but equivalent forms to reveal and explain differentproperties of the function.F.IF.7.e: Graph exponential and logarithmic functions, showing intercepts and end behavior, and trigonometricfunctions, showing period, midline, and amplitude.F.BF.1.b: Combine standard function types using arithmetic operations. For example, build a function that models thetemperature of a cooling body by adding a constant function to a decaying exponential, and relate these functions to themodel.A.CED.2: Create equations in two or more variables to represent relationships between quantities; graph equations on
coordinate axes with labels and scales.A.SSE.1.b: Interpret complicated expressions by viewing one or more of their parts as a single entity. For example,interpret P(1+r)n as the product of P and a factor not depending on P.7-3:F.BF.4.a: Solve an equation of the form f(x) = c for a simple function f that has an inverse and write an expression for theinverse. For example, f(x) =2 x3 for x > 0 or f(x) = (x+1)/(x–1) for x ≠ 1.F.IF.7.e: Graph exponential and logarithmic functions, showing intercepts and end behavior, and trigonometricfunctions, showing period, midline, and amplitude.F.BF.1.b: Combine standard function types using arithmetic operations. For example, build a function that models thetemperature of a cooling body by adding a constant function to a decaying exponential, and relate these functions to themodel.A.CED.2: Create equations in two or more variables to represent relationships between quantities; graph equations oncoordinate axes with labels and scales.A.SSE.1.b: Interpret complicated expressions by viewing one or more of their parts as a single entity. For example,interpret P(1+r)n as the product of P and a factor not depending on P.Concept Byte 7-3:F.IF.4: For a function that models a relationship between two quantities, interpret key features of graphs and tables interms of the quantities, and sketch graphs showing key features given a verbal description of the relationship. Keyfeatures include: intercepts; intervals where the function is increasing, decreasing, positive, or negative; relativemaximums and minimums; symmetries; end behavior; and periodicity.7-4:Prepares for F.LE.4: For exponential models, express as a logarithm the solution to abct = d where a, c, and d arenumbers and the base b is 2, 10, or e; evaluate the logarithm using technology.7-5:F.LE.4: For exponential models, express as a logarithm the solution to abct = d where a, c, and d are numbers and thebase b is 2, 10, or e; evaluate the logarithm using technology.A.REI.11: Explain why the x-coordinates of the points where the graphs of the equations y = f(x) and y = g(x) intersect arethe solutions of the equation f(x) = g(x); find the solutions approximately, e.g., using technology to graph the functions,make tables of values, or find successive approximations. Include cases where f(x) and/or g(x) are linear, polynomial,rational, absolute value, exponential, and logarithmic functions.Concept Byte 7-5:F.IF.8: Write a function defined by an expression in different but equivalent forms to reveal and explain differentproperties of the function.F.IF.7.e: Graph exponential and logarithmic functions, showing intercepts and end behavior, and trigonometricfunctions, showing period, midline, and amplitude.7-6:
F.LE.4: For exponential models, express as a logarithm the solution to abct = d where a, c, and d are numbers and thebase b is 2, 10, or e; evaluate the logarithm using technology.Concept Byte 7-6:A.REI.11: Explain why the x-coordinates of the points where the graphs of the equations y = f(x) and y = g(x) intersect arethe solutions of the equation f(x) = g(x); find the solutions approximately, e.g., using technology to graph the functions,make tables of values, or find successive approximations. Include cases where f(x) and/or g(x) are linear, polynomial,rational, absolute value, exponential, and logarithmic functions.Theme for the Unit: Theme/Unit: Unit 8Rational FunctionsPacing:7-8 daysWeek:11-12Resources for the Multi-Genre UnitStrategies/BestPractices Used to Teachthe Skills & ConceptsTextbook Lessons/Ancillaries:<strong>Algebra</strong> <strong>II</strong> Prentice Hall/Pearson Common CoreManipulatives:Marker Boards for quick assessment during lessons.Technology:Video at the beginning of the chapter.Problems supported and worked out online.Online Textbook.Guided Instruction online.Graphing CalculatorsPersonally Designed Materials:Supporting Materials:Online TextbookGuided Instruction OnlineUse Concept Bytes found throughout chapter to develop understanding.Use Lesson Checks at the end of each section for closure at the end of each class period.Use Cumulative Test Prep for EOI Review (Include all word problems.)Performance Tasks (1-3) at the end of chapter for reviewGet Ready!/Looking Ahead Vocabulary before beginning Chapter
How Students willDemonstrate TheirUnderstandingStandards-basedEssentials Skills andConcepts to be TargetedFormative Assessments(throughout the unit):Use Lesson Checks at the end of each section for closure at the end of each class period.Daily Quizzes: Assess and Remediate Lesson QuizMid-Chapter QuizSummative Assessment (at the end of the unit):Chapter Test8-1:A.CED.2: Create equations in two or more variables to represent relationships between quantities; graph equations oncoordinate axes with labels and scales.A.CED.4: Rearrange formulas to highlight a quantity of interest, using the same reasoning as in solving equations. Forexample, rearrange Ohm’s law V = IR to highlight resistance R.Concept Byte 8-2:F.IF.7.a: Graph linear and quadratic functions and show intercepts, maxima, and minima.8-2:F.BF.3: Identify the effect on the graph of replacing f(x) by f(x) + k, k f(x), f(kx), and f(x + k) for specific values of k (bothpositive and negative); find the value of k given the graphs. Experiment with cases and illustrate an explanation of theeffects on the graph using technology. Include recognizing even and odd functions from their graphs and algebraicexpressions for them.A.CED.2: Create equations in two or more variables to represent relationships between quantities; graph equations oncoordinate axes with labels and scales.A.APR.1: Understand that polynomials form a system analogous to the integers, namely, they are closed under theoperations of addition, subtraction, and multiplication; add, subtract, and multiply polynomials.Concept Byte 8-3:Extends F.IF.7.d: Graph rational functions, identifying zeros and asymptotes when suitable factorizations are available,and showing end behavior.8-4:A.SSE.2: Use the structure of an expression to identify ways to rewrite it. For example, see x4 – y4 as (x2)2 – (y2)2, thusrecognizing it as a difference of squares that can be factored as (x2 – y2)(x2 + y2).A.SSE.1.b: Interpret complicated expressions by viewing one or more of their parts as a single entity. For example,interpret P(1+r)n as the product of P and a factor not depending on P.A.SSE.1.a: Interpret parts of an expression, such as terms, factors, and coefficients.8-5:A.APR.7: Understand that rational expressions form a system analogous to the rational numbers, closed under addition,subtraction, multiplication, and division by a nonzero rational expression; add, subtract, multiply, and divide rationalexpressions.
8-6:A.APR.7: Understand that rational expressions form a system analogous to the rational numbers, closed under addition,subtraction, multiplication, and division by a nonzero rational expression; add, subtract, multiply, and divide rationalexpressions.A.APR.6: Rewrite simple rational expressions in different forms; write a(x)/b(x) in the form q(x) + r(x)/b(x), where a(x),b(x), q(x), and r(x) are polynomials with the degree of r(x) less than the degree of b(x), using inspection, long division, or,for the more complicated examples, a computer algebra system.A.CED.1: Create equations and inequalities in one variable and use them to solve problems. Include equations arisingfrom linear and quadratic functions, and simple rational and exponential functions.A.REI.11: Explain why the x-coordinates of the points where the graphs of the equations y = f(x) and y = g(x) intersect arethe solutions of the equation f(x) = g(x); find the solutions approximately, e.g., using technology to graph the functions,make tables of values, or find successive approximations. Include cases where f(x) and/or g(x) are linear, polynomial,rational, absolute value, exponential, and logarithmic functions.Concept Byte 8-6:Extends A.REI.11: Explain why the x-coordinates of the points where the graphs of the equations y = f(x) and y = g(x)intersect are the solutions of the equation f(x) = g(x); find the solutions approximately, e.g., using technology to graphthe functions, make tables of values, or find successive approximations. Include cases where f(x) and/or g(x) are linear,polynomial, rational, absolute value, exponential, and logarithmic functions.Concept Byte 8-6:Extends A.REI.11: Explain why the x-coordinates of the points where the graphs of the equations y = f(x) and y = g(x)intersect are the solutions of the equation f(x) = g(x); find the solutions approximately, e.g., using technology to graphthe functions, make tables of values, or find successive approximations. Include cases where f(x) and/or g(x) are linear,polynomial, rational, absolute value, exponential, and logarithmic functions.
Theme for the Unit: Theme/Unit: Unit 9Sequences and SeriesPacing:5-6 daysWeek:12-13Resources for the Multi-Genre UnitStrategies/BestPractices Used to Teachthe Skills & ConceptsHow Students willDemonstrate TheirUnderstandingTextbook Lessons/Ancillaries:<strong>Algebra</strong> <strong>II</strong> Prentice Hall/Pearson Common CoreManipulatives:Marker Boards for quick assessment during lessons.Technology:Video at the beginning of the chapter.Problems supported and worked out online.Online Textbook.Guided Instruction online.Graphing CalculatorsPersonally Designed Materials:Supporting Materials:Online TextbookGuided Instruction OnlineUse Concept Bytes found throughout chapter to develop understanding.Use Lesson Checks at the end of each section for closure at the end of each class period.Use Cumulative Test Prep for EOI Review (Include all word problems.)Performance Tasks (1-3) at the end of chapter for reviewGet Ready!/Looking Ahead Vocabulary before beginning ChapterFormative Assessments(throughout the unit):Use Lesson Checks at the end of each section for closure at the end of each class period.Daily Quizzes: Assess and Remediate Lesson QuizMid-Chapter QuizSummative Assessment (at the end of the unit):Chapter Test
Standards-basedEssentials Skills andConcepts to be Targeted9-1:Prepares for A.SSE.4: Derive the formula for the sum of a finite geometric series (when the common ratio is not 1), anduse the formula to solve problems. For example, calculate mortgage payments.9-2:F.IF.3: Recognize that sequences are functions, sometimes defined recursively, whose domain is a subset of the integers.For example, the Fibonacci sequence is defined recursively by f(0) = f(1) = 1, f(n+1) = f(n) + f(n-1) for n ≥ 1.9-3:Prepares for A.SSE.4: Derive the formula for the sum of a finite geometric series (when the common ratio is not 1), anduse the formula to solve problems. For example, calculate mortgage payments.9-4:Extends F.IF.3: Recognize that sequences are functions, sometimes defined recursively, whose domain is a subset of theintegers. For example, the Fibonacci sequence is defined recursively by f(0) = f(1) = 1, f(n+1) = f(n) + f(n-1) for n ≥ 1.Concept Byte 9-5:A.SSE.4: Derive the formula for the sum of a finite geometric series (when the common ratio is not 1), and use theformula to solve problems. For example, calculate mortgage payments.9-5:A.SSE.4: Derive the formula for the sum of a finite geometric series (when the common ratio is not 1), and use theformula to solve problems. For example, calculate mortgage payments.
Theme for the Unit: Theme/Unit: Unit 10Quadratic Relations and Conic SectionsPacing:7-8 daysWeek:13-14Resources for the Multi-Genre UnitStrategies/BestPractices Used to Teachthe Skills & ConceptsHow Students willDemonstrate TheirUnderstandingTextbook Lessons/Ancillaries:<strong>Algebra</strong> <strong>II</strong> Prentice Hall/Pearson Common CoreManipulatives:Marker Boards for quick assessment during lessons.Technology:Video at the beginning of the chapter.Problems supported and worked out online.Online Textbook.Guided Instruction online.Graphing CalculatorsPersonally Designed Materials:Supporting Materials:Online TextbookGuided Instruction OnlineUse Concept Bytes found throughout chapter to develop understanding.Use Lesson Checks at the end of each section for closure at the end of each class period.Use Cumulative Test Prep for EOI Review (Include all word problems.)Performance Tasks (1-3) at the end of chapter for reviewGet Ready!/Looking Ahead Vocabulary before beginning ChapterChapter 10 Project: About Face!Formative Assessments(throughout the unit):Use Lesson Checks at the end of each section for closure at the end of each class period.Daily Quizzes: Assess and Remediate Lesson QuizMid-Chapter QuizSummative Assessment (at the end of the unit):Chapter Test
Standards-basedEssentials Skills andConcepts to be Targeted10-1:Prepares for G.GPE.1: Derive the equation of a circle of given center and radius using the Pythagorean Theorem;complete the square to find the center and radius of a circle given by an equation.Prepares for G.GPE.2: Derive the equation of a parabola given a focus and directrix.Prepares for G.GPE.3: Derive the equations of ellipses and hyperbolas given foci and directrices.Concept Byte 10-1:Prepares for G.GPE.1: Derive the equation of a circle of given center and radius using the Pythagorean Theorem;complete the square to find the center and radius of a circle given by an equation.Prepares for G.GPE.2: Derive the equation of a parabola given a focus and directrix.Prepares for G.GPE.3: Derive the equations of ellipses and hyperbolas given foci and directrices.10-2:G.GPE.2: Derive the equation of a parabola given a focus and directrix.10-3:G.GPE.1: Derive the equation of a circle of given center and radius using the Pythagorean Theorem; complete the squareto find the center and radius of a circle given by an equation.10-4:G.GPE.3: Derive the equations of ellipses and hyperbolas given foci and directrices.10-5:G.GPE.3: Derive the equations of ellipses and hyperbolas given foci and directrices.10-6:G.GPE.2: Derive the equation of a parabola given a focus and directrix.G.GPE.1: Derive the equation of a circle of given center and radius using the Pythagorean Theorem; complete the squareto find the center and radius of a circle given by an equation.F.IF.8: Write a function defined by an expression in different but equivalent forms to reveal and explain differentproperties of the function.Concept Byte 10-6:Extends A.REI.7: Solve a simple system consisting of a linear equation and a quadratic equation in two variablesalgebraically and graphically. For example, find the points of intersection between the line y = –3x and the circle x2 +y2 = 3.A.REI.11: Explain why the x-coordinates of the points where the graphs of the equations y = f(x) and y = g(x) intersect arethe solutions of the equation f(x) = g(x); find the solutions approximately, e.g., using technology to graph the functions,make tables of values, or find successive approximations. Include cases where f(x) and/or g(x) are linear, polynomial,rational, absolute value, exponential, and logarithmic functions.
Theme for the Unit: Theme/Unit: Unit 11Probability and StatisticsPacing:10 daysWeek:15-16Resources for the Multi-Genre UnitStrategies/BestPractices Used to Teachthe Skills & ConceptsHow Students willDemonstrate TheirUnderstandingTextbook Lessons/Ancillaries:<strong>Algebra</strong> <strong>II</strong> Prentice Hall/Pearson Common CoreManipulatives:Marker Boards for quick assessment during lessons.Technology:Video at the beginning of the chapter.Problems supported and worked out online.Online Textbook.Guided Instruction online.Graphing CalculatorsPersonally Designed Materials:Supporting Materials:Online TextbookGuided Instruction OnlineUse Concept Bytes found throughout chapter to develop understanding.Use Lesson Checks at the end of each section for closure at the end of each class period.Use Cumulative Test Prep for EOI Review (Include all word problems.)Performance Tasks (1-3) at the end of chapter for reviewGet Ready!/Looking Ahead Vocabulary before beginning ChapterFormative Assessments(throughout the unit):Use Lesson Checks at the end of each section for closure at the end of each class period.Daily Quizzes: Assess and Remediate Lesson QuizMid-Chapter QuizSummative Assessment (at the end of the unit):Chapter Test
Standards-basedEssentials Skills andConcepts to be Targeted11-1:S.CP.9 Use permutations and combinations to compute probabilities of compound events and solve problems.11-2:Prepares for S.IC.2: Decide if a specified model is consistent with results from a given data-generating process, e.g.,using simulation. For example, a model says a spinning coin falls heads up with probability 0.5. Would a result of 5tails in a row cause you to question the model?11-3:S.CP.7: Apply the Addition Rule, P(A or B) = P(A) + P(B) – P(A and B), and interpret the answer in terms of the model.S.CP.2: Understand that two events A and B are independent if the probability of A and B occurring together is theproduct of their probabilities, and use this characterization to determine if they are independent.S.CP.5: Recognize and explain the concepts of conditional probability and independence in everyday language andeveryday situations. For example, compare the chance of having lung cancer if you are a smoker with the chance of beinga smoker if you have lung cancer.Concept Byte 11-3:S.IC.2: Decide if a specified model is consistent with results from a given data-generating process, e.g., using simulation.For example, a model says a spinning coin falls heads up with probability 0.5. Would a result of 5 tails in a row cause youto question the model?11-4:S.CP.6: Find the conditional probability of A given B as the fraction of B’s outcomes that also belong to A, and interpretthe answer in terms of the model.S.CP.3: Understand the conditional probability of A given B as P(A and B)/P(B), and interpret independence of A and B assaying that the conditional probability of A given B is the same as the probability of A, and the conditional probability ofB given A is the same as the probability of B.S.CP.4: Construct and interpret two-way frequency tables of data when two categories are associated with each objectbeing classified. Use the two-way table as a sample space to decide if events are independent and to approximateconditional probabilities. For example, collect data from a random sample of students in your school on their favoritesubject among math, science, and English. Estimate the probability that a randomly selected student from your schoolwill favor science given that the student is in tenth grade. Do the same for other subjects and compare the results.S.CP.5: Recognize and explain the concepts of conditional probability and independence in everyday language andeveryday situations. For example, compare the chance of having lung cancer if you are a smoker with the chance of beinga smoker if you have lung cancer.S.CP.8: Apply the general Multiplication Rule in a uniform probability model, P(A and B) = P(A)P(B|A) = P(B)P(A|B), andinterpret the answer in terms of the model.11-5:S.MD.6: Use probabilities to make fair decisions (e.g., drawing by lots, using a random number generator).S.MD.7: Analyze decisions and strategies using probability concepts (e.g., product testing, medical testing, pulling a
hockey goalie at the end of a game).11-6:S.MD.6: Use probabilities to make fair decisions (e.g., drawing by lots, using a random number generator).S.MD.7: Analyze decisions and strategies using probability concepts (e.g., product testing, medical testing, pulling ahockey goalie at the end of a game).11-7:S.ID.6: Represent data on two quantitative variables on a scatter plot, and describe how the variables are related.S.IC.6: Evaluate reports based on data.11-8:S.IC.1: Understand statistics as a process for making inferences about population parameters based on a random samplefrom that population.S.IC.3: Recognize the purposes of and differences among sample surveys, experiments, and observational studies;explain how randomization relates to each.S.IC.4: Use data from a sample survey to estimate a population mean or proportion; develop a margin of error throughthe use of simulation models for random sampling.S.IC.6: Evaluate reports based on data.11-9:Extends S.CP.9: Use permutations and combinations to compute probabilities of compound events and solve problems.11-10:S.ID.4: Use the mean and standard deviation of a data set to fit it to a normal distribution and to estimate populationpercentages. Recognize that there are data sets for which such a procedure is not appropriate. Use calculators,spreadsheets, and tables to estimate areas under the normal curve.Concept Byte 11-10:S.IC.4: Use data from a sample survey to estimate a population mean or proportion; develop a margin of error throughthe use of simulation models for random sampling.Concept Byte 11-10:S.IC.5: Use data from a randomized experiment to compare two treatments; use simulations to decide if differencesbetween parameters are significant.
Theme for the Unit: Theme/Unit: Unit 12MatricesPacing:5 daysWeek:17Resources for the Multi-Genre UnitStrategies/BestPractices Used to Teachthe Skills & ConceptsHow Students willDemonstrate TheirUnderstandingTextbook Lessons/Ancillaries:<strong>Algebra</strong> <strong>II</strong> Prentice Hall/Pearson Common CoreManipulatives:Marker Boards for quick assessment during lessons.Technology:Video at the beginning of the chapter.Problems supported and worked out online.Online Textbook.Guided Instruction online.Graphing CalculatorsPersonally Designed Materials:Supporting Materials:Online TextbookGuided Instruction OnlineUse Concept Bytes found throughout chapter to develop understanding.Use Lesson Checks at the end of each section for closure at the end of each class period.Use Cumulative Test Prep for EOI Review (Include all word problems.)Performance Tasks (1-3) at the end of chapter for reviewGet Ready!/Looking Ahead Vocabulary before beginning ChapterFormative Assessments(throughout the unit):Use Lesson Checks at the end of each section for closure at the end of each class period.Daily Quizzes: Assess and Remediate Lesson QuizMid-Chapter QuizSummative Assessment (at the end of the unit):Chapter Test
Standards-basedEssentials Skills andConcepts to be Targeted12-1:N.VM.8: Add, subtract, and multiply matrices of appropriate dimensions.N.VM.10: Understand that the zero and identity matrices play a role in matrix addition and multiplication similar to therole of 0 and 1 in the real numbers. The determinant of a square matrix is nonzero if and only if the matrix has amultiplicative inverse.Concept Byte 12-1:N.VM.8: Add, subtract, and multiply matrices of appropriate dimensions12-2:N.VM.6: Use matrices to represent and manipulate data, e.g., to represent payoffs or incidence relationships in anetwork.N.VM.7: Multiply matrices by scalars to produce new matrices, e.g., as when all of the payoffs in a game are doubled.N.VM.8: Add, subtract, and multiply matrices of appropriate dimensions.N.VM.9: Understand that, unlike multiplication of numbers, matrix multiplication for square matrices is not acommutative operation, but still satisfies the associative and distributive properties.Concept Byte 12-2:N.VM.6: Use matrices to represent and manipulate data, e.g., to represent payoffs or incidence relationships in anetwork.12-3:N.VM.10: Understand that the zero and identity matrices play a role in matrix addition and multiplication similar to therole of 0 and 1 in the real numbers. The determinant of a square matrix is nonzero if and only if the matrix has amultiplicative inverse.N.VM.12: Work with 2 × 2 matrices as a transformations of the plane, and interpret the absolute value of thedeterminant in terms of area.12-4:N.VM.8: Add, subtract, and multiply matrices of appropriate dimensions.12-5:G.CO.5: Given a geometric figure and a rotation, reflection, or translation, draw the transformed figure using, e.g., graphpaper, tracing paper, or geometry software. Specify a sequence of transformations that will carry a given figure ontoanother.G.CO.2: Represent transformations in the plane using, e.g., transparencies and geometry software; describetransformations as functions that take points in the plane as inputs and give other points as outputs. Comparetransformations that preserve distance and angle to those that do not (e.g., translation versus horizontal stretch).N.VM.6: Use matrices to represent and manipulate data, e.g., to represent payoffs or incidence relationships in anetwork.N.VM.7: Multiply matrices by scalars to produce new matrices, e.g., as when all of the payoffs in a game are doubled.N.VM.8: Add, subtract, and multiply matrices of appropriate dimensions.
12-6:N.VM.5.a: Represent scalar multiplication graphically by scaling vectors and possibly reversing their direction; performscalar multiplication component-wise, e.g., as c(vx, vy) = (cvx, cvy).N.VM.11: Multiply a vector (regarded as a matrix with one column) by a matrix of suitable dimensions to produceanother vector. Work with matrices as transformations of vectors.N.VM.1-4: 1. (+) Recognize vector quantities as having both magnitude and direction. Represent vector quantities bydirected line segments, and use appropriate symbols for vectors and their magnitudes (e.g., v, |v|, ||v||, v).2. (+) Find the components of a vector by subtracting the coordinates of an initial point from the coordinates of aterminal point.3. (+) Solve problems involving velocity and other quantities that can be represented by vectors.4. (+) Add and subtract vectors.a. Add vectors end-to-end, component-wise, and by the parallelogram rule. Understand that the magnitude of a sum oftwo vectors is typically not the sum of the magnitudes.b. Given two vectors in magnitude and direction form, determine the magnitude and direction of their sum.c. Understand vector subtraction v – w as v + (–w), where –w is the additive inverse of w, with the same magnitude as wand pointing in the opposite direction. Represent vector subtraction graphically by connecting the tips in the appropriateorder, and perform vector subtraction component-wise.N.VM.5.b: Compute the magnitude of a scalar multiple cv using ||cv|| = |c|v. Compute the direction of cv knowing thatwhen |c|v ≠ 0, the direction of cv is either along v (for c > 0) or against v (for c < 0).N.VM.12: Work with 2 × 2 matrices as a transformations of the plane, and interpret the absolute value of thedeterminant in terms of area.
Standards-basedEssentials Skills andConcepts to be Targeted13-1:F.IF.4: For a function that models a relationship between two quantities, interpret key features of graphs and tables interms of the quantities, and sketch graphs showing key features given a verbal description of the relationship. Keyfeatures include: intercepts; intervals where the function is increasing, decreasing, positive, or negative; relativemaximums and minimums; symmetries; end behavior; and periodicity.Prepares for F.IF.5: Relate the domain of a function to its graph and, where applicable, to the quantitative relationship itdescribes. For example, if the function h(n) gives the number of person-hours it takes to assemble n engines in afactory, then the positive integers would be an appropriate domain for the function.13-2 Review:G.SRT.6: Understand that by similarity, side ratios in right triangles are properties of the angles in the triangle, leading todefinitions of trigonometric ratios for acute angles.13-2:Prepares for F.TF.2: Explain how the unit circle in the coordinate plane enables the extension of trigonometric functionsto all real numbers, interpreted as radian measures of angles traversed counterclockwise around the unit circle.Concept Byte 13-3:Prepares for F.TF.1: Understand radian measure of an angle as the length of the arc on the unit circle subtended by theangle.13-3:F.TF.1 Understand radian measure of an angle as the length of the arc on the unit circle subtended by the angle.13-4:F.TF.2: Explain how the unit circle in the coordinate plane enables the extension of trigonometric functions to all realnumbers, interpreted as radian measures of angles traversed counterclockwise around the unit circle.F.TF.5: Choose trigonometric functions to model periodic phenomena with specified amplitude, frequency, and midline.F.IF.4: For a function that models a relationship between two quantities, interpret key features of graphs and tables interms of the quantities, and sketch graphs showing key features given a verbal description of the relationship. Keyfeatures include: intercepts; intervals where the function is increasing, decreasing, positive, or negative; relativemaximums and minimums; symmetries; end behavior; and periodicity.F.IF.7.e: Graph exponential and logarithmic functions, showing intercepts and end behavior, and trigonometricfunctions, showing period, midline, and amplitude.Concept Byte 13-4:Prepares for F.TF.5: Choose trigonometric functions to model periodic phenomena with specified amplitude, frequency,and midline.13-5:F.TF.5: Choose trigonometric functions to model periodic phenomena with specified amplitude, frequency, and midline.F.IF.4: For a function that models a relationship between two quantities, interpret key features of graphs and tables interms of the quantities, and sketch graphs showing key features given a verbal description of the relationship. Key
features include: intercepts; intervals where the function is increasing, decreasing, positive, or negative; relativemaximums and minimums; symmetries; end behavior; and periodicity.F.IF.7.e: Graph exponential and logarithmic functions, showing intercepts and end behavior, and trigonometricfunctions, showing period, midline, and amplitude.F.TF.2: Explain how the unit circle in the coordinate plane enables the extension of trigonometric functions to all realnumbers, interpreted as radian measures of angles traversed counterclockwise around the unit circle.13-6:F.IF.7.e: Graph exponential and logarithmic functions, showing intercepts and end behavior, and trigonometricfunctions, showing period, midline, and amplitude.F.TF.2: Explain how the unit circle in the coordinate plane enables the extension of trigonometric functions to all realnumbers, interpreted as radian measures of angles traversed counterclockwise around the unit circle.F.TF.5: Choose trigonometric functions to model periodic phenomena with specified amplitude, frequency, and midline.13-7:F.TF.5: Choose trigonometric functions to model periodic phenomena with specified amplitude, frequency, and midline.F.IF.7.e: Graph exponential and logarithmic functions, showing intercepts and end behavior, and trigonometricfunctions, showing period, midline, and amplitude.13-8:F.IF.7.e: Graph exponential and logarithmic functions, showing intercepts and end behavior, and trigonometricfunctions, showing period, midline, and amplitude.
Theme for the Unit: Theme/Unit: Unit 14Trigonometric Identities and EquationsPacing:7-8 daysWeek:As time permitsResources for the Multi-Genre UnitStrategies/BestPractices Used to Teachthe Skills & ConceptsHow Students willDemonstrate TheirUnderstandingTextbook Lessons/Ancillaries:<strong>Algebra</strong> <strong>II</strong> Prentice Hall/Pearson Common CoreManipulatives:Marker Boards for quick assessment during lessons.Technology:Video at the beginning of the chapter.Problems supported and worked out online.Online Textbook.Guided Instruction online.Graphing CalculatorsPersonally Designed Materials:Supporting Materials:Online TextbookGuided Instruction OnlineUse Concept Bytes found throughout chapter to develop understanding.Use Lesson Checks at the end of each section for closure at the end of each class period.Use Cumulative Test Prep for EOI Review (Include all word problems.)Performance Tasks (1-3) at the end of chapter for reviewGet Ready!/Looking Ahead Vocabulary before beginning ChapterFormative Assessments(throughout the unit):Use Lesson Checks at the end of each section for closure at the end of each class period.Daily Quizzes: Assess and Remediate Lesson QuizMid-Chapter QuizSummative Assessment (at the end of the unit):Chapter Test
Standards-basedEssentials Skills andConcepts to be Targeted14-1:F.TF.8: Prove the Pythagorean identity sin2(θ) + cos2(θ) = 1 and use it to calculate trigonometric ratios.14-2:F.TF.6: Understand that restricting a trigonometric function to a domain on which it is always increasing or alwaysdecreasing allows its inverse to be constructed.F.TF.7: Use inverse functions to solve trigonometric equations that arise in modeling contexts; evaluate the solutionsusing technology, and interpret them in terms of the context.14-3:G.SRT.6: Understand that by similarity, side ratios in right triangles are properties of the angles in the triangle, leading todefinitions of trigonometric ratios for acute angles.G.SRT.8: Use trigonometric ratios and the Pythagorean Theorem to solve right triangles in applied problems.14-4:G.SRT.9: Derive the formula A = 1/2 ab sin(C) for the area of a triangle by drawing an auxiliary line from a vertexperpendicular to the opposite side.G.SRT.11: Understand and apply the Law of Sines and the Law of Cosines to find unknown measurements in right andnon-right triangles (e.g., surveying problems, resultant forces).G.SRT.10: Prove the Laws of Sines and Cosines and use them to solve problems.Concept Byte 14-4:G.SRT.11: Understand and apply the Law of Sines and the Law of Cosines to find unknown measurements in right andnon-right triangles (e.g., surveying problems, resultant forces).14-5:G.SRT.10: Prove the Laws of Sines and Cosines and use them to solve problems.G.SRT.11: Understand and apply the Law of Sines and the Law of Cosines to find unknown measurements in right andnon-right triangles (e.g., surveying problems, resultant forces).14-6:F.TF.9: Prove the addition and subtraction formulas for sine, cosine, and tangent and use them to solve problems.14-7:F.TF.9: Prove the addition and subtraction formulas for sine, cosine, and tangent and use them to solve problems.


