Financial Report 2003 (english) PDF ⢠287.26 KB - Kuoni Group
Financial Report 2003 (english) PDF ⢠287.26 KB - Kuoni Group
Financial Report 2003 (english) PDF ⢠287.26 KB - Kuoni Group

Create successful ePaper yourself
Turn your PDF publications into a flip-book with our unique Google optimized e-Paper software.
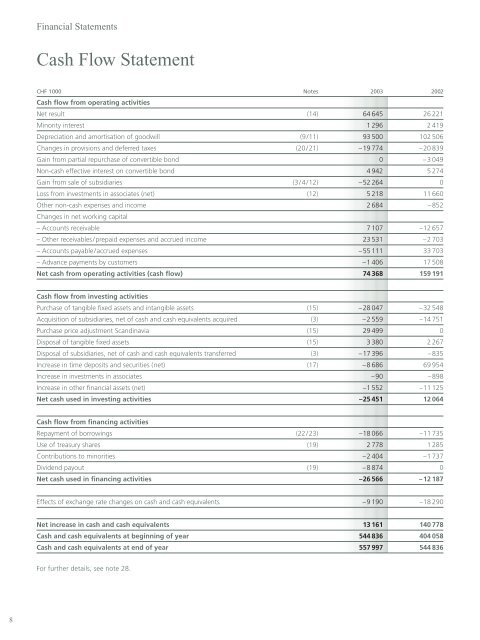
8<br />
<strong>Financial</strong> Statements<br />
Cash Flow Statement<br />
CHF 1000 Notes <strong>2003</strong> 2002<br />
Cash flow from operating activities<br />
Net result (14) 64 645 26 221<br />
Minority interest 1 296 2 419<br />
Depreciation and amortisation of goodwill (9/11) 93 500 102 506<br />
Changes in provisions and deferred taxes (20/21) –19 774 –20 839<br />
Gain from partial repurchase of convertible bond 0 –3 049<br />
Non-cash effective interest on convertible bond 4 942 5 274<br />
Gain from sale of subsidiaries (3/4/12) –52 264 0<br />
Loss from investments in associates (net) (12) 5 218 11 660<br />
Other non-cash expenses and income 2 684 –852<br />
Changes in net working capital<br />
– Accounts receivable 7 107 –12 657<br />
– Other receivables/prepaid expenses and accrued income 23 531 –2 703<br />
– Accounts payable/accrued expenses –55 111 33 703<br />
– Advance payments by customers –1 406 17 508<br />
Net cash from operating activities (cash flow) 74 368 159 191<br />
Cash flow from investing activities<br />
Purchase of tangible fixed assets and intangible assets (15) –28 047 –32 548<br />
Acquisition of subsidiaries, net of cash and cash equivalents acquired (3) –2 559 –14 751<br />
Purchase price adjustment Scandinavia (15) 29 499 0<br />
Disposal of tangible fixed assets (15) 3 380 2 267<br />
Disposal of subsidiaries, net of cash and cash equivalents transferred (3) –17 396 –835<br />
Increase in time deposits and securities (net) (17) –8 686 69 954<br />
Increase in investments in associates –90 –898<br />
Increase in other financial assets (net) –1 552 –11 125<br />
Net cash used in investing activities –25 451 12 064<br />
Cash flow from financing activities<br />
Repayment of borrowings (22/23) –18 066 –11 735<br />
Use of treasury shares (19) 2 778 1 285<br />
Contributions to minorities –2 404 –1 737<br />
Dividend payout (19) –8 874 0<br />
Net cash used in financing activities –26 566 –12 187<br />
Effects of exchange rate changes on cash and cash equivalents –9 190 –18 290<br />
Net increase in cash and cash equivalents 13 161 140 778<br />
Cash and cash equivalents at beginning of year 544 836 404 058<br />
Cash and cash equivalents at end of year 557 997 544 836<br />
For further details, see note 28.