Untitled - Malaysian Institute of Planners
Untitled - Malaysian Institute of Planners
Untitled - Malaysian Institute of Planners

Create successful ePaper yourself
Turn your PDF publications into a flip-book with our unique Google optimized e-Paper software.
PLANNING MALAYSIAAdvisorPr<strong>of</strong>essor Dato’Editor-in-ChiefDato’I I y M y II MLocal Editorial Board MembersI I y M y II MI I y M y II MM y MM y MM y MM y MM y MM I MM I Mb M y MI I y M y II MM y MI I y M y II MM y I P MIPM y I P MIPM y I P MIPM y I P MIPb P Pb P PInternational Editorial Boardyyy y byy I yyy yIIPI© 2012 by MIP
Editorial & Business CorrespondencePLANNING MALAYSIAJournal <strong>of</strong> the <strong>Malaysian</strong> <strong>Institute</strong> <strong>of</strong> <strong>Planners</strong>B-01-02, Jalan SS7/13B, Aman Seri, Kelana Jaya47301, Petaling Jaya, Selangor Darul Ehsan, MALAYSIATel: +603 78770637 Fax: +603 78779636 Email: mip@mip.org.myCopyright © MIP, 2012All rights reserved.No part <strong>of</strong> this publication may be reproduced, stored in a retrieval system, or transmitted in anyform or by any means, electronic, mechanical, photocopying, or otherwise without the priorpermission <strong>of</strong> the publisher.The views expressed in this publication are those <strong>of</strong> the author(s) and do not necessarily representthe views <strong>of</strong> MIP.This journal is a refereed journal.All articles were reviewed by two or three unanimous referees identified by the <strong>Institute</strong> (MIP).Published By<strong>Malaysian</strong> <strong>Institute</strong> <strong>of</strong> <strong>Planners</strong>ISSN Number1675-6215© 2012 by MIP
CON N Sournal <strong>of</strong> the <strong>Malaysian</strong> <strong>Institute</strong> <strong>of</strong> <strong>Planners</strong>Message from The PresidentvArti les1. Determinant Factors <strong>of</strong> Neighbourhood QualityBy: Norainah Abdul Rahman, Dasimah Omar & Abdul GhaniSalleh2. The Relationship Between ariations <strong>of</strong> Grid Layout andBurglaryBy: Saniah Ahmad aki & Jamalunlaili Abdullah3. Analysis <strong>of</strong> Factors Influencing the Stated Preference <strong>of</strong>Academic Employees Towards Telecommuting in II MCampus, GombakBy: arah Diyanah Ismail , Abdul A ee Kadar amsa &Mansor Ibrahim4. The Potential <strong>of</strong> rban Forest Park for Sustainable CityBy: Norali a ati Mohamed, Noriah Othman & Mohd ishamAriffin5. The Effectiveness <strong>of</strong> Provision <strong>of</strong> New Static InformationSignage: A Case Study <strong>of</strong> International Islamic niversityMalaysia, Gombak CampusBy: Sya ani Sahrir, Syahriah Bachok & Mariana Mohd.Osman6. The Construction and Demolition astes in Klang alley,MalaysiaBy: Muhammad Abu usuf, Mansor Ibrahim & Rafikul Islam7. The Future <strong>of</strong> Coastal Management Programme in Malaysia:Making the Coast isible to <strong>Planners</strong>By: M. ainora Asma i11741678199125Notes to contributors and guidelines for manuscript submission 147The past issues 151“Whoever travels in search <strong>of</strong> knowledge is on Jihād until he returns”(Transmitted by Tirmidhi Darimi)iii© 2012 by MIP
MIP Coun il Mem ers(2011-2013 Session)PresidentPr<strong>of</strong>essor Dato’ Dr. Alias Abdullah (194/88)Vice PresidentDatuk Ismail B. Ibrahim (504/05)Hon. SecretaryLee Lih Shyan (267/92)Hon. TreasuryMd. Nazri B. Mohd Noordin (301/94)Council MembersKhairiah Mohd Talha (184/85)Mohd Zamri Husin (430/01)Mohamad Nazri Jaafar (168/86)Mazrina Dato' Abdul Khalid (559/09)Noraida Saludin (468/02)Zahiruddin Zainal (495/05)Mohammad Fahmi Alias (500/05)Lokman Omar (211/88)Associate Pr<strong>of</strong>essor Dr. Jamalunlaili Abdullah (562/09)Ishak Ariffin (239/90)Co-opted MembersTan Thean Siew (178/86)Chairman <strong>of</strong> Sarawak/Sabah ChapterBartholomew Wong (477/03)Chairman <strong>of</strong> Northern Region ChapterMichael Ong Chin Kong (443/01)Chairman <strong>of</strong> Southern Region CommitteeAhmad Abd Majid (290/94)© 2012 by MIP iv
MESSAGE F OM T E P ESI ENTearea ers,This year MIP is celebrating its 40 years old.Although she was in existence for almost half acentury with a lot <strong>of</strong> ‘up and down’ and ‘bitterand sweet’ recalls in championing the novelcourse <strong>of</strong> planning pr<strong>of</strong>ession in the country, theconsistency <strong>of</strong> publication <strong>of</strong> Planning MalaysiaJournal only could be realized since 2003.Started with four editorial board members anddifficulties in chasing the articles from theplanning fraternities, now in its volume 10 th theJournal is well-received by the members as wellas the academic community. This is due toperhaps, the awareness for knowledge seekingand improvement among the members as thearticles touch on wide spectrum <strong>of</strong> our dailyplanning issues. It is indeed a great achievementto the <strong>Institute</strong> as we strive to encourage moremembers and academics to write and share newideas on planning and urban development.The main objective <strong>of</strong> this journal is to <strong>of</strong>fer a platform for town planners to share ideasand experiences on urban and regional planning stuffs. Ideas and thoughts may begenerated from research, studies undertaken or actual hands-on experiences <strong>of</strong> plannersand academics. MIP hopes the journal can <strong>of</strong>fer a healthier insight to all planners so thattheir roles as town planners can be eloquently appreciated by the public.We expect to outspread the circulation <strong>of</strong> this journal to non-planning relatedorganizations and institutions that has indirect role in planning within and outside thecountry. We hope this issue will serve the purpose and welcome any comment forimprovement in the future issue.As a President, I would like to acknowledge and congratulate the authors and theJournal’s Editorial Board Members for their dedication and continuous support to the<strong>Institute</strong>.Thank you and happy reading.Pr<strong>of</strong>. Dato’ Dr. Alias AbdullahPRESIDENT(2011-2013)v© 2012 by MIP
Norainah Abdul Rahman, Dasimah Omar & Abdul Ghani SallehDeterminant Factors <strong>of</strong> Neighbourhood QualityIN I NThe basic concept <strong>of</strong> neighbourhood is known as a delineated area withinphysical boundaries where people identify their home and where they live outand organise their private lives. There are both physical and psychologicalbarriers between neighbourhoods such as a road or the tenure <strong>of</strong> the housing, orthe social composition <strong>of</strong> residents (Power, 2004). Theodori (2001) mentionsthat a neighbourhood is the satisfaction and attachment <strong>of</strong> a community whichhave various social and demographic factors associated with ones’ well-being.A neighbourhood is also known as a place-based community to support anargument that a neighbourhood is an appropriate spatial scale forunderstanding the operation <strong>of</strong> ‘everyday life-worlds’ (Meegan & Mitchell,2001). According to Jones (2001) and Leby and Hashim (2010), aneighbourhood is a sense <strong>of</strong> community and quality <strong>of</strong> life. It is a promotedliveable neighbourhood by comparing the conventional suburban and traditionalurban development. It also includes social embeddedness, sense <strong>of</strong> community,satisfaction with the neighbourhood, and sensed crime (Martinez, Black, &Starr, 2002). Urban neighbourhood is a place <strong>of</strong> attachment and has acommunity sentiment. The concept <strong>of</strong> place is conceptualised in terms <strong>of</strong> thesetting in which social relations are constituted, the effects upon locales <strong>of</strong>social and economic processes and the creation <strong>of</strong> a sense <strong>of</strong> place (Corcoran,2002). Neighbourhoods can be defined and created through social interactionsand particular actions which <strong>of</strong>ten conflict and the ideal <strong>of</strong> neighbourhoodasserts a role for the “local” in a world increasingly characterized by extra-localinteractions and exchanges (Martin, 2003). The neighbourhood is an urbanquality environment and human well-being where the specification <strong>of</strong> lifeconcerns and determination <strong>of</strong> how reactions to them have to combine to predictpeople’s sense <strong>of</strong> overall life quality (Pacione, 2003).The improvement or upgrading in a neighbourhood is a continuousprocess for the need and requirement <strong>of</strong> its residents. People’s perception isrequired to evaluate the urban quality environment elements in theneighbourhood change. The combination <strong>of</strong> elements <strong>of</strong> urban qualityenvironment and people’s perception will create the environment <strong>of</strong> a liveablecity and for the people’s well-being. The wide range <strong>of</strong> elements need to besatisfied such as social, economic and environment (Pacione, 2003). Aneighbourhood has to be a settlement which is viewed holistically, being notsimply the physical place but the people that live there, their activities, theirsocial networks, the economy they depend on, and the broader base <strong>of</strong>environmental capital that supports them. It is the settlement as a living,breathing, changing thing as a local ecosystem within the global ecosystem© 2012 by MIP
Norainah Abdul Rahman, Dasimah Omar & Abdul Ghani SallehDeterminant Factors <strong>of</strong> Neighbourhood QualityN IGALI YThe literature reviews in determining the neighbourhood quality are taken fromprevious research on residential and neighbourhood environment. Most researchon residential and neighbourhood environment deal with physical factors(Fornara, Bonaiuto, & Bonnes, 2010; Lovejoy, Handy, & Mokhtarian, 2010;Mohit, Ibrahim, & Rashid, 2010) social factors (Aiello, Ardone, & Scopelliti,2010; Erkip, 2010; Rogers & Sukolratanametee, 2009) and economic factors(Lotfi & Koohsari, 2009; Serrano, 2009). Basically, the neighbourhood qualityis influenced by neighbourhood attributes, home attributes and jurisdictionalattributes (Greenberg & Crossney, 2007). The neighbourhood quality is alsoassociated with social capital, security and adequacy <strong>of</strong> facilities (Yang, Yang,Shih, & See, 2002). The neighbourhood quality is about the environmentcondition and the residents’ characteristics (Greenberg, 1998). As mentionedearlier, the neighbourhood quality is related to the physical, social andeconomy aspects in the residential and neighbourhood area (Kim, et al., 2008;Scorbureanu & Scorbureanu, 2012). Most previous research used multivariableelements in evaluating the neighbourhood quality. These aspects are importantin the provision <strong>of</strong> adequate and sufficient facilities in the neighbourhoodquality for the residents’ necessities and requirements. There are three mainfactors that influence the neighbourhood quality. The factors are physicalfactors, social factors and economic factors. A detailed discussion <strong>of</strong> eachmultivariable factor used in the previous studies will be discussed further in thenext section.PMost <strong>of</strong> the researchers use multivariable for physical factors. Aiello et al.(2010) use the functional and environment aspects such as architectural andtown-planning features, services and facilities, crime and security as physicalmultivariable factors. Lovejoy et al. (2010) use attractiveness, quiet, liveliness,big yards, safety, mixed-use and good infrastructure in evaluating the physicalattributes. Mohit et al. (2010) apply physical factors on the environment aspectssuch as noise level, accident situation, crime situation, security control andcommunity relations as well as the public facilities and the distance <strong>of</strong>neighbourhood facilities provided. Whereas, Bonaiuto et al. (1999; 2003; 2006)utilize other physical elements related to architectural and urban planning spacesuch as the organization <strong>of</strong> accessibility and roads, green areas, welfareservices, recreational services, commercial services, transport services,environmental health and upkeep. Hur, Nasar and Chun (2010) develop otherphysical measures used in influencing the neighbourhood quality such as the© 2012 by MIP 4
PLANNING MALAYSIAJournal <strong>of</strong> the Malaysia <strong>Institute</strong> <strong>of</strong> <strong>Planners</strong> (2012)attributes <strong>of</strong> the surrounding environment, perceived attributes <strong>of</strong> theenvironment and evaluation <strong>of</strong> the attributes <strong>of</strong> the surrounding environment.Serrano (2009) is concerned with the physical factors influencing theprovision <strong>of</strong> neighbourhood quality such as noise, pollution, environmentalproblems and crime or vandalism. Lotfi and Koohsari (2009) evaluate theaccessibility to public spaces such as to local parks, the stores and elementaryschools. Rogers and Sukolratanametee (2009) take into account the physicalfactors that are well-defined centre and edge, mixed-use <strong>of</strong> household and landuses, density <strong>of</strong> neighbourhood and lot sizes, pedestrian walkways that arefriendly in terms <strong>of</strong> distance and networking, and accessibility to public spacesand open spaces. Zhao (2009) considers the physical factors in spatial aspectssuch as architectural-planning space, organization and accessibility <strong>of</strong> space,green space. The physical factors measured in functional aspect are welfare,recreational, commercial, transport services. The physical factors used incontextual aspects are pace <strong>of</strong> life, environmental health and upkeep. Apparicio,Se´guin and Naud (2008) use the physical attributes like housing density,cultural facilities, educational facilities, health services and facilities, sport andrecreational facilities, bank services and other facilities in their studies. Salleh(2008) evaluates other physical components that affect residents’ satisfactionincluding services by the developers, neighbourhood facilities and environment.Karim (2008) quantifies the physical factors <strong>of</strong> community facilities witheducation, grocery shopping, eating, recreation, praying and medical services.Tu and Lin (2008) measure the physical attributes such as density,environmental health, greenness, and subjective attributes such as crowding,security and social relations. In addition, the behavioural perfectives includeresidential mobility, maintenance <strong>of</strong> house and neighbourhood, good relationswith neighbours and participation in neighbourhood activities.Gbakeji and Magnus (2007) evaluate the physical structure <strong>of</strong> theneighbourhood residence in terms <strong>of</strong> nature, mix and intensity <strong>of</strong> land use suchas neighbourhood topography, drainage and microclimate, housing density, landuse compatibility, neighbourhood flood level, vehicular traffic, open spaces andplaygrounds. Greenberg and Crossney (2007) perceive physical neighbourhoodattributes as crime, blight, odours, recreation, heavy traffic, parks and schools.The perceived jurisdictional attributes assessed are such as elected <strong>of</strong>ficials,schools and other services. Ge et al. (2006) and Ge & Hokao (2004) assess thephysical attributes for the neighbourhood quality that include convenience withtransportation and social services, amenity with natural environment, historicalenvironment and living spaces, health with water environment, soundenvironment, air environment and other pollutions, safety from disaster, with5© 2012 by MIP
Norainah Abdul Rahman, Dasimah Omar & Abdul Ghani SallehDeterminant Factors <strong>of</strong> Neighbourhood Qualitytransportation and from crime and facilities in the community. Lee et al. (2006)and Ogu (2002) measure the environmental factors in the neighbourhoodquality namely neighbourhood condition, access road, storm-water drains,maintenance <strong>of</strong> environmental facilities, collection <strong>of</strong> refuse and street lighting.H. Hashim (2005), Omar (2008), Westaway (2006) and Yang et al. (2002),consider the adequacy <strong>of</strong> public facilities and community facilities to persuadethe neighbourhood quality in physical attributes. Chau et al.(2006) and Lee,Ellis, Kweon and Hong (2008) assess the landscaping element provided as agood quality environment <strong>of</strong> the housing and neighbourhood area in physicalissues. Generally, multivariable features are used for the physical factors inevaluating and assessing the neighbourhood quality in most previous research.Based on previous research, the physical factors can be divided into fourcategories which are facilities and services, dwelling, surrounding environmentand accessibility. The facilities and services involve the adequacy andmaintenance <strong>of</strong> social, recreational and educational facilities such as sports,recreational and spare-time facilities; parks, play grounds, green areas, andelementary schools, greenery, naturalness and openness, trash collection andstreet lighting etc. The dwelling features are room size, bathroom size, kitchensize, total usable area <strong>of</strong> the dwelling etc. The surrounding environment wouldbe noise, crowd, air pollution, safety etc. Lastly, accessibility is the convenienceto the city centre, work place, health service and availability <strong>of</strong> shoppingfacilities and municipal services etc.SSocial factors that influence neighbourhood quality are the residents’demographic backgrounds, community interaction and place attachment. Manyresearchers use the socio-demographic variable to evaluate the residents’satisfaction perception on their housing and neighbourhood area. Differentsocio-demographic will give different individual data in the housing andneighbourhood area (Apparicio, et al., 2008). The socio-demographicbackgrounds used by Aiello et al. (2010) and Erkip (2010) are gender, age,income, tenure, length <strong>of</strong> residence. Aiello et al. (2010) utilise sociodemographicindicators that involve persons living together, families composed<strong>of</strong> one member, families composed <strong>of</strong> four members or more, widows orwidowers. Lovejoy et al. (2010) exercise the level <strong>of</strong> education as part <strong>of</strong> sociodemographicbackgrounds. Lee ( 2008) uses variables such as age, education,health, and marriage status in the residents’ satisfaction perception. Rogers andSukolratanametee (2009) use socio-demographic factors like gender, age,number <strong>of</strong> children, household size, level <strong>of</strong> education and race. Tu and Lin(2008) use personal characteristics such as age and gender that are effective© 2012 by MIP 6
PLANNING MALAYSIAJournal <strong>of</strong> the Malaysia <strong>Institute</strong> <strong>of</strong> <strong>Planners</strong> (2012)‘predictors’ <strong>of</strong> residential satisfaction. Barton (2009) uses other sociodemographicvariables namely culture and ethnicity.Community interaction in housing and neighbourhood area is one <strong>of</strong> thesocial factors influencing the residents’ satisfaction in neighbourhood quality.Aiello et al. (2010) use community interaction variables that are related tosocial relation features and context features. Social relation features involvepsychology aspects. On the other hand, context features involve environmentaspects. Mohit et al. (2010) use the relationship <strong>of</strong> the residents and theenvironment in their housing and neighbourhood area for the communityinteraction. Bonaiuto et al. (1999), Bonaiuto et al. (2003, 2006) and Fornara etal. (2010) use variables like social relational features and pace <strong>of</strong> life for thecommunity interaction. Rogers and Sukolratanametee (2009) use the length <strong>of</strong>residency and expected years to live in a neighbourhood to evaluate thecommunity interaction in the housing and neighbourhood area. Zhao (2009)uses the social interaction in evaluating the human aspects that influence theneighbourhood quality. Gbakeji and Magnus (2007) include social relationshipvariables related to the nearness to friends and relations, suitability <strong>of</strong>neighbourhood for raising children, compatibility <strong>of</strong> neighbours, level <strong>of</strong> crimeand other social vices to represent the social dimension <strong>of</strong> the residentialenvironment. Ge and Hokao (2004, 2006) and Ge, et al. (2006) incorporatesocial with the convenience <strong>of</strong> daily life and community. Yang, et al. (2002)integrate social factors as participating in activities together and feeling happywith the neighbourhood. The final social factor influencing the neighbourhoodquality is place attachment. Not many researchers evaluate place attachment intheir studies. Zhao (2009) uses place attachment as a residential attachment. Theresidential attachment variables used in evaluating the neighbourhood qualityare being away, fascination extend and compatibility. Bonaiuto et al. (1999),Bonaiuto et al. (2003, 2006) and Fornara et al. (2010) use variable such asneighbourhood attachment in measuring the neighbourhood quality.The economic factors involved in the provision <strong>of</strong> neighbourhood quality areresidents’ socio-economic backgrounds and economic value in theneighbourhood. Socio-economic includes income and homeownership (Erkip,2010). The socio-economic aspect also involves the residents’ employment,dependence index and old age index (Aiello et al., 2010). The aspect alsoincludes the annual household income and household size (Lovejoy, et al.,2010). It’s also taking into consideration the individual characteristics such ashealth, migration, labour situation, income, and household characteristics which7© 2012 by MIP
PLANNING MALAYSIAJournal <strong>of</strong> the Malaysia <strong>Institute</strong> <strong>of</strong> <strong>Planners</strong> (2012)Omar (2008) measures communal living at low-cost housing inMalaysia by using physical elements. The physical elements are schools,playing fields, religious centres, community halls, recreation areas and librarieswhile the community facilities include secondary and primary schools,community hall, religious centre, business area, shop lots, terminal bus andopen spaces. Omar (2009) assesses the residents’ satisfaction at 10 new townsin Malaysia on physical, social and economic aspects. The physical aspects arereligious centres, electricity supply, water supply telephone service, primaryschools, secondary schools, open space facilities, children's playgrounds,commercial service, entertainment centres and public transport services. Theeconomic aspect is based on the price <strong>of</strong> the house and rental value. The socialaspects are their feeling about living in new towns, feeling safe and safety <strong>of</strong>property and the beauty <strong>of</strong> the surrounding area. Mohit et al. (2010) evaluateresidential satisfaction in a newly designed public low-cost housing in KualaLumpur, Malaysia in terms <strong>of</strong> the physical features. The physical features focuson five main variables which are dwelling unit features, dwelling unit supportservices, public facilities, social environment and the distance to theneighbourhood facilities. The dwelling unit comprises living area, dining space,kitchen space, bedroom-1, bedroom-2, bedroom-3, toilet, bathroom, dry area,socket, and house ventilation. The dwelling unit support services includecorridor, staircase, and lift, fire fighting, cleanliness <strong>of</strong> drain, street lighting,garbage collection and cleanliness <strong>of</strong> garbage house. The public facilities lookinto the open space or play area, car or motorcycle parking, prayer hall, multipurposehall, perimeter road, pedestrian walkways, public phone, local shops,and food stalls. The social environment stresses on noise level, accidentsituation, crime situation, security control and community relations. Theneighbourhood facilities evaluate the distances to the nearest town centre, workplace, school, police station, hospital, shopping centre, market, publiclibrary, worship building, Light Railway Transit (LRT) Station, bus stationand fire station.Leby and Hashim (2010) quantify the residents’ perception onneighbourhood liveability attributes at Subang Jaya Municipal Councilneighbourhood by making use <strong>of</strong> physical and social attributes. The Physicalattributes are the maintenance <strong>of</strong> streets, rubbish collection service, groundvibration by traffic, noise by heavy traffic, maintenance <strong>of</strong> open spaces, andupkeep <strong>of</strong> neighbourhoods’ lighting. The social attributes are the behaviour <strong>of</strong>neighbours, relationship with neighbours, sociability <strong>of</strong> people, sense <strong>of</strong>community, cordiality <strong>of</strong> people, and friendship with people and close distanceto friends. Mohit and Nazyddah (2011) evaluate the residents’ satisfaction onsocial housing programme in Malaysia by using the physical and social features.9© 2012 by MIP
Norainah Abdul Rahman, Dasimah Omar & Abdul Ghani SallehDeterminant Factors <strong>of</strong> Neighbourhood QualityThe physical features are housing unit, housing unit support, public facilities,and social environment and neighbourhood facilities. The economic feature isthe household characteristic <strong>of</strong> the residents. Karim (2012) examines thequality <strong>of</strong> life for the lower income residents in planned housing areas in ShahAlam Selangor on the physical and social components. The physicalcomponents are the community facilities environment and the neighbourhoodphysical environment. The social components are the family domain and thesocial environment. Tan (2012) evaluates the housing satisfaction in mediumand high cost housing in Kuala Lumpur by utilizing the physical and economicelements. The physical elements are housing characteristic and housing deliverysystem. The economic elements are homeownership and socio-economiccharacteristic. Salleh (2012) assesses the residential satisfaction in Terengganuand Penang by concentrating on the physical features. The physical featuresare the dwelling unit, services by the developers and neighbourhood facilities.Another study <strong>of</strong> the household study in an urban area in Penang measures theresidents’ satisfaction on physical, social and economic features.N L SINMany researchers have expended their research using the multivariable tosuggest the criteria for a good neighbourhood quality. Previous research hasshown that the neighbourhood quality can be influenced by physical, social andeconomic factors. Physical factors can be divided into four categories namelydwelling unit, facilities and services, accessibility and surrounding environment.The physical aspects are evaluated by the adequacy, amenity, attractive,convenience, defensible space, good infrastructure, homogeneity, immediate,maintenance, pedestrian friendly, quiet, upkeep, well-defined, accessibility,location, distance, nearness, safety, security, crowding, noise, odours,environmental health and natural environment. The social factors can beseparated in terms <strong>of</strong> socio-demographic, social community and placeattachment. The socio-demographic <strong>of</strong> the residents will influence socialcommunity and social interaction. Social community comprises communityorganization, human aspects and social relationship. While place attachmentconsists <strong>of</strong> neighbourhood and residential attachment, neighbourhood andresidential context, neighbourhood and residential social setting, social image <strong>of</strong>neighbours, social environment, social formation, social welfare, pace <strong>of</strong> life,safety community and liveliness. The economic factors on the other hand, arerelated to the residents’ socio-economic pr<strong>of</strong>ile background.© 2012 by MIP 10
PLANNING MALAYSIAJournal <strong>of</strong> the Malaysia <strong>Institute</strong> <strong>of</strong> <strong>Planners</strong> (2012)NSAiello, A., Ardone, R. G., & Scopelliti, M. (2010). Neighbourhood PlanningImprovement: Physical Attributes, Cognitive and Affective Evaluationand Activities in Two Neighbourhoods in Rome. Evaluation andProgram Planning(33), 264-275.Apparicio, P., Se´guin, A.-M., & Naud, D. (2008). The Quality <strong>of</strong> the UrbanEnvironment Around Public Housing Buildings in Montre´al: AnObjective Approach Based on GIS and Multivariate StatisticalAnalysis. Social Indicators Research, 86, 355-380.Barton, H. (2005). A Health Map for Urban Llanners Towards a ConceptualModel for Healthy, Sustainable Settlements. Built Environment, 31(4).Barton, H. (2009). Land Use Planning and Health and Well-Being. Land UsePolicy, (26S), S115-S123.Blum, A., & Grant, M. (2006). Sustainable Neighbourhoods: Assessment Toolsfor Renovation and Developmen. Journal <strong>of</strong> International ResearchPublications: Ecology and Safety, 1, 37-54.Bonaiuto, M., Aiello, A., Perugini, M., Bonnes, M., & Ercolani, A. P. (1999).Multidimensional Perception <strong>of</strong> Residential Environment Quality andNeighbourhood Attachment in the Urban Environment. Journal <strong>of</strong>Environmental Psychology(19), 331-352.Bonaiuto, M., Fornara, F., & Bonnes, M. (2003). Indexes <strong>of</strong> PerceivedResidential Environment Quality and Neighbourhood Attachment inUrban Environments: A Confirmation Study on the City Of Rome.Landscape and Urban Planning(65), 41-52.Bonaiuto, M., Fornara, F., & Bonnes, M. (2003). Indexes <strong>of</strong> PerceivedResidential Environment Quality and Neighbourhood Attachment inUrban Environments: A Confirmation Study on the City Of Rome.Landscape and Urban Planning, (65), 41-52.Bonaiuto, M., Fornara, F., & Bonnes, M. (2006). Perceived ResidentialEnvironment Quality in Middle and Low-Extension Italian Cities.Revue Européenne De Psychologie Appliquée(56), 23-34.Bonaiuto, M., Fornara, F., & Bonnes, M. (2006). Perceived ResidentialEnvironment Quality in Middle and Low-Extension Italian Cities.Revue Européenne De Psychologie Appliquée, (56), 23-34.Chau, C. K., Yung, H. K., Leung, T. M., & Law, M. Y. (2006). Evaluation <strong>of</strong>Relative Importance <strong>of</strong> Environmental Issues Associated With aResidential Estate in Hong Kong. Landscape and Urban Planning(77),67-79.11© 2012 by MIP
Norainah Abdul Rahman, Dasimah Omar & Abdul Ghani SallehDeterminant Factors <strong>of</strong> Neighbourhood QualityCorcoran, M. P. (2002). Place Attachment and Community Sentiment inMarginalised Neighbourhoods: A European Case Study. CanadianJournal <strong>of</strong> Urban Research, 11(1), 201-221.Erkip, F. (2010). Community and Neighborhood Relations in Ankara: AnUrban–Suburban Contrast. Cities, (27), 96-102.Fornara, F., Bonaiuto, M., & Bonnes, M. (2010). Cross-Validation <strong>of</strong>Abbreviated Perceived Residential Environment Quality (PREQ) andNeighborhood Attachment (NA) Indicators. Environment and Behavior,42(2), 171-196.Galster, G., Cutsinger, J., & Lim, U. (2007). Are Neighbourhoods Selfstabilising?Exploring Endogenous Dynamics. Urban Studies, 44(1),167-185.Gbakeji, J. O., & Magnus, O. O. (2007). Aspects <strong>of</strong> Residential andNeighbourhood Preferences in the Warri Metropolis, Delta State,Nigeria. Studies Home Communication Science, 1(12), 121-126.Ge, J., Chen, F., Wang, J., & Hokao, K. (2006). Residential EnvironmentEvaluation Model Considering Residential Preference in ChangjiangDelta Region <strong>of</strong> China. Paper presented at the International Symposium<strong>of</strong> Lowland Technology.Ge, J., & Hokao, K. (2004). Residential Environment Index System andEvaluation Model Established by Subjective and Objective Methods.Journal Of Zhejiang University Science, 5(9), 1028-1034.Ge, J., & Hokao, K. (2006). Research on Residential Lifestyles in JapaneseCities from the Viewpoints <strong>of</strong> Residential Preference, ResidentialChoice and Residential Satisfaction. Landscape and Urban Planning,(78), 165-178.Goetz, E. G. (2010). Better Neighborhoods, Better Outcomes? ExplainingRelocation Outcomes in HOPE VI. A Journal <strong>of</strong> Policy Developmentand Research, 12(1), 5-32.Greenberg, M. (1998). Age, Perceptions, and Neighborhood Quality: AnEmpirical Test. Human Ecology Review, 5(2), 10-18.Greenberg, M., & Crossney, K. (2007). Perceived Neighborhood Quality in theUnited States: Measuring Outdoor, Housing and JurisdictionalInfluences. Socio-Economic Planning Sciences, (41), 181-194.Hashim, A. H. (2003). Residential Satisfaction and Social Integration in PublicLow Cost Housing in Malaysia. Pertanika Journal Social Science &Huminities, 11(1), 1-10.Hashim, H. (2005). Harmonious Community Living in Urban Neighbourhoods:A Case <strong>of</strong> Central Shah Alam. Paper presented at the 8th InternationalConference <strong>of</strong> the Asian Planning Schools Association.© 2012 by MIP 12
PLANNING MALAYSIAJournal <strong>of</strong> the Malaysia <strong>Institute</strong> <strong>of</strong> <strong>Planners</strong> (2012)Hur, M., Nasar, J. L., & Chun, B. (2010). Neighborhood Satisfaction, Physicaland Perceived Naturalness and Openness. Journal <strong>of</strong> EnvironmentalPsychology(30), 52-59.Jones, E. J. (2001). Liveable Neighbourhoods. World Transport Policy &Practice, 7(2), 38-43.Karim, H. A. (2008). The Satisfaction <strong>of</strong> Residents on Community Facilities inShah Alam, Malaysia. Asian Social Science, 4(11), 131-137.Karim, H. A. (2012). Low Cost Housing Environment: Compromising Quality<strong>of</strong> Life? Procedia - Social and Behavioral Sciences, 35, 44-53.Kim, S. Y., Nair, R., Knight, G. P., Roosa, M. W., & Updegraff, K. A. (2008).Measurement Equivalence <strong>of</strong> Neighborhood Quality Measures forEuropean American and Mexican American Families. JournalCommunity Psychology, 37(1), 1-20.Leby, J. L., & Hashim, A. H. (2010). Liveability Dimensions and Attributes:Their Relative Importance in the Eyes <strong>of</strong> Neighbourhood Residents.Journal <strong>of</strong> Construction in Developing Countries, 15(1), 67-91.Lee, L. M., Abdullah, A., Tan, S. F., Badrulzaman, N., & Hassan, A. S. (2006).How We Failed to Plan for Habitatability. Journal <strong>of</strong> the <strong>Malaysian</strong><strong>Institute</strong> <strong>of</strong> <strong>Planners</strong>, 4, 1-21.Lee, S. W., Ellis, C. D., Kweon, B. S., & Hong, S. K. (2008). Relationshipbetween Landscape Structure and Neighborhood Satisfaction inUrbanized Areas. Landscape and Urban Planning, 85, 60-70.Lee, Y. J. (2008). Subjective Quality <strong>of</strong> Life Measurement in Taipei. Buildingand Environment(43), 1205-1215.Leerkes, A., & Bernasco, W. (2010). The Spatial Concentration <strong>of</strong> IllegalResidence and Neighborhood Safety. Journal <strong>of</strong> Urban Affairs, 32(3),367-392.Lotfi, S., & Koohsari, M. J. (2009). Measuring Objective Accessibility toNeighborhood Facilities in the City (A Case Study: Zone 6 in Tehran,Iran). Cities, 26, 133-140.Lovejoy, K., Handy, S., & Mokhtarian, P. (2010). Neighborhood Satisfaction inSuburban versus Traditional Environments: An Evaluation <strong>of</strong>Contributing Characteristics in Eight California Neighborhoods.Landscape and Urban Planning, 97, 37-48.Martin, D. G. (2003). Enacting Neighborhood. Urban Geography, 24(5), 361-385.Martinez, M. L., Black, M., & Starr, R. H. (2002). Factorial Structure <strong>of</strong> thePerceived Neighborhood Scale (PNS): A Test <strong>of</strong> LongitudinalInvariance. Journal <strong>of</strong> Community Psychology, 30(1), 23-43.13© 2012 by MIP
Norainah Abdul Rahman, Dasimah Omar & Abdul Ghani SallehDeterminant Factors <strong>of</strong> Neighbourhood QualityMeegan, R., & Mitchell, A. (2001). ‘It’s Not Community Round Here, It’sNeighbourhood’: Neighbourhood Change and Cohesion in UrbanRegeneration Policies. Urban Studies, 38(12), 2167-2194.Mohit, M. A., Ibrahim, M., & Rashid, Y. R. (2010). Assessment <strong>of</strong> ResidentialSatisfaction in Newly Designed Public Low-Cost Housing in KualaLumpur, Malaysia. Habitat International(34), 18-27.Mohit, M. A., & Nazyddah, N. (2011). Social Housing Programme <strong>of</strong> SelangorZakat Board. Journal Housing and the Built Environment, 26, 143-164.Ogu, V. I. (2002). Urban Residential Satisfaction and the Planning Implicationsin a Developing World Context: The Example <strong>of</strong> Benin City, Nigeria.International Planning Studies, 7(1), 37-53.Omar, D. (2008). Communal Living Environment in Low Cost HousingDevelopment in Malaysia. Asian Social Science, (10), 98-105.Omar, D. (2009). Assessing Residents’ Quality <strong>of</strong> Life in <strong>Malaysian</strong> NewTowns. Asian Social Science, 5(6), 94-201.Pacione, M. (2003). Urban Environmental Quality and Human Wellbeing - ASocial Geographical Perspective. Landscape and Urban Planning, 65,19-30.Power, A. (2004). Neighbourhood Management and the Future <strong>of</strong> Urban Areas.Houghton Street, London: Centre for Analysis <strong>of</strong> Social ExclusionLondon School <strong>of</strong> Economics.Rogers, G. O., & Sukolratanametee, S. (2009). Neighborhood Design and Sense<strong>of</strong> Community: Comparing Suburban Neighborhoods in Houston Texas.Landscape and Urban Planning(92), 325-334.Salleh, A. G. (2008). Neighbourhood Factors in Private Low-Cost Housing inMalaysia. Habitat International(32), 485-493.Salleh, A. G. (2012). Sustainable Urban Neighbourhoods: The Need to ConsiderResidents' Satisfaction International Journal <strong>of</strong> SustainableDevelopment, 3(10), 103-108.Scorbureanu, A. I., & Scorbureanu, I. (2012). Neighborhood QualityDeterminants. Empirical Evidence from the American Housing Survey.Review <strong>of</strong> Applied Socio- Economic Research, 13, 153-161.Serrano, L. D. (2009). Disentangling the Housing Satisfaction Puzzle: DoesHomeownership Really Matter? Journal <strong>of</strong> Economic Psychology(30),645-755.Tan, T. H. (2012). Housing Satisfaction in Medium- and High-Cost Housing:The case <strong>of</strong> Greater Kuala Lumpur, Malaysia. Habitat International,36, 108-116.Theodori, G. L. (2001). Examining the Effects <strong>of</strong> Community Satisfaction andAttachment on Individual Well-Being. Rural Sociology, 66(4), 618-628.© 2012 by MIP 14
PLANNING MALAYSIAJournal <strong>of</strong> the Malaysia <strong>Institute</strong> <strong>of</strong> <strong>Planners</strong> (2012)Tu, K. J., & Lin, L. T. (2008). Evaluative Structure <strong>of</strong> Perceived ResidentialEnvironment Quality in High-Density and Mixed-Use Urban Settings:An Exploratory Study on Taipei City. Landscape and UrbanPlanning(87), 157-171.Westaway, M. S. (2006). A Longitudinal Investigation <strong>of</strong> Satisfaction withPersonal and Environmental Quality Of Life in an Informal SouthAfrican Housing Settlement, Doornkop, Soweto. Habitat International,(30), 175-189.Yang, M. J., Yang, M. S., Shih, C. H., & See, I. K. (2002). Development andValidation <strong>of</strong> an Instrument to Measure Perceived NeighbourhoodQuality in Taiwan. Journal <strong>of</strong> Epidemiology and Community Health,56(7), 492-496.Zhao, K. (2009). The Relationships between Perceived Residential EnvironmentQuality and Perceived Restoration in Urban Residents. Paper presentedat the The 1st International Conference on Information Science andEngineering (ICISE2009).15© 2012 by MIP
Norainah Abdul Rahman, Dasimah Omar & Abdul Ghani SallehDeterminant Factors <strong>of</strong> Neighbourhood Quality© 2012 by MIP 16
PLANNING MALAYSIAM y I PLA I NS IP N A IA I NS G I LAYAN GLA YS A Ay P yAIN I N© 2012 by MIP
Saniah Ahmad Zaki & Jamalunlaili AbdullahThe Relationship Between Variations <strong>of</strong> Grid Layout and Burglarybased on their routine paths, which apparently are the highly accessible streetsthat are actively used by people. Beavon et al. also implied there are certainlocations in which crime is likely to be concentrated.Two other influential works were that <strong>of</strong> J. Jacobs (1961) and O.Newman (1972). Both identified characteristics <strong>of</strong> streets that are at risk tocrime and streets that are safer, but with conflicting explanations. But, in a morerecent study by Hillier and Shu (2000) using space syntax, they not only showedthat crime is influenced by environment (spaces in residential areas) they alsoindicated the features in urban layouts that affected the uneven distribution <strong>of</strong>burglary. They found that the degree <strong>of</strong> integration <strong>of</strong> spaces in the layoutsseems to correspond to the type <strong>of</strong> layout; the traditional layout has moreintegrated spaces, while the more broken-up layout has less integrated spaces.The traditional grid-iron layout was reported to start way back in the fifthcentury BC when Hippodamus drew up Miletus City plan thought to be themost practical urban planning scheme. Since then, grid-iron became a regularfeature in the planned cities <strong>of</strong> the Greeks as well as the Romans and in Spain.Various forms <strong>of</strong> grids from the rectangular block, the parallel grids andothers were also reported to be introduced in cities way back in the 1900.Although these forms mainly contain linear and continuous street type, andallow through movement, they differ in length. In some, the streets are longer,more continuous and less breaks, in others they are shorter and as such morebreaks. Later, when other forms <strong>of</strong> street pattern example cul-de-sacs and loopswere introduced, residential layouts appear to have lesser continuous, linear andthrough streets. The difference in forms between the earlier and later layouts isits degree <strong>of</strong> permeability. In the former, the layout is more permeable and itencouraged through movement; whereas in the latter, it is less permeable orimpermeable, and restricts through movement. Street pattern not only seems todetermine the shape and type <strong>of</strong> an area particularly residential layout, but mostimportantly the movements within a layout.Although there have been studies that investigated how far these streetpatterns influenced movement <strong>of</strong> people, there are others who looked at abroader dimension, the environment, and how it relates to crime distribution asmentioned earlier. Some have also examined the relationship <strong>of</strong> the streetpatterns (or street layouts) and crime. It appears from a study by Shu (2000) in aform <strong>of</strong> a PhD thesis that looked at the relationship between space and crime invarious types <strong>of</strong> residential layouts, a safer layout would be one that haveinterconnected or integrated through streets, with dwellings facing out on to© 2012 by MIP
PLANNING MALAYSIAJournal <strong>of</strong> the Malaysia <strong>Institute</strong> <strong>of</strong> <strong>Planners</strong> (2012)both sides <strong>of</strong> the streets. Shu implicated that grid-like layouts appeared to besafer compared to tree-like layout that consists mainly cul-de-sacs and are morebroken-up. The question is: If grid-like layout appeared safer would differentvariations <strong>of</strong> grid layout (i.e. from pure grid to the impure grid) still work toreduce vulnerability to burglary?A research investigated the distribution <strong>of</strong> burglary in a <strong>Malaysian</strong>township that comprises mainly grid-like residential layout. By using spacesyntax, this study extended the past study into how each aspects <strong>of</strong> designinteracted to influence burglary distribution in various grid-like layouts.LI A IThe most influential work in looking at the relationship between street patternsand crime has been that <strong>of</strong> Jane Jacobs (1961), who identified the characteristics<strong>of</strong> streets that are more at risk to crime and streets that are safer. Jacobsobserved that streets in which there were more activities and more people,strangers and residents, crime was lower. The design <strong>of</strong> these streets asobserved by Jacobs are more <strong>of</strong> a traditional, street-based (grid layout), in whichthe strangers (passers-by) acted as casual surveillance. She also noted theorientation <strong>of</strong> buildings along these streets was onto the streets. According toJacobs, this allowed the owners <strong>of</strong> the buildings to set their ‘eyes on the street’.By having the entrance <strong>of</strong> buildings onto streets, it indicated the importance <strong>of</strong>generating intervisibility amongst buildings along the streets. Whereas in partswhere there were fewer people and lesser activities, such as those with a moresuburban characteristic, she observed that crime was higher.Contradictory to Jacobs is the work by Oscar Newman (1972) who alsoattempted to show the relationship between crime and environment but withconflicting explanations. Newman believed that in a neighbourhood where thestreets are controlled and owned by residents, there is virtually very little crime.He also explained that because the streets are private, any strangers areconsidered as intruders and are as such they are to be under constantsurveillance. Hillier and Sahbaz (2008) also reported that Newman finds toomany people in spaces create anonymity and allows criminals to access theirvictims, which will weaken the possibility <strong>of</strong> residents to control their ownenvironment. A more recent study by Hillier and Shu (2000) using space syntax,not only showed that crime is influenced by environment (spaces in residentialareas) they also indicated the features in urban layouts that affected the unevendistribution <strong>of</strong> burglary. They looked at how different types <strong>of</strong> layouts and19© 2012 by MIP
Saniah Ahmad Zaki & Jamalunlaili AbdullahThe Relationship Between Variations <strong>of</strong> Grid Layout and Burglarystreets have influenced burglary rate. They found that the degree <strong>of</strong> integration<strong>of</strong> spaces in the layouts seems to correspond to the type <strong>of</strong> layout; the traditionallayout has more integrated spaces, while the more broken-up layout has lessintegrated spaces. These findings seem to agree with Jacobs’ observation.Hillier and Shu’s study concluded with three main points: first, crimetends to seek the most vulnerable type <strong>of</strong> space within an area. Second, for anarea to be safe, it depends on the co-presence <strong>of</strong> a group <strong>of</strong> factors, which arethe positioning in the overall layout and the immediate surroundings <strong>of</strong> thedwelling. Finally, there are factors which can reduce crime in a layout but canincrease it if other factors are present (Hillier and Shu, 2000). Havingestablished the conclusions, they deduced that a safer layout would be one thathave interconnected or integrated through streets, with dwellings facing out onto both sides <strong>of</strong> the streets.S A M L GYThe question: would different variations <strong>of</strong> grid layout (i.e. from pure grid to theimpure grid) still work to reduce vulnerability to burglary. To answer thisquestion, a study was conducted which investigated the spatial distribution <strong>of</strong>burglary in grid-like layouts at two-levels: the area and the street. The first levelexamined why there were variations in the spatial distribution <strong>of</strong> burglarybetween grid-like residential layouts. The second level was at a finer scale,which were the street segments; individual dwelling and its immediateenvironments. At this second level analysis, the local factors that influencedwellings vulnerability were investigated. Nonetheless, in this paper only thefindings <strong>of</strong> the first level analyses are presented.Six residential areas were selected randomly within a Local Authorityarea located in the Petaling District <strong>of</strong> Selangor. These areas are <strong>of</strong> varyingdegrees <strong>of</strong> grid layouts, from the pure grid with mainly linear through streets tothe impure grids with some cul-de-sacs. An inventory questionnaire usedconsisted <strong>of</strong> five sections was designed to address the question. The first sectioncontains five questions capturing the house pr<strong>of</strong>ile such as type <strong>of</strong> house, type<strong>of</strong> door, location <strong>of</strong> house entrance, location <strong>of</strong> house in a row, and number <strong>of</strong>sides <strong>of</strong> house exposed on to the space. The second section determining theavailability <strong>of</strong> situational factors such as alarm outside the property, thepresence <strong>of</strong> CCTV, occupancy <strong>of</strong> the house, grills on doors, grills on windows,and form <strong>of</strong> deterrents (e.g. dogs or membership <strong>of</strong> neighbourhood watch). The© 2012 by MIP 20
PLANNING MALAYSIAJournal <strong>of</strong> the Malaysia <strong>Institute</strong> <strong>of</strong> <strong>Planners</strong> (2012)third section, explores the visibility <strong>of</strong> house front, which includes the quality <strong>of</strong>visibility <strong>of</strong> the house front measured using a 5-point Likert scale from 1 = verypoor to 5 = excellent. The assessment as to the degree <strong>of</strong> visibility <strong>of</strong> housefront was further established by identifying availability <strong>of</strong> features that concealthe front, the form <strong>of</strong> features, fencing material, and fencing height. The fourthand final sections look at the side and back <strong>of</strong> the burgled house respectively.Each <strong>of</strong> the sections determines how the side and back <strong>of</strong> the house is exposed,its accessibility from the side and back lanes, as well as the availability andforms <strong>of</strong> climbing elements that could have provided easy entry to burglars.A total <strong>of</strong> 1228 houses were recorded <strong>of</strong> which 380 (31%) were burgledhouses and 848 (69%), non-burgled houses. The burgled houses were based onPolice records between the years 2006 to 2008. Non-burgled houses situated onboth sides <strong>of</strong> the burgled houses (and in some cases opposite <strong>of</strong> the burgledhouses) were also selected for the inventory. The purpose was to compare andexamined why some houses are more vulnerable and others safer. However, thecomparison between burgled and non-burgled houses is not discussed in thispaper. The study used space syntax as a tool that allows spaces in the grid-likelayouts to be analysed quantitatively and compared with other quantitativevariables. GIS (geographical information system) was also used to provide thedatabase for spatial data and also to map the precise location <strong>of</strong> burglaries.Based on this map, the spatial concentration <strong>of</strong> burglaries was examined inrelation to the streets in the areas. A simple statistics, regression plots andANOVA were used to explore the relationship between burglary rate and spatialfactors and syntactical variables using Statview statistical s<strong>of</strong>tware.Space syntax is a set <strong>of</strong> techniques for representing and analysing streetnetworks <strong>of</strong> cities in such a way as to bring to light underlying patterns andstructures which influence patterns <strong>of</strong> activity in space, most notably movementand land use (Hillier and Sahbaz, 2008). Before the case study areas could beanalysed, an axial map (a space syntax line map) was first produced. The axialmap <strong>of</strong> the six case study areas (Appendix 1), in which the streets or spaces(represented as lines) in an area, were drawn and then processed in a spacesyntax s<strong>of</strong>tware (example Axman). Axial maps when processed will producecoloured lines from the warmer colours (red) through the cooler colours (blue).These coloured lines indicate the integration level <strong>of</strong> spaces based on itsmovement potentials. A red coloured line indicates that it is the most integratedspace and a blue line, the least integrated. The global integration level(represented as radius n), measures each line in relation to the whole system,and the local integration level (represented as radius 3), measures thecomplexity <strong>of</strong> lines up to three steps away from the line. Besides the integration21© 2012 by MIP
Saniah Ahmad Zaki & Jamalunlaili AbdullahThe Relationship Between Variations <strong>of</strong> Grid Layout and Burglarylevels <strong>of</strong> spaces, other syntactical variables can also obtained. These include:connectivity, intelligibility, and synergy. Connectivity refers to the degree <strong>of</strong>connections <strong>of</strong> each line to another; intelligibility is the relationship between theglobal integration and connectivity that shows how well residents and visitorsare able to understand in moving in and out <strong>of</strong> an area; and synergy <strong>of</strong> a layout(local-to-global), is the measure <strong>of</strong> co-presence between residents and strangersin the area. Burglary data <strong>of</strong> three years (2006 – 2008) provided by the<strong>Malaysian</strong> Royal Police Force (PDRM), was mapped as dots onto axial map.But, in complying with the confidentiality <strong>of</strong> the burglary data, the study areashave been anonymised and named as Areas 1, 2, 3, 4, 5, and 6.AS S Y A ASThe case study areas are located within a local authority area in the KlangValley. These areas, which are socio-economically homogenous, are all laid outin different variations <strong>of</strong> grid, that is from the more pure grid to the lesser pureor impure grid. The inherent features <strong>of</strong> the layouts are that they generallyconstitute through, linear streets and in some areas with very few cul-de-sacs.Houses that are mainly terraced tend to line up the streets with front <strong>of</strong> thehouses facing onto the local roads and the back onto back lanes.The roads are arranged hierarchically, linking the local roads to the mainroad. Although this arrangement may be common in <strong>Malaysian</strong> residentiallayouts, in some, the hierarchical layout are more prominent than others. Areas5 and 6 are examples <strong>of</strong> areas with such layout compared to the other areas.These varied hierarchies relates to permeability <strong>of</strong> the layouts. Areas with moredirect access to the main roads tend to be more permeable than those that haveless direct access and are also more hierarchical.In considering these features, the areas are indexed based on a 4-pointscale as follows:© 2012 by MIP 22
PLANNING MALAYSIAJournal <strong>of</strong> the Malaysia <strong>Institute</strong> <strong>of</strong> <strong>Planners</strong> (2012)Characteristics<strong>of</strong> areasAreaA layout,which isentirely basedon long linearthrough streetswith veryregular sizedblocks, is mostpermeable.Area 1Index: 1A layout whichis based on amixed <strong>of</strong> longand short linearthrough streets,as well as amixed sizedblocks,Area 2Index: 223© 2012 by MIP
Saniah Ahmad Zaki & Jamalunlaili AbdullahThe Relationship Between Variations <strong>of</strong> Grid Layout and BurglaryA layout <strong>of</strong>regular blockswith linearstreets that isarranged in aloop pattern.Area3Index: 3Area5© 2012 by MIP 24
PLANNING MALAYSIAJournal <strong>of</strong> the Malaysia <strong>Institute</strong> <strong>of</strong> <strong>Planners</strong> (2012)Area 6A layout thathas very fewlinear throughstreets butmostly cul-desacs.Area 4Index: 425© 2012 by MIP
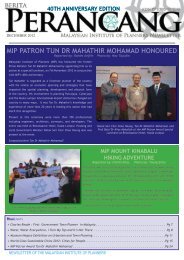
Saniah Ahmad Zaki & Jamalunlaili AbdullahThe Relationship Between Variations <strong>of</strong> Grid Layout and BurglaryFINDINGSi. At the area levela. Relationship between characteristics <strong>of</strong> areas and burglary rateAt this level the variations in the spatial distribution <strong>of</strong> burglary in residentialareas was first examined. This was done by comparing the relationship <strong>of</strong>burglary rate with spatial characteristics between areas. For this purposeburglary rate was calculated based on the number <strong>of</strong> burglary per one thousand(1000) houses. A data table <strong>of</strong> six case study areas was constructed, that includespatial pattern type, degree <strong>of</strong> connectivity, total number <strong>of</strong> houses, breakdown<strong>of</strong> house type, permeability index, and three-year period burglary data (Table 1).The table shows that out <strong>of</strong> the six areas, three (Areas 1, 2 and 3) havemore than 20 burglaries per 1000 houses and the other three (Areas 4, 5 and 6)have less than 20 burglaries per 1000 houses. Why are some areas safer withlower burglary rate but others higher? Although, it may initially appear thatareas with spatial characteristics indexed on a scale <strong>of</strong> 1 and 2 (from veryregular layout to less regular) has higher burglary rate, Area 3 that is indexed ona scale <strong>of</strong> 3 has also high burglary rate. Ironically, Areas 5 and 6 which are alsospatially indexed on the scale <strong>of</strong> 3, have lower burglary rates. Similarly, thedegree <strong>of</strong> grid when visually analysed does not appear to be related to burglaryrate. Among three areas indexed as 4 (partially impure grid), Area 3 has highburglary rate, whereas the other two areas (Areas 4 and 6), lower rate. In aregression analysis, it is shown that the degree <strong>of</strong> grid is moderately related toburglary rate (Figure 1) with an r-squared <strong>of</strong> 0.451. Nonetheless the p-value inthe ANOVA table indicates that the relationship is weakly significant.© 2012 by MIP 26
PLANNING MALAYSIAJournal <strong>of</strong> the Malaysia <strong>Institute</strong> <strong>of</strong> <strong>Planners</strong> (2012)Figure 1: Relationship between burglary rate and degree <strong>of</strong> gridness27© 2012 by MIP
Saniah Ahmad Zaki & Jamalunlaili AbdullahThe Relationship Between Variations <strong>of</strong> Grid Layout and BurglaryWhen the type <strong>of</strong> houses in the areas was next compared to burglaryrates, it appears to indicate that areas constituting <strong>of</strong> only terraced houses(100%) have lower burglary rates compared to those with mixed type <strong>of</strong> housesexample in Areas 1, 2 and 3, where there are mixed <strong>of</strong> terraced and detachedhouses. The study then attempted to find if permeability index is calculated,which is the sum between the spatial pattern and scale <strong>of</strong> grid, could it berelated to burglary rate. Hillier and Shu (2000) have suggested that the moreopen and permeable layout with through streets that facilitate continuouspedestrian and vehicle movements are less at risk to burglary than a layoutwhich is more broken-up, closed and impermeable. Looking at the table itseems to implicate that only two areas (Areas 1 and 2) that have higher degree<strong>of</strong> permeability also have high burglary rate; and areas with lower degree <strong>of</strong>permeability lower burglary rate (Areas 4 and 5). However, in two other areas(Areas 3 and 6) their permeability indices do not seem to relate to burglary rate.It looks as if permeability <strong>of</strong> the case study areas (<strong>Malaysian</strong> residential layouts)affects burglary differently from that in a Western country.Thus, it seems to suggest that at the area level, only housing type appearsrelated to burglary rate. Areas appeared to be safer if the housing type ishomogenous. In a study by Bowers, Johnson and Pease (2005), they found thatareas with homogenous housing are less targeted by burglars compared to areaswith heterogeneous housing. They further noted that terraced houses with twosides exposed (front and back <strong>of</strong> house) are less at risk compared to detachedhouses that have more windows and doors (more sides exposed). These findingsseems consistent with the findings in a study by Hillier and Shu (2000), inwhich they described the terraced houses as having less exposure (at least twosides) onto the spaces provides less opportunity to burglars compared todetached houses that have four sides exposed allowing more opportunities toburglars to enter a property.However, when regression analysis was performed, the result suggests aweak relationship between terraced houses and burglary rate with p-value thatindicates weakly significant. As pointed by Hillier and Shu (2000), the copresence<strong>of</strong> a group <strong>of</strong> factors would determine the safety <strong>of</strong> an area, whichwould prove difficult at the area level.© 2012 by MIP 28
PLANNING MALAYSIAJournal <strong>of</strong> the Malaysia <strong>Institute</strong> <strong>of</strong> <strong>Planners</strong> (2012)Table 1: The data table below illustrates a summary <strong>of</strong> the characteristics <strong>of</strong> the six case study areasArea Spatial Scale <strong>of</strong> Total no. <strong>of</strong> House Type Spatial + Bur Bur RatePattern gridness houses Terrace Detach Gridness1 1 1 4439 4035 (90.9%) 404 (9.10%) 2 142 322 2 3 2728 1139 (41.75%) 1589 (58.25%) 5 64 233 3 4 2083 1647 (79.07%) 436 (20.93%) 7 62 304 4 4 1442 1442 (100%) - 8 26 185 3 5 4057 4057 (100%) - 8 66 166 3 4 1581 1581 (100%) - 7 18 11Note:1. Area: six areas that are socially homogenous, selected within one LocalAuthority area.2. Spatial pattern: street layout indexed from 1 to 4 indicating degree <strong>of</strong> throughroads in an area; pattern 1 for most regular with mainly linear through streetover pattern 2 that are less regular with mixed through roads, to pattern 4 thatare mainly cul-de-sacs3. Scale <strong>of</strong> gridness: degree <strong>of</strong> grid is indexed based on the mean connectivity<strong>of</strong> areas; from 1 for very pure grid through to 5 for impure grid4. Total housese: number <strong>of</strong> houses in each areas5. House type: number and percentage <strong>of</strong> each house type in each area: Terr(terraced); SD (demi-detached); Det (detached)6. Spatial + gridness: sum <strong>of</strong> spatial type index and degree <strong>of</strong> grid with lowestvalue for highest degree <strong>of</strong> permeability and highest value for lowest degree<strong>of</strong> permeability7. Bur: number <strong>of</strong> domestic burglary8. Bur rate: number <strong>of</strong> burglary per 1000 houses based on three year period(2006 - 2008) for each areab. Relationship between spatial syntactic properties and burglary rateThe study next examined the relationship between burglary rate and spatialsyntactic variables <strong>of</strong> the six grid-like layouts. A visual analysis <strong>of</strong> thesevariables compared with the burglary rate appears to indicate that Area 1 ismost vulnerable to burglary because: it is highly integrated to the whole systemas well as to its surroundings; within the area its streets (or spaces) are alsohighly connected; and its high synergy value that suggests a high degree <strong>of</strong> copresencebetween residents and strangers in the area (Table 2). The lessvulnerable areas (with lower burglary rates) appear to be less integrated bothglobally and locally; the streets are less connected, and, thus, lower synergyvalue. This pattern also can be visually analysed in the axial map (Appendix 2),in which, Area 1 has darker or warmer coloured lines compared to the otherareas. Apparently, the most integrated line (darkest line) in the system borders29© 2012 by MIP
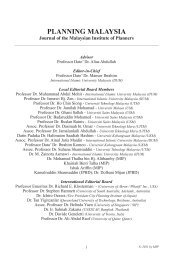
Saniah Ahmad Zaki & Jamalunlaili AbdullahThe Relationship Between Variations <strong>of</strong> Grid Layout and Burglarynorth <strong>of</strong> Area 1. Similar dark colour lines border the sides (east and west) <strong>of</strong> thisarea.Regression analyses were then performed to determine the significance <strong>of</strong>syntactic variables, and the strength <strong>of</strong> relationship between burglary rate andthe syntactic variables. Nevertheless, the results <strong>of</strong> the analyses showed onlyradius n (global integration) indicates a strong relationship with burglary ratewith an r-squared <strong>of</strong> 0.713 and a p-value <strong>of</strong> 0.0346. The remaining syntacticalvariables were weakly related.The graph (Fig. 2) shows that burglary rate is high in areas in which thelayout that is highly connected to the whole system. The more globallyintegrated an area, the more vulnerable it is to burglary.Table 2: Burglary rate in six case study areas compared against spatial syntactic variablesAreasBurg/1000 Radius n (global Radius 3 (localhouses integration) integration)Conn Intell Synergy1 32 0.83 2.58 4.77 0.43 0.362 23 0.77 2.27 4.01 0.47 0.233 30 0.80 1.88 3.26 0.56 0.304 18 0.80 2.19 3.32 0.57 0.135 16 0.69 2.07 3.46 0.23 0.176 11 0.66 2.05 3.52 0.29 0.16Note:Conn - connectivityIntell - intelligibility© 2012 by MIP 30
PLANNING MALAYSIAJournal <strong>of</strong> the Malaysia <strong>Institute</strong> <strong>of</strong> <strong>Planners</strong> (2012)Figure 2: Relationship between burglary rate and radius n31© 2012 by MIP
Saniah Ahmad Zaki & Jamalunlaili AbdullahThe Relationship Between Variations <strong>of</strong> Grid Layout and Burglaryc. Relationship between spatial categories and burglary rateThe study also compared the spatial categories <strong>of</strong> the layouts with burglary rate.The properties considered were: 1) constitutedness <strong>of</strong> the streets, in which thenumber <strong>of</strong> entrance <strong>of</strong> houses that open to both sides <strong>of</strong> a street. A street isrecorded as constituted if there are more than 70% <strong>of</strong> houses lining both sides <strong>of</strong>a street with their entrance open onto the street; 2) categories <strong>of</strong> space, whichincludes through carriageway, cul-de-sac driveway, and cul-de-sac carriageway;and also, intervisibility.In a previous syntax-based study by Hillier and Shu, it has been shownthat a layout is safer if its streets are generally constituted, with highintervisibility and mainly through carriageways. Unlike the previous study, thecase study areas are grid-like layouts and as such the streets are mainly made-up<strong>of</strong> through carriageways. Nevertheless, the degree <strong>of</strong> constitutedness <strong>of</strong> streetsvaries. Area 5 has the least proportion <strong>of</strong> streets that are constituted (46.2%) andArea 2, the most (more than 74%). But, the proportion <strong>of</strong> constituted streets ingrid-like layouts does not seem to relate to burglary rate. Perhaps, the highintervisibility <strong>of</strong> houses (low proportion <strong>of</strong> poor visibility in all areas) couldhave an influence in the burglary rate. This visual analysis was confirmed whenthe variables compared with burglary rate in regression analyses, showed weakrelationship (p-value <strong>of</strong> more than 0.05). It has been shown that analyses at thearea scale have partially explained the proportion <strong>of</strong> burglary rate betweenareas. With the exception <strong>of</strong> the global integration (radius n), all the othervariables do not explain the uneven distribution <strong>of</strong> burglary between grid-likeareas. Thus, it was essential for the study to examine at a much finer scale <strong>of</strong> thestreet level.AreaTable 3: Comparison between burglary rate per 1000 houses and spatial categoriesBurglary rate perCategories <strong>of</strong> space% poor% Const1000% thrc % culdri % culc visibility1 32 59.10 99.41 0.00 0.5 21.82 23 74.10 98.30 1.50 0.2 20.43 30 52.60 99.40 0.30 0.2 19.44 18 66.80 85.70 0.00 14.3 0.05 16 46.20 100.00 0.00 0.0 10.66 11 70.20 97.20 2.80 0.0 27.8Note: const: constitutedness, thrc: though carriageways, culdri: cul-de-sac driveway, culc: culde-saccarriageway© 2012 by MIP 32
PLANNING MALAYSIAJournal <strong>of</strong> the Malaysia <strong>Institute</strong> <strong>of</strong> <strong>Planners</strong> (2012)ii.At the street levelIt has been illustrated that burglary rate is unevenly distributed between areas.Although, at the area level it has been shown that the gridness or the degree <strong>of</strong>grid and permeability do not appear to be related to burglary rate, areas withhomogenous housing (terraced houses only) have lower burglary rate than areaswith heterogeneous housing. Nonetheless, if burglary is mapped (Appendix 2),it can also be seen that within each areas burglary is also unevenly distributed.Some spaces are more at risked than others. The question is why burglary isunevenly distributed within an area. In answering this question, a micro analysisat the street level was considered. At this level, the local factors that makedwellings vulnerable in areas were investigated. But for the purpose <strong>of</strong> thispaper, the results presented are <strong>of</strong> a comparison <strong>of</strong> burglary rate at the streetscale using band as the unit <strong>of</strong> analysis.Unlike most models that look at cities based on function-first approach,space syntax is a form-function based approach. According to Hillier and Stonor(2010), the space syntax approach measures are configurational, in which therelationship <strong>of</strong> each space in a system to all others are calculated. Thus, thespatial element, which is the street segment between junctions, was suggested asthe main form <strong>of</strong> syntactic analysis <strong>of</strong> a city. In a residential layout, the number<strong>of</strong> houses lining street segments may vary from as little as 1 unit <strong>of</strong> house tomore than 50 units. Looking at that range <strong>of</strong> houses in the study areas, the studythen divided the street segments into bands as follows:Band 1: 1 - 12 housesBand 2: 13 - 24 housesBand 3: 25 - 36 housesBand 4: 37 - 48 housesBand 5: more than 49 housea. Comparison between band and burglary rateAt this level the study attempted to find which band has higher burglary rate oris less safe and which is safer. In comparing at the street scale, burglary wascalculated in each band as per 12 houses, in which the number <strong>of</strong> burglary foreach band was multiplied with 12 (houses) and the actual number <strong>of</strong> houses ineach band as the denominator (Table 4). When bands in all the areas werecompared visually to determine which is most vulnerable to burglary, the studyfound burglary rate tend to be highest in band 1 (1 - 12 houses) in each <strong>of</strong> theareas with the exception for Area 1. A regression is performed to determine ifthe relationship between burglary and bands in the areas (except Area 1) is33© 2012 by MIP
Saniah Ahmad Zaki & Jamalunlaili AbdullahThe Relationship Between Variations <strong>of</strong> Grid Layout and Burglarysignificant. The results showed that the relationship in five areas is statisticallysignificant with r-squared <strong>of</strong> 0.492 and a p-value <strong>of</strong>
PLANNING MALAYSIAJournal <strong>of</strong> the Malaysia <strong>Institute</strong> <strong>of</strong> <strong>Planners</strong> (2012)Figure 3: Relationship between burglary rate and band35© 2012 by MIP
Saniah Ahmad Zaki & Jamalunlaili AbdullahThe Relationship Between Variations <strong>of</strong> Grid Layout and BurglaryCONCLUSIONGrid-like layout has been a common street layout in residential areas throughoutthis country. Although a previous study by Hillier and Shu (2000) has suggestedthat grid-like layout is generally safer compared to tree-like layout, their studyhas also indicated that there are spaces in the former layout that is vulnerable toburglary.Following Hillier and Shu’s study, this study has attempted to examinehow various grid-like layouts in Malaysia can be vulnerable to burglary. Uponexamination at the macro and micro scale, the findings <strong>of</strong> this study have shownthat layouts that we planners draw and produce can influence burglary. Whenvariables in a layout were considered independently (as shown in this study),not all factors relate strongly to burglary. Nonetheless, the findings <strong>of</strong> this studyhas shown that at the macro scale (area level), global integration (radius n),relates strongly to burglary rate, and at the micro scale (street level), houses inband 1 (street segments with less than 12 houses) are more vulnerable toburglary. It was also suggested that areas constituting <strong>of</strong> homogenous type <strong>of</strong>houses (e.g. terraced only) is safer than areas with heterogeneous type <strong>of</strong> houses(mix housing type). These findings seem to suggest that planners when drawingup residential layouts must reconsider the hierarchy and connectivity <strong>of</strong> streets.Although accessibility is essential for the convenience <strong>of</strong> its residents, too many(or a very permeable layout) will have negative impact on its safety. Similarly,having fewer houses along a street segment may also put houses at risk <strong>of</strong> beingburgled.This research has attempted to examine the relationship betweenburglary, urban spaces in grid-like layout and the local conditions <strong>of</strong> layouts inMalaysia. Although, this paper presents partial results <strong>of</strong> the study, suffice tosay examining burglary at the macro and micro scales have provided a glimpseinto how spaces interact with burglary. By using space syntax as a tool, it hasallowed the comparison <strong>of</strong> spaces and burglary rate, which otherwise seemimpossible. No doubt there are several crime studies that have been conductedin this country, very few have actually attempted to examine at the finer scale.In conclusion, it can be implied that the results <strong>of</strong> this study have to a certainextent agree with the findings <strong>of</strong> the study carried out by Hillier and Shu.© 2012 by MIP 36
PLANNING MALAYSIAJournal <strong>of</strong> the Malaysia <strong>Institute</strong> <strong>of</strong> <strong>Planners</strong> (2012)REFERENCESBeavon, D. J. K., P. L. Brantingham, et al. (1994). The influence <strong>of</strong> streetnetworks on the patterning <strong>of</strong> property <strong>of</strong>fenses. Crime PreventionStudies 2: 115-148.Bowers, K.J, Johnson, S.D, and Pease K. (2005). Victimisation and revictimisationrisk, housing type and area: a study <strong>of</strong> interactions. Crimeprevention and community safety: An international journal. 7 (1), pp 7 –17.Brantigham, P. L. B., P.J (1975). Residential burglary and urban form. UrbanStudies(12): 273-284.Hillier, B. (2008). Space and spatiality: what the built environment needs fromsocial theory. Building Research & Information 36(3): 216-230.Hillier, B. and Sahbaz, O. (2007). Beyond hot spots; using space syntax tounderstand dispersed patterns <strong>of</strong> crime risk in the built environment.http://eprints.ucl.ac.uk/18549/. Retrieved 30/08/11Hillier, B. and Sahbaz, O. (2008). An evidence based approach to crime andurban design: Or, can we have vitality, sustainability and security all atonce?http://www.spacesyntax.com/Files/MediaFiles/Hillier%20Sahbaz_An%20evidence%20based%20approach_010408.pdf. Retrieved 01/10Hillier, B and Shu, S. (2000). Crime and urban layout: the need for evidence.Secure foundations. London: IPPRHillier, B. and Stonor, T. (2010). Space Syntax - Strategic Urban Design. CityPlanning Review, The City Planning <strong>Institute</strong> <strong>of</strong> Japan. 59/3 (285): 7-11.Jacobs, J. (1961). The death and life <strong>of</strong> great American cities. New York:Vintage Books.Johnson, S. D. and K. J. Bowers (2010). Permeability and burglary risk: are culde-sacssafer?. Quantitative Criminology 26: 89-111.Newman, O. (1972). Defensible Space: Crime Prevention through UrbanDesign. New York, MacMillan.37© 2012 by MIP
Saniah Ahmad Zaki & Jamalunlaili AbdullahThe Relationship Between Variations <strong>of</strong> Grid Layout and BurglaryAppendix 1Axial map <strong>of</strong> the study area in relation to the whole system© 2012 by MIP 38
PLANNING MALAYSIAJournal <strong>of</strong> the Malaysia <strong>Institute</strong> <strong>of</strong> <strong>Planners</strong> (2012)Appendix 2Axial maps <strong>of</strong> case study areas with burglary mapped as white dotsArea1 Area 2Area 3 Area 439© 2012 by MIP
Saniah Ahmad Zaki & Jamalunlaili AbdullahThe Relationship Between Variations <strong>of</strong> Grid Layout and BurglaryArea 5 Area 6© 2012 by MIP 40
PLANNING MALAYSIAM y I PANALYSIS A S IN L N ING S AP N A A MI MPL Y S A SL MM ING IN II M AMP S G M AI A A M I1 2yyA© 2012 by MIP
Farah Diyanah Ismail, Abdul Azeez Kadar Hamsa & Mansor IbrahimAnalysis <strong>of</strong> Factors Influencing the Stated Preference <strong>of</strong> Academic Employees Towards Telecommutingin IIUM Campus, GombakIN I NMalaysia is a rapidly growing country with high private vehicle ownership. Thenumber <strong>of</strong> cars in the Klang Valley is expected to reach seven million by 2020,unless there is a marked shift to public transport (BERNAMA, 2011). Thisnumber <strong>of</strong> vehicle ownership has been growing at an exceedingly fast rate withan average <strong>of</strong> 30,000 cars per month. Recently in the Klang Valley, 83% or sixmillion trips were made using private transport, mostly single occupancyvehicles (SOVs). This explains the huge traffic jams and constant gridlockconditions even though the Klang Valley has one <strong>of</strong> the highest concentrations<strong>of</strong> roadways and tolled highways in the world (Sabariah, 2011). The growth <strong>of</strong>private vehicle trips has been exerting tremendous pressure on the capacity <strong>of</strong>the existing road network that cannot be subdued by only physical extension <strong>of</strong>the network, which <strong>of</strong>ten proved to be costly. The rapid increase in the use <strong>of</strong>private transport has resulted in increased traffic congestion, accidents,inadequate parking space and air pollution among other negative effects(Abdalla Nurdeen et al., 2007). In view <strong>of</strong> the above problems, telecommutingcould be seen as one <strong>of</strong> the measures in reducing the number <strong>of</strong> private vehicleson the road especially during peak hour and thus reducing the associatednegative impact.The increase in private vehicle use also affects road, parking and relatedinfrastructure in higher learning institutions in Malaysia. International IslamicUniversity Malaysia (IIUM), being located in Gombak, Kuala Lumpur, is one <strong>of</strong>the public Universities in Malaysia. The University has been subjected to anincreasing number <strong>of</strong> staff and student population every year. The Universitystatistics showed that the number <strong>of</strong> employees in IIUM has increased at anaverage rate <strong>of</strong> 6.6% per year between 2001 and 2010 (IIUM ManagementServices Division, 2011). The increasing number <strong>of</strong> employees has contributedto the high number <strong>of</strong> registered vehicles in IIUM. According to IIUM SecurityManagement Unit Office (2011), the number <strong>of</strong> registered vehicles among thestaffs has reached almost 3000 registered cars in 2010. The statistics alsoshowed that the number <strong>of</strong> registered private motorized vehicles has exceededthe total number <strong>of</strong> employees by 10.4%. As a result <strong>of</strong> the increasing number<strong>of</strong> private vehicles, IIUM has been facing insufficient parking spaces toaccommodate both staffs and students’ vehicles. The statistics <strong>of</strong> IIUM SecurityManagement Unit Office (2011) showed that the number <strong>of</strong> registered vehicles,among the staffs, to the number <strong>of</strong> available parking spaces on-campus hasexceeded by 9.2%. It clearly showed that the available parking supply is far less© 2012 by MIP
PLANNING MALAYSIAJournal <strong>of</strong> the Malaysia <strong>Institute</strong> <strong>of</strong> <strong>Planners</strong> (2012)than the parking demand. The increasing private vehicle usage by staffs as wellas students has been imposing an enormous pressure on the ability <strong>of</strong> theexisting infrastructure to cope with the increasing traffic volume and parkingdemand on-campus. As a result, the major circular road has seen congested withlong queues <strong>of</strong> vehicles, which cause slow moving <strong>of</strong> traffic especially duringmorning and evening peak hours. The purpose <strong>of</strong> this paper is to investigatefactors influencing the stated preference <strong>of</strong> the academic staffs <strong>of</strong> InternationalIslamic University Malaysia (IIUM) towards telecommuting and also analyzetheir perceptions on various aspects <strong>of</strong> telecommuting. As such, there is nopolicy on the telecommuting phenomenon being introduced in the University.However, some <strong>of</strong> the academic staffs were found to be practicingtelecommuting as informal work arrangement. Hence, the views <strong>of</strong> theacademic staff, especially due to their involvement on telecommutingcompatible work arrangement such as research and consultancy, on the facets <strong>of</strong>telecommuting is very crucial and pertinent. Self-administered questionnaireswere administered on the selected respondents to ascertain academic staffs’views on the practice <strong>of</strong> telecommuting as an alternate work arrangement inIIUM. The findings <strong>of</strong> the questionnaire survey are discussed in the followingsections. Recommendations to increase the penetration <strong>of</strong> telecommutingphenomenon as an alternate work arrangement in IIUM are also drawn.LITERATURE REVIEWVarious authors have pointed out the diverse meanings assigned to the term"telecommuting". Additionally, several other researchers had tried to establishtheir own definition. To exemplify, Joice (1999) defines telecommuting as a“work arrangement in which employees work at alternate worksites to conductsome <strong>of</strong> their <strong>of</strong>ficially assigned work during paid hours”. According toFairweather (1999), telecommuting uses information and communicationtechnologies to bring work to the worker. Telecommuting is sometimes equatedwith the use <strong>of</strong> telecommunications-related technology to conduct work. Ellison(1999) defined telecommuting as a “periodic work out <strong>of</strong> the principal <strong>of</strong>fice,one or more days per week either at home, at a client’s site, or in a teleworkcentre”. Due to such an inconsistency in shaping the definition <strong>of</strong> the term, onecould argue that the definitions applied to telecommuting can be grouped inthree main blocks; some emphasize on where the work has taken place, someagreed that telecommuting is usually connected with the use <strong>of</strong>telecommunication tools and others defined in terms <strong>of</strong> how <strong>of</strong>ten it has takenplace.43© 2012 by MIP
Farah Diyanah Ismail, Abdul Azeez Kadar Hamsa & Mansor IbrahimAnalysis <strong>of</strong> Factors Influencing the Stated Preference <strong>of</strong> Academic Employees Towards Telecommutingin IIUM Campus, GombakThe literature on telecommuting has grown significantly, especially inwestern countries, over the last two decades. Research on telecommuting indeveloping countries is still considered unsurprisingly new (Mohamed andAbdallah, 2009). On empirical part <strong>of</strong> telecommuting research, someresearchers had presented results from the investigation and analyze <strong>of</strong> thepreference towards performing telecommuting among the employees. WanRozaini and Haitham (2005), for example, had used a sample <strong>of</strong> 70 lecturersfrom “Fakulti Teknologi Maklumat (faculty <strong>of</strong> information technology)” toinvestigate the possibilities <strong>of</strong> implementing telecommuting as a first mode <strong>of</strong>working at all faculties at Universiti Utara Malaysia (one <strong>of</strong> the publicUniversities) by ascertaining their views on willingness to telecommute.Similarly, Abdul Azeez and Wan Nurul Mardiah (2009) had conducted a studyto unravel travel, work and socioeconomic characteristics <strong>of</strong> the stated preferredtelecommuters and factors associated with preference to telecommute in theprivate and public sectors in Johor Bahru and Kuala Lumpur city by targeting391 employees.Based on earlier studies, Yen and Mahmassani (1994), Sullivan (1993)and Peters et al. (2004) had agreed that the decision to telecommute is governedby socioeconomic variables. In terms <strong>of</strong> gender, Popuri and Bhat (2003), Yapand Tng (1990) and Wells et al. (2001) had suggested that telecommutingwould be <strong>of</strong> particular interest to women employees. Earlier studies hadidentified that age is also one <strong>of</strong> the factors that contribute to preference toadopt telecommuting (Mokhtarian and Meenakshisundaram, 2002 and Walls etal., 2007). Thériault et al., (2005) had suggested that older workers are morelikely to telecommute than younger ones. Several studies have suggested thattelecommuting would be <strong>of</strong> particular interest to employees who have children(Popuri and Bhat, 2003; Yap and Tng, 1990 and Wells et al., 2001).Furthermore, Peters et al. (2004) had assumed that the likelihood on thepreference to telecommute is positively influenced by the number <strong>of</strong> childrenespecially children in the youngest age group. The employees with a child underthe age <strong>of</strong> four more <strong>of</strong>ten prefer to telecommute than employees with a childover 12 years <strong>of</strong> age. On other aspects, Walls et al. (2007) claimed that both thechoice and frequency decisions <strong>of</strong> telecommuting were found to be substantialinfluences <strong>of</strong> workplace-related factors. According to Brown (2010), jobposition plays an important role in the selection process or in some nontelecommuters’decision to opt out <strong>of</strong> telecommuting. Moreover, the length <strong>of</strong>service also found to be one <strong>of</strong> the important influential factors for the decisionto telecommute (Bagley and Mokhtarian, 1997). Safirova and Walls (2004)© 2012 by MIP 44
PLANNING MALAYSIAJournal <strong>of</strong> the Malaysia <strong>Institute</strong> <strong>of</strong> <strong>Planners</strong> (2012)confirmed that having more pr<strong>of</strong>essional experiences, in general, and a longertenure with one’s current company and one’s current supervisor will boost theprobability <strong>of</strong> telecommuting. Popuri and Bhat (2003) also suggested thatemployees with a long period <strong>of</strong> service with the current employer tend to bemore inclined to telecommute.According to Mokhtarian and Salomon (1996c), commute stress isexpected to be positively related with the choice to telecommute, assuming thatstressful commuting conditions can be avoided by telecommuting. Employeeswho have to spend long unproductive time on the road for work trip therebysubjected to stress and fatigue. Employees commuting to work who are facingtraffic congestion and commute stress may encourage them to telecommutemore frequently (Mokhtarian and Salomon, 1996b, 1997). In a study <strong>of</strong>emotional impact <strong>of</strong> telecommuting, Mann (2000) found that respondents <strong>of</strong>two service industries in the UK had perceived telecommuting advantages asfollows: less travel (57%); more freedom/flexibility (57%); better workingenvironment (50%); fewer distractions (43%); cheaper (29%); freedom tochoose comfortable clothes (14%); freedom from <strong>of</strong>fice politics (7%); andeasier to complete domestic chores (7%). On the other hand, Tremblay (2003)found the perceived disadvantages <strong>of</strong> telecommuting that are most <strong>of</strong>tenmentioned include: lack <strong>of</strong> co-workers and isolation (15.4% and 10% <strong>of</strong>respondents respectively), risk <strong>of</strong> working more (9%), difficulty <strong>of</strong> motivatingthemselves (6%) and work-family conflict (5%).OBJECTIVES, HYPOTHESIS AND RESEARCH APPROACHThe objectives, research hypothesis and research approach are highlighted inthis section.Study objectivesThe formulated objectives <strong>of</strong> this study are:(1) To analyse number <strong>of</strong> academic and administrative employeesand their patterns <strong>of</strong> registered vehicles on-campus(2) To describe the existing traffic and road characteristics oncampus(3) To identify factors contributing towards the practice <strong>of</strong>telecommuting among the academic staffs(4) To formulate recommendations to increase the penetration level<strong>of</strong> telecommuting among staff members on-campus45© 2012 by MIP
Farah Diyanah Ismail, Abdul Azeez Kadar Hamsa & Mansor IbrahimAnalysis <strong>of</strong> Factors Influencing the Stated Preference <strong>of</strong> Academic Employees Towards Telecommutingin IIUM Campus, GombakResearch hypothesisJiang (2008) and Mokhtarian and Salomon (1996a) explained that workers whohave longer commute distances might be more likely to telecommute. In manystudies commuting time is indeed found to have a large positive effect ontelecommuting adoption (Mokhtarian and Salomon, 1997). Peters et al. (2004)mentioned the likelihood <strong>of</strong> preferring to telecommute is for individuals whohave long commuting times. For some motivation and constraint variables, thepresence or absence <strong>of</strong> children might have an important impact towards thechoice <strong>of</strong> decision on telecommuting. Mannering and Mokhtarian (1995);Popuri and Bhat (2003) explored some <strong>of</strong> the most important variables inexplaining the choice <strong>of</strong> telecommuting were the presence <strong>of</strong> small children inthe household and gender <strong>of</strong> respondents. In response to that, Wells et al. (2001)found that telecommuters are more likely to be women, married, and havechildren. Thus, the following hypotheses were formulated based on the aboveliterature study:H1H2H3H4Further the commute distance from home to workplace, greaterthe inclination toward preference to adopt telecommuting byacademic employees.Longer the commute time experienced on the road, higher theinclination <strong>of</strong> the academic employees to telecommute.Married female academic employees with children at home aremore likely to state preference towards telecommuting.Longer the time being spent on research, more likely theacademic employees would prefer to telecommuteResearch approachThe selection <strong>of</strong> appropriate research approach is imperative to achieve thestated objectives <strong>of</strong> the study. Both primary and secondary data were collectedbased on the stated objectives and research hypotheses. Field observational andquestionnaire survey were applied in this study to collect data for this study.Background <strong>of</strong> study areaThe main campus <strong>of</strong> International Islamic University Malaysia (IIUM) isnestled in a valley in the district <strong>of</strong> Gombak, a suburb <strong>of</strong> the capital city <strong>of</strong>Kuala Lumpur. It is situated around 10 kilometers at the northeast direction© 2012 by MIP 46
PLANNING MALAYSIAJournal <strong>of</strong> the Malaysia <strong>Institute</strong> <strong>of</strong> <strong>Planners</strong> (2012)from Kuala Lumpur at the foot <strong>of</strong> the Gombak hillside. The campus occupies anarea <strong>of</strong> 700 acres and it can be accessed by using the Middle Ring Road 2(MRR2), Karak Highway or the Gombak road. The University was establishedin 23 May 1983 being founded based on Islamic principles with the aim tobecome a premier Islamic University in the world (The Star, 2007b). IIUMGombak Campus comprises <strong>of</strong> 8 faculties, also known as Kulliyyahs,specialized in Architecture and Environmental Design, Economics andManagement Sciences, Engineering, Islamic Revealed Knowledge and HumanSciences, Education, Laws, Information and Communication Technology andLanguage Centre. Presently, the University accommodates about 2708employees including both academic and administrative staffs and a total number<strong>of</strong> 20,000 students (IIUM Management Services Division, 2011).Figure 1: Campus <strong>of</strong> International Islamic University Malaysia, Gombak47© 2012 by MIP
Farah Diyanah Ismail, Abdul Azeez Kadar Hamsa & Mansor IbrahimAnalysis <strong>of</strong> Factors Influencing the Stated Preference <strong>of</strong> Academic Employees Towards Telecommutingin IIUM Campus, GombakField observational surveyThis survey was used to collect data related to traffic and road characteristics,parking demand and traffic circulation especially along major road on-campus.This is mainly to determine the rationale for the study. Field measurement onthe road dimensions along the major road was administered. The roaddimension at four different stretches along major roads in IIUM was measuredbecause <strong>of</strong> different dimensions at these stretches. The measurement <strong>of</strong> roaddimensions includes: carriageway width, width <strong>of</strong> pedestrian walkways, andwidth <strong>of</strong> landscape and drainage. Similarly, data on parking demand and trafficflow with the campus were also collected.Questionnaire surveyThe perceptions <strong>of</strong> academic staff on the various facets <strong>of</strong> telecommuting weredetermined by using a questionnaire survey approach. The questions werecarefully drafted not only for the purpose <strong>of</strong> avoiding irrelevant andinappropriate questions but also reducing the length <strong>of</strong> the questionnaire.Academic employees <strong>of</strong> IIUM were selected as the target population for thisstudy because <strong>of</strong> their involvement in telecommuting-compatible jobs such asresearch, and consultancy besides teaching and flexibility in working hours.Samples were selected because <strong>of</strong> high number <strong>of</strong> academic staff in IIUM, as itis extremely difficult to include the entire academic staff population. The totalsample size for this research was estimated by using Yamane (1967) formula.Refer to Equation (1).Nn =1 N (e) 2(1)Where: n = sample size, N = population size, e = the level <strong>of</strong> precision(assumed 10%). The total number <strong>of</strong> academic staff population in IIUMGombak campus was 1335 as given by Management Services Division, themain administrative wing <strong>of</strong> the University. The total sample size wascalculated to be 93 and rounded <strong>of</strong>f to 100. The total population <strong>of</strong> the academicstaff was stratified according to Kulliyyah (faculties) and proportional sampleswere selected from each Kulliyyah (stratum). The proportional allocation <strong>of</strong>samples is determined by the following expression (Anderson, 1989). Refer toEquation (2).nn = N xi iN(2)© 2012 by MIP 48
PLANNING MALAYSIAJournal <strong>of</strong> the Malaysia <strong>Institute</strong> <strong>of</strong> <strong>Planners</strong> (2012)Where: n = sample units <strong>of</strong> ith stratum, N = population members <strong>of</strong> ithiistratum, n = sample size, N = population size.Table 1: Proportional allocation <strong>of</strong> sample according to Kulliyyah/DepartmentKulliyyah/DepartmentNumber <strong>of</strong> academicProportional AllocationemployeesSample units PercentageKAED 116 9 9%KENMS 143 11 11%KOE 225 17 17%KIRHS 258 19 19%INSTED 31 2 2%AIKOL 135 10 10%KICT 54 4 4%CELPAD 373 28 28%Total 1335 100 100%Source: Management Services Division <strong>of</strong> IIUM, 2011 & Primary Calculation, 2011Self-administered questionnaire survey forms were distributed to theacademic employees by applying convenience sampling method. It is mainly todecrease the expected high response rate. Sufficient time was given to therespondents to respond the questionnaire. One hundred and sixty nine (169)questionnaire survey forms were distributed but only 100 participants hadactually responded, a response rate <strong>of</strong> 57% (Table 2). The questionnaire formwas divided into three main parts consisting <strong>of</strong> travel characteristics,perceptions <strong>of</strong> telecommuting and background pr<strong>of</strong>ile <strong>of</strong> the respondents.Table 2: Distribution <strong>of</strong> QuestionnairesKulliyyah/Department Questionnaires distributed Questionnaires received Response rateKAED 11 9 81.8%KENMS 21 11 52.4%KOE 29 17 58.6%KIRKHS 34 19 55.9%INSTED 5 2 40.0%AIKOL 20 10 50.0%KICT 8 4 50.0%CELPAD 41 28 68.3%Total 169 100 Average 57.1%Method <strong>of</strong> analysisSource: Primary Survey, 2011Relative Importance Index (RII) method was applied on the ordinal ranking datato determine the ranking <strong>of</strong> the identified factors/determinants on the variousaspects <strong>of</strong> telecommuting according to respondents’ preferences. RII formula isshown in Equation (3).49© 2012 by MIP
Farah Diyanah Ismail, Abdul Azeez Kadar Hamsa & Mansor IbrahimAnalysis <strong>of</strong> Factors Influencing the Stated Preference <strong>of</strong> Academic Employees Towards Telecommutingin IIUM Campus, Gombak∑ aixiRII =A x N(3)Where:a = constant expressing the weight <strong>of</strong> the ith responseix = frequency <strong>of</strong> the ith response <strong>of</strong> the total responses for each causeii = response category index (where i = 1, 2, 3, 4 and 5 respectively)A = highest weight (5) if 5 (if 7, then A= 7)N = total number <strong>of</strong> respondentsEach <strong>of</strong> the ordinal variables was categorized by using Likert scale.Cross-tabulation technique was used to determine the relationship betweenvariables (preference <strong>of</strong> academic employees towards telecommuting andbackground pr<strong>of</strong>iles as well as travel characteristics <strong>of</strong> the respondents). Chisquaremethod was also used to test the statistical significance <strong>of</strong> each identifiedhypothesis.ANALYSIS AND FINDINGSThe findings showed that the total number <strong>of</strong> employees in IIUM has beenincreasing at the rate <strong>of</strong> 6.6% per year from 2001 to 2010. The number <strong>of</strong>registered cars on-campus has been increasing at 1.8% per year from 2007 to2010. Analysis on traffic volume in IIUM showed highest traffic volume in theevening peak hours (5.00 pm-6.00 pm). The demand for parking has alsoexceeded the parking supply in almost all the Kulliyyahs/faculties in IIUM. Thetotal number <strong>of</strong> parking spaces for both cars and motorcycle are 2567 and 1273respectively. The study reveals that the parking spaces provided at theKulliyyah/faculties is highly utilized with the average <strong>of</strong> 83.55%. This indicatesthat the demand for parking is high. The traffic conditions in IIUM have beenexerting tremendous pressure on the limited road and supporting infrastructure.Thus, this study is considered important in highlighting the perceptions <strong>of</strong>employees on telecommuting as an alternative form <strong>of</strong> work arrangement whichwould help to reduce impact on road infrastructure. The following sectionsdiscuss on the background pr<strong>of</strong>ile <strong>of</strong> the respondents and their perceptions ontelecommuting as an alternative work arrangement.© 2012 by MIP 50
PLANNING MALAYSIAJournal <strong>of</strong> the Malaysia <strong>Institute</strong> <strong>of</strong> <strong>Planners</strong> (2012)Background pr<strong>of</strong>ileThe gender composition <strong>of</strong> respondents showed 57% female and 43% male. Themajority (25%) <strong>of</strong> the respondents fall under the age structure <strong>of</strong> 41-45 yearsold with an average age <strong>of</strong> 42 years. Refer to (Table 3). A high number <strong>of</strong>“teachers” (27%) attached to the Centre for Language studies has participated inthe questionnaire survey. Among the respondents, 7% hold the position asPr<strong>of</strong>essor, 18% as Associate Pr<strong>of</strong>essor, 21% as Assistant Pr<strong>of</strong>essor, 24% aslecturer 3% as academic fellow. A large proportion <strong>of</strong> the academic staffs(30%) have been working in IIUM for 6-10 years with an average tenure being11 years. Generally, the academic staffs were involved in administration tasks,attending meetings, paper markings, lecture preparation, research andpublications besides teaching.Table 3: Summary <strong>of</strong> background pr<strong>of</strong>ile <strong>of</strong> the respondents (n=100)Background Pr<strong>of</strong>ile Frequency Percentage Mean Median Std. DeviationGenderMale 43 43.0% - - -Female 57 57.0%Age Group26-30 years 9 9.0% 42.13 years 41.5 years 8.643 years31-35 years 13 13.0%36-40 years 23 23.0%41-45 years 25 25.0%46-50 years 13 13.0%51-55 years 9 9.0%56-60 years 4 4.0%> 60 years 4 4.0%Marital StatusSingle 15 15.0% - - -Married 83 83.0%Divorced/Widowed 2 2.0%Children Status0-5 years old 37 21.8% 11.15 years 10.6 years 6.587 years6-10 years old 47 27.6%11-15 years old 44 25.9%16-20 years old 25 14.7%21-25 years old 14 8.2%> 25 years old 3 1.8%Job PositionPr<strong>of</strong>essor 7 7.0% - - -Assoc. Pr<strong>of</strong> 18 18.0%Assist. Pr<strong>of</strong> 21 21.0%Lecturer 24 24.0%Teacher 27 27.0%Academic Fellow 3 3.0%Duration <strong>of</strong> Service0-5 years 28 28.0% 10.5 years 9.2 years 7.136 years6-10 years 30 30.0%51© 2012 by MIP
Farah Diyanah Ismail, Abdul Azeez Kadar Hamsa & Mansor IbrahimAnalysis <strong>of</strong> Factors Influencing the Stated Preference <strong>of</strong> Academic Employees Towards Telecommutingin IIUM Campus, Gombak11-15 years 19 19.0%16-20 years 9 9.0%21-25 years 12 12.0%26-30 years 2 2.0%Time spend on job scopesa) Teaching1-8 hours/week9-16 hours/week123412.0%34.0%18.42 hourper week17-24 hours/week 34 34.0%25-32 hours/week 13 13.0%> 32 hours/week 7 7.0%b) ConsultancyNone 7 7.0% 9.49 hours1-8 hours/week 60 60.0% per week9-16 hours/week 15 15.0%17-24 hours/week 12 12.0%25-32 hours/week 5 5.0%> 32 hours/week 1 1.0%c) ResearchNone 4 4.0% 15 hours per1-8 hours/week 36 36.0% week9-16 hours/week 21 21.0%17-24 hours/week 23 23.0%25-32 hours/week 9 9.0%> 32 hours/week 7 7.0%d) Others17.44 hourper week6.70 hoursper11.55 hoursper week9.071 hoursper week7.774 hoursper week10.913 hoursper week2 1 0.9%Travel characteristicsNone 76 76.0% 19.5 hours 19.16 hours 11.618 hours1-8 hours/week 6 6.0% per week per week per week9-16 hours/week 5 5.0%17-24 hours/week 3 3.0%25-32 hours/week 6 6.0%> 32 hours/week 4 4.0%Registered Vehiclesa) Car1 52 47.3% 1.55 cars 1 car 0.745 cars2 34 30.9%3 9 8.1%4 2 1.8%b) Motorcycle1 12 10.9% 1.08 cars 1 car 0.227 motorcycleSource: Primary Survey, 2011Respondents may response to more than one answer choicesThe average number <strong>of</strong> registered cars and motorcycles by an academic staffwere found to be 1.55 and 1.08 respectively. “Driving alone” (singleoccupancy) to the campus (64%) was found to be very common among© 2012 by MIP 52
PLANNING MALAYSIAJournal <strong>of</strong> the Malaysia <strong>Institute</strong> <strong>of</strong> <strong>Planners</strong> (2012)academic staffs. Surprisingly, none <strong>of</strong> the academic staff were using publictransport to the campus. Refer to (Table 4). The average commute distance <strong>of</strong>the respondents was 16.75 km. Most <strong>of</strong> the respondents (53%) spent commutingtime <strong>of</strong> 15 to 30 minutes to the campus with 51% have experienced less than 15minutes delay time.Table 4: Summary <strong>of</strong> travel characteristics <strong>of</strong> the respondents (n=100)Travel Characteristics Frequency Percentage Mean Median Std. DeviationMode <strong>of</strong> TransportationCar – (single64 64.0% - - -occupancy)Car – (more than22 22.0%single occupancy)Car – as passenger 10 10.0%Motorcycle 4 4.0%Commute Distance (one-way trip)5 km or less 19 19.0% 16.75 km 11.5 km 17.54 km6 -10 km 29 29.0%11-15 km 10 10.0%16-20 km 17 17.0%21-25 km 8 8.0%26-30 km 5 5.0%31 km or more 12 12.0%Average Commute Timea) To workplace15 minutes or less15-30 minutes185318.0%53.0%29.5minutes30-45 minutes 10 10.0%45-60 minutes 10 10.0%1 hour-1h 15mins 4 4.0%1 h 15mins-1h 30mins 3 3.0%More than 1h 30mins 2 2.0%b) From workplace15 minutes or less 14 14.0% 32.715-30 minutes 44 44.0%30-45 minutes 16 16.0%45-60 minutes 17 17.0%1 hour-1h 15mins 5 5.0%1 h 15mins-1h 30mins 3 3.0%More than 1h 30mins 1 1.0%Average Delay Timea) To workplaceNot experienced anydelayminutes17 17.0% 14.67minutes15 minutes or less 51 51.0%15-30 minutes 26 26.0%30-45 minutes 6 6.0%b) From workplaceNot experienced anydelay24 24.0% 17.80minutes15 minutes or less 36 36.0%15-30 minutes 32 32.0%24.16minutes27.59minutes6.68minutes15.50minutes20.074minutes19.454minutes9.177 minutes11.307minutes53© 2012 by MIP
Farah Diyanah Ismail, Abdul Azeez Kadar Hamsa & Mansor IbrahimAnalysis <strong>of</strong> Factors Influencing the Stated Preference <strong>of</strong> Academic Employees Towards Telecommutingin IIUM Campus, Gombak30-45 minutes 5 5.0%45-60 minutes 3 3.0%Experience <strong>of</strong> stressYes 35 35.0% - - -No 65 65.0%Source: Primary Survey, 2011Perceptions <strong>of</strong> respondents on telecommuting as an alternative workarrangementThe concept <strong>of</strong> telecommuting was widely accepted by the respondents. Thefindings showed that 68% <strong>of</strong> the respondents were preferred to adopttelecommuting while only 32% were against. The preferred frequency <strong>of</strong>telecommuting (about 34%) was 2 days per week followed by 3 days per week(28%) and 1 day per week (21%). This study also shows that some <strong>of</strong> therespondents preferred to telecommute for 3 days per week (27.9%) followed by20.6% preferred only 1 day per week. Nearly 78% <strong>of</strong> the academic staffs wereaware about telecommuting and 48% <strong>of</strong> the respondents were performedtelecommuting informally. The views <strong>of</strong> respondents on telecommuting wereasked based on their likely preference to practice telecommuting during andafter <strong>of</strong>fice hours. Peters et al. (2004) mentioned that informal telecommuting ismore widespread than formal telecommuting.Hypotheses testingEach hypothesis was tested for statistical significance by using Chi-squaremethod. The following shows results <strong>of</strong> the hypothesis testing.H1 Further the commute distance from home to workplace, greater theemployees show preference to practice telecommutingJiang (2008) and Mokhtarian and Salomon (1996a) explained workers who havelonger commute distances may be more likely to telecommute. The findingsshowed that this hypothesis was tested to be statistically insignificant at 95%confidence level. This finding is similar to that <strong>of</strong> Abdul Azeez and Wan NurulMardiah (2009) and Drucker and Khattak (2000) which indicated that distanceto work is negatively correlated with telecommuting—that is, the farther theindividual lives from his/her job, the less likely he/she to telecommute. (Table5) shows the cross-tabulation between those two variables.© 2012 by MIP 54
PLANNING MALAYSIAJournal <strong>of</strong> the Malaysia <strong>Institute</strong> <strong>of</strong> <strong>Planners</strong> (2012)Table 5: Preference towards telecommuting according to commute distanceLikely to practiceCommute distancetelecommuting10 km orless11-20 km 21-30 km 31-40km41 kmorYesNoCountPercentage <strong>of</strong>respondents who likelyto practicetelecommuting interms <strong>of</strong> commutedistanceCountPercentage <strong>of</strong>respondents who arenot likely to practicetelecommuting interms <strong>of</strong> commutedistance3247.0%1650.0%1927.9%825.0%811.8%515.6%45.9%26.3%more57.4%13.1%Total68100.0%32100.0%Source: Primary Survey, 2011H2 Longer the commute time between home and workplace, the higher theinclination <strong>of</strong> academic employees to telecommute.In many studies commuting time is indeed found to have a large positive effecton telecommuting adoption (Mokhtarian and Salomon, 1997). Peters et al.(2004) mentioned that the likelihood towards preference to telecommute isrelated with long commuting time. Results <strong>of</strong> chi-square test had revealed thatthere exists no significant association between the propensity towardstelecommuting and commute time (for both to workplace and from workplace).The chi-square results showed insignificant relationship between inclination topractice telecommuting and commute time. (Table 6) shows the relationshipbetween commute time and preference to telecommute.Table : Preference towards telecommuting according to travel timeLikely to practice telecommutingAverage commute time to workplace< 30minutes30minutes -1 hour - 1hour 30> 1 hour 30minutesYesNoCountPercentage <strong>of</strong> respondentswho likely to practicetelecommuting in terms <strong>of</strong>average commute time toworkplaceCountPercentage <strong>of</strong> respondentswho are not likely topractice telecommuting interms <strong>of</strong> average commutetime to workplace4769.1%2475.0%1 hour1319.1%721.9%minutes68.8%13.1%22.9%0.0%Total68100.0%32100.0%55© 2012 by MIP
Farah Diyanah Ismail, Abdul Azeez Kadar Hamsa & Mansor IbrahimAnalysis <strong>of</strong> Factors Influencing the Stated Preference <strong>of</strong> Academic Employees Towards Telecommutingin IIUM Campus, GombakLikely to practice telecommutingYesNoCountPercentage <strong>of</strong> respondentswho likely to practicetelecommuting in terms <strong>of</strong>average commute timefrom workplaceCountPercentage <strong>of</strong> respondentswho are not likely topractice telecommuting interms <strong>of</strong> average commutetime from workplace< 30minutes3855.9%2062.5%Average commute time from workplace30 1 hour - 1 > 1 hour 30minutes - hour 30 minutes1 hour minutes2232.4%1134.4%710.3%13.1%11.5%0.0%Total68100.0%32100.0%Source: Primary Survey, 2011H3 Married female academic employees with children at home are more likelyto state preference towards telecommutingThe presence <strong>of</strong> children at home may have an important impact towards thechoice on the decision to telecommute. Mannering and Mokhtarian (1995);Popuri and Bhat (2003) explored that the most important variables in explainingthe choice <strong>of</strong> telecommuting were the presence <strong>of</strong> small children in thehousehold and gender <strong>of</strong> respondents. In response to that, Wells et al. (2001)found that telecommuters are more likely to be women, married, and havechildren. Among the respondents who expressed interest to practicetelecommuting, 57.6% were married female with children. The third hypothesis,which states that married female academic employees with children at home aremore likely to state preference towards telecommuting was tested for statisticalsignificance. Mokhtarian and Salomon (1996b), on the other hand, showeddifferent findings on this relationship. Their findings revealed that the presence<strong>of</strong> children were not significantly different between preferrers and nonpreferrers.This research however has come out with a contrary result. Thefindings <strong>of</strong> this hypothesis showed that the association between preferencetowards telecommuting and married female with children status was statisticallysignificant at 95% confidence level. (Table 7) shows the cross-tabulationbetween those two variables.© 2012 by MIP 56
PLANNING MALAYSIAJournal <strong>of</strong> the Malaysia <strong>Institute</strong> <strong>of</strong> <strong>Planners</strong> (2012)Table 7: Preference towards telecommuting according to married female with children statusLikely to practice telecommutingMarried female with children statusMarried female Married female Totalwith children without childrenYes CountPercentage <strong>of</strong> respondents who likelyto practice telecommuting in terms <strong>of</strong>married female with children status1957.6%1442.4%33100.0%NoCountPercentage <strong>of</strong> respondents who arenot likely to practice telecommuting interms <strong>of</strong> married female with childrenstatus215.4%1123.9%13100.0%Source: Primary Survey, 2011H4 Greater the time spent on research, more likely the academic employees toshow their willingness to telecommuteThe main work tasks <strong>of</strong> academic staffs are teaching, consultancy and researchactivities. Based on Yen and Mahmassani (1997) stated-preference approachsurvey, in which respondents are asked about their preferences towardstelecommuting adoption, the authors find that the more face-to-facecommunication with the coworkers that the employee says he needs, the lowerthe probability <strong>of</strong> telecommuting. Since research activities mainly involvespending time independently and require less face-to-face interaction, it ispresume that those who spend more time on research and publication wouldmore preferably express willingness to telecommute. Chi-square test, however,has revealed that the association between propensity towards telecommutingand more time spent on research was statistically insignificant. It is becauseamong those who preferred to telecommute were mostly spent their time onresearch for 1 to 8 hours per week (least frequent) whereas only few <strong>of</strong> therespondents who were willing to telecommute spent time on research for morethan 32 hours per week (most frequent). (Table 8) describes the relationshipbetween the time spent on research and the employees’ preference towardstelecommuting. A summary <strong>of</strong> hypotheses is shown on (Table 9).Table : Preference towards telecommuting according to the time spent on researchAllocation <strong>of</strong> time spent on researchLikely to practicetelecommutingYesCountPercentage <strong>of</strong>respondents who arelikely to practicetelecommuting interms <strong>of</strong> time spenton researchLeastfrequent*2335.3%Lessfrequent*1929.2%Frequent*1116.9%Morefrequent*69.3%Mostfrequent*69.3%Total65100.0%57© 2012 by MIP
Farah Diyanah Ismail, Abdul Azeez Kadar Hamsa & Mansor IbrahimAnalysis <strong>of</strong> Factors Influencing the Stated Preference <strong>of</strong> Academic Employees Towards Telecommutingin IIUM Campus, GombakNoCountPercentage <strong>of</strong>respondents who arenot likely to practicetelecommuting interms <strong>of</strong> time spenton research1341.9%26.5%1238.7%39.7%13.2%31100.0%Source: Primary Survey, 2011* Least frequent = (1-8 hours per week), Less frequent = (9-16 hours per week), Frequent = (17-24 hours perweek), More frequent = (25-32 hours per week), Most frequent = (More than 32 hours per week)H1H2H3H4ResearchStatementTable 9: Summary <strong>of</strong> Research HypothesesHypothesis VariablesChisquaredfValueFurther the commutedistance from home toworkplace, greater theacademic employeesshow preference topractice telecommuteLonger the commutetime experienced toworkplace, higher theinclination <strong>of</strong> theacademic employeesto telecommuteMarried femaleacademic employeeswith children at homeare more likely to statepreference towardstelecommutingGreater the time spenton research, morelikely the academicemployees to showtheir willingness totelecommute1. Commutedistance fromhome toworkplace2. Willingness totele-commute1. Commute timebetween homeand workplace2. Preferencetowards telecommuting1. Gender2. Marital status3. Children status4. Preference toperform telecommuting1. Frequency <strong>of</strong>time spent onresearch2. Willingnesstowards telecommutingAsymp. Sig.(2-sided)Interpretation.109 2 .947 InsignificantrelationshipAverage travel time toworkplaceInsignificantrelationship.210 2 .647Average travel time fromworkplace.391 2 .5326.691 1 .010 Statisticallysignificant4.151 2 .126 InsignificantrelationshipSource: Primary Survey, 2011The results <strong>of</strong> the hypothesis showed whether or not there existrelationship between preference to telecommute and the chosen variables. Theresults showed that as many as three hypotheses were tested statisticallyinsignificant at 95% confidence interval. However, these results should beapplied with caution because <strong>of</strong> the limitation in the selection <strong>of</strong> total samplesize.© 2012 by MIP 58
PLANNING MALAYSIAJournal <strong>of</strong> the Malaysia <strong>Institute</strong> <strong>of</strong> <strong>Planners</strong> (2012)Perceived advantages on the preference towards telecommutingThis study also analyzed on the motivational factors that influenced thepreferences towards telecommuting by using Relative Importance Index (RII)method. The results showed that “increase flexibility to work at own pace” wasthe most important factor (RII=0.84). Previous studies also mentioned that theimportance <strong>of</strong> individual’s freedom is one <strong>of</strong> the key telecommuting facilitatorsas perceived by employees (Feldman and Gainey, 1997; Pulido and Lopez,2005). “Proper management <strong>of</strong> time” was the second most important factor(RII=0.81) followed by “having more time with family” (RII=0.80), “ability toreduce travel time” (RII=0.78) and “ability to contribute in reducing trafficcongestion” (RII=0.78). Furthermore, “increase comfort <strong>of</strong> workspace (i.e. athome)” (RII=0.76) and “ability to contribute in reducing pollution” (RII=0.75)were the other important factors, according to ranking index, as perceived bythe academic staffs on the factors towards telecommuting. Findings from earlierstudies showed that increasing productivity is considered as a key factor foremployees to adopt telecommuting (Kurland and Bailey, 1999; Lim et al., 2003;Mills et al., 2001; Tung and Turban, 1996). However, this study has found that“increase productivity” (RII=0.74) and “increase job performance” (RII=0.74)were scored low ranking values by the respondents. The other factors whichscored low ranking values are: “ability to reduce stress <strong>of</strong> traveling to work”(RII=0.74), “ability to reduce travel cost” (RII=0.73), “need to travel less”(RII=0.72), “control over physical environment (i.e. at home)” (RII=0.71) and“ability to avoid long commute distance” (RII=0.70). Refer to (Table 10). Theranking <strong>of</strong> these factors indicates what actually perceived as the importantcontributing factors towards willingness to practice telecommuting by theacademic staffs.Table 10: Factors influencing the motivation towards telecommutingFactors influencing theFrequency <strong>of</strong> respondentsR.I.I.* Rankpreference to telecommute (1)* (2)* (3)* (4)* (5)* *Increase flexibility to work at 0 3 13 20 32 0.84 1own paceProper management <strong>of</strong> time 1 6 9 26 26 0.81 2Having more time with the 3 7 10 15 33 0.80 3familyAbility to reduce travel time 4 7 11 15 31 0.78 4Ability to contribute in2 7 15 17 27 0.78 5reducing traffic congestionIncrease comfort <strong>of</strong>3 5 18 19 23 0.76 6workspace (i.e. at home)Ability to contribute in3 6 19 16 24 0.75 7reducing pollutionIncrease job performance 3 9 11 27 18 0.74 8Increase productivity 2 10 13 24 19 0.74 859© 2012 by MIP
Farah Diyanah Ismail, Abdul Azeez Kadar Hamsa & Mansor IbrahimAnalysis <strong>of</strong> Factors Influencing the Stated Preference <strong>of</strong> Academic Employees Towards Telecommutingin IIUM Campus, GombakAbility to reduce stress <strong>of</strong> 4 11 14 13 26 0.74 9travelling to workAbility to reduce travel cost 6 9 15 12 26 0.73 10The need to travel less 5 6 23 10 24 0.72 11Control over physical2 9 26 12 19 0.71 12environment (i.e. at home)Ability to avoid long7 10 15 13 23 0.70 13commute distanceSource: Primary Survey, 2011* (1)= Least Important, (2)= Less Important, (3)= Important, (4)= More Important, (5)= Most Important **R.I.I= Relative Importance IndexPerceived disadvantages on the preference towards telecommutingThis study also investigated perceived disadvantages on the preference towardstelecommuting by the academic staff. The findings showed that “lack <strong>of</strong>resources to accomplish the tasks” as the most important inhibiting factor(RII=0.71) to adopt telecommuting. This finding is in concurrence withMokhtarian and Salomon (1996b) which also states the similar trend. Theresults also showed that “low career advancement”, “decrease job productivity”,“inadequate work environment at home” and “increase level <strong>of</strong> overwork (dueto lack <strong>of</strong> separation between work and family domain)” were scoring a RIIvalue <strong>of</strong> 0.68. “Decrease job performance” (RII=0.67), “lack <strong>of</strong> socialinteraction with colleagues” (RII=0.66), “increase family-work role conflicts”(RII=0.61) and lastly “emotional stress (feeling <strong>of</strong> seclusion)” (RII=0.60) wasthe other inhibiting factors, as perceived by the respondents, to adopttelecommuting. Refer to (Table 11). Recent research indicates that isolation isperceived as one <strong>of</strong> the key factors that may hinder the implementation <strong>of</strong>telecommuting (Kurland and Cooper, 2002; Rognes, 2002).Table 11: Factors influencing the demotivation towards telecommutingFactors influencing theFrequency <strong>of</strong> respondentsR.I.I.* Rankdemotivation towards(1)* (2)* (3)* (4)* (5)* *telecommutingLack <strong>of</strong> resources to1 7 7 8 9 0.71 1accomplish the task remotelyLower career advancement 2 4 12 8 6 0.68 2Decrease job productivity 3 3 11 9 6 0.68 2Inadequate work3 5 9 7 8 0.68 2environment at homeIncrease level <strong>of</strong> overwork 2 5 11 7 7 0.68 2Decrease job performance 3 4 10 9 6 0.67 3Lack <strong>of</strong> social interaction 1 9 7 9 6 0.66 4with colleaguesIncrease family-work roleconflicts4 8 8 7 5 0.61 5© 2012 by MIP 60
PLANNING MALAYSIAJournal <strong>of</strong> the Malaysia <strong>Institute</strong> <strong>of</strong> <strong>Planners</strong> (2012)Emotional stress – feeling <strong>of</strong> 3 11 5 9 4 0.60 6lonelinessSource: Primary Survey, 2011* (1)= Least Important, (2)= Less Important, (3)= Important, (4)= More Important, (5)= Most Important **R.I.I= Relative Importance IndexDISCUSSION AND RECOMMENDATIONSThe implementation <strong>of</strong> telecommuting in higher learning institution will providebenefits in many aspects such as job flexibility to the academic staffs, travel andrelated benefits and reduction in the road and related infrastructure requirementson-campus. Nevertheless, the idea <strong>of</strong> introducing telecommuting in theUniversity poses few challenges, which require careful close considerationbefore implementation. The level <strong>of</strong> achievement <strong>of</strong> job productivity,continuous inspiration to work away from main <strong>of</strong>fice especially at home, needto separate work and family time at home, desired frequency <strong>of</strong> working athome, possible long term benefits to road infrastructure and finally actual level<strong>of</strong> acceptance by academic staffs to work at home are few among them. Thefindings <strong>of</strong> this study showed that 68% <strong>of</strong> the respondents preferred to adopttelecommuting as an alternate work arrangement with an average frequency2.51 days a week. Among the respondents who preferred to adopttelecommuting, female academic staffs (66.2%) were having greater inclinationto practice telecommuting than male counterparts. Moreover, those who areexpressed willingness to adopt telecommuting, 57.6% were married femaleacademic staffs with children. However, the University does not have an <strong>of</strong>ficialpolicy to allow its employees to perform telecommuting.Few recommendations to increase the penetration level <strong>of</strong> telecommutingamong academic staffs are:(1) Formulation <strong>of</strong> telecommuting policy and clearly established procedures onmatters such as frequency <strong>of</strong> telecommuting, eligible staff members, workschedule, equipments and supplies, security and liability, worksite criteria,injury compensation and performance evaluation is highly required.(2) Wan Rozaini and Haitham (2005) stated that telecommuting workarrangement is relatively new among the Universities in Malaysia.Therefore, initiation <strong>of</strong> awareness to promote telecommuting at theUniversities is highly recommended. An earlier study has stated that theintensity <strong>of</strong> promotion could lead to reduction in car commute trips by 3%to 12% in ten years (Cairns et al, 2004). Moreover, a pilot project ontelecommuting should be initiated to ascertain the feedback on the practice61© 2012 by MIP
Farah Diyanah Ismail, Abdul Azeez Kadar Hamsa & Mansor IbrahimAnalysis <strong>of</strong> Factors Influencing the Stated Preference <strong>of</strong> Academic Employees Towards Telecommutingin IIUM Campus, Gombak<strong>of</strong> telecommuting from both supervisors and employees <strong>of</strong> theorganization.(3) Further studies covering other compatible workforce among administrativestaff members <strong>of</strong> the University should be undertaken. Additionally, theviews <strong>of</strong> top management <strong>of</strong> the University in introducing telecommutingshould also need to be considered. This will provide much better insightson the compelling issues facing adoption <strong>of</strong> telecommuting by theUniversity population.CONCLUSIONSTelecommuting is considered as one <strong>of</strong> the travel demand managementmeasures in reducing the amount <strong>of</strong> travel and road infrastructure requirements.The amount <strong>of</strong> travel by private cars has been increasing in IIUM over the yearsbecause <strong>of</strong> increase in population and car ownership level. The increase intravel in and out <strong>of</strong> the campus has induced enormous pressure on the limitedroad, parking and related infrastructure on-campus. Formation <strong>of</strong> long queue <strong>of</strong>vehicles entering and leaving the campus in the morning and evening hours hasbecome a normal phenomenon over the recent years, thereby increasing delaytime. Thus, it has given an indication and immediate attention to address theincreasing traffic problems on-campus. The suitability <strong>of</strong> adoptingtelecommuting in a University setting looks promising because <strong>of</strong> the greaterflexibility involved, especially among academic staffs, in conducting researchand consultancy projects. The findings showed that a high number <strong>of</strong> academicstaffs (68%) were willing to adopt telecommuting for at least few days in aweek. It is more prevalent especially among married female academic staffswith children. A formal telecommuting policy is required to further increase thenumber <strong>of</strong> preferred telecommuters. The formulation <strong>of</strong> policy on matters suchas frequency <strong>of</strong> telecommuting, eligible staff members, work schedule,equipments and supplies, security and liability, worksite criteria, injurycompensation and performance evaluation is required to provide a clearoverview <strong>of</strong> the various aspects involved in practicing telecommuting as analternate work arrangement. However, even with all the policy and proceduresin place, the actual number <strong>of</strong> telecommuters and the associated benefits it maybring over an extended period <strong>of</strong> time is what actually need to be seen.© 2012 by MIP 62
PLANNING MALAYSIAJournal <strong>of</strong> the Malaysia <strong>Institute</strong> <strong>of</strong> <strong>Planners</strong> (2012)ACKNOWLEDGEMENTSThe authors are grateful to International Islamic University Malaysia (IIUM) forproviding facilities and support for this research.REFERENCESAbdalla Nurdeen, Riza Atiq O.K. Rahmat & Amirudin Ismail. (2007). Why DoPeople Use Their Car: A Case Study in Malaysia. Journal <strong>of</strong>Social Science, 3(3): 117 – 122, ISSN 1549-3652.Abdul Azeez Kadar Hamsa & Wan Nurul Mardiah Wan Mohd Rani.(2009).Telecommuting and transportation: relationship andimplications. Kuala Lumpur: IIUM PressAnderson, Alan J. B. (1989). Interpreting data: A first course in statistics. GreatBritian: J. W. Arrowsmith Ltd. Bristol.Bagley, M.N., & P.L. Mokhtarian. (1997). Analyzing the preference for nonexclusive forms <strong>of</strong> telecommuting: modeling and policy implications,Transportation, Vol. 24, pp. 203-226.BERNAMA. (2011). Number <strong>of</strong> cars in Klang Valley to reach 7 million by2020. Retrieved fromhttp://www.bernama.com/bernama/v5/newsbudget2012.php?id=618416.Brown, J. M. O. (2010). Telecommuting: the affects and effects on notelecommuters. Faculty <strong>of</strong> the Virginia Polytechnic <strong>Institute</strong> and StateUniversity.Cairns, S., Sloman, L., Newson, C., Anable, J., Kirkbride, A. & Goodwin, P.(2004). Smarter Choices Changing the Way We Travel, Department forTransport, London.Coyle, J. J., Novack, R. A., Gibson, B. J. & Bardi, E. J. (2011). Transportation:supply chain perspective (7 th ed.). United States: South –WesternCengage Learning.Drucker, J., & Khattak, A.J. (2000). Propensity to work from home – modelingresults from the 1995 nationwide personal transportation survey.Transportation Research Record, Vol. 1706, pp. 108-117.Ellison, N. B. (1999). Social impacts: New perspectives on telework. SocialScience Computer Review, 17(3), pp. 39-49.Fairweather, N. B. (1999). Surveillance in employment: The case <strong>of</strong>teleworking. Journal <strong>of</strong> Business Ethics, 22(1), pp. 39-49.Feldman, D. & Gainey, T. (1997). Patterns <strong>of</strong> telecommuting and theirconsequences: framing the research agendaǁ. Human ResourceManagement Review, Vol. 7 No. 4, pp. 369-88.63© 2012 by MIP
Farah Diyanah Ismail, Abdul Azeez Kadar Hamsa & Mansor IbrahimAnalysis <strong>of</strong> Factors Influencing the Stated Preference <strong>of</strong> Academic Employees Towards Telecommutingin IIUM Campus, GombakJiang, Yi. (2008). The impact <strong>of</strong> telecommuting on the journey to work: A twosample instrumental variables approach. Two empirical essays inenvironmental and urban economics. University <strong>of</strong> Maryland: ProQuestLLC.Joice, W. (1999). Workshop 1: Getting educated. International TeleworkAssociation & Council. Retrieved fromhttp://www.telecommute.org/twa/workshop1.Kitamura, R., Nilles, J. M., Conroy, P. & Fleming, D. M. (1990).Telecommuting as a transport planning measure: Initial results <strong>of</strong>California pilot project. UC Transportation Center, No.58, pp. 98-104.Kurland, N. & Bailey, D. (1999). When workers are here, there, andeverywhere: a discussion <strong>of</strong> the advantages and challenges <strong>of</strong> telework.Organizational Dynamics, pp. 53–68.Kurland, N. & Cooper, C. (2002). Manager control and employee isolation intelecommuting environments. Journal <strong>of</strong> High Technolog ManagementResearch, Vol.13, pp. 107–126.Lim, H., Van der Hoorn, A. & Marchau, V. (2003). The effects <strong>of</strong> telework onorganization and business travel. Paper submitted for Symposium onTeleworkingǁ, 4 th Interbalkan Forum International IT conference,S<strong>of</strong>ia, Bulgaria, 6-7 October 2003.Mann, S. (2000). An exploration <strong>of</strong> the emotional impact <strong>of</strong> teleworking viacomputer mediated communication. Journal <strong>of</strong> Managerial Psychology,Vol. 15 No. 7, pp. 668-690.Mannering, J. S. & Mokhtarian, P. (1995). Modeling the choice <strong>of</strong>telecommuting Frequency in California: An exploratory analysis.Technological Forecasting and Social Change 49, pp. 49–73.Mills, J., Wong-Ellison, C., Werner, W., & Clay, J. (2001). Employer liabilityfor telecommuting employees. Cornell Hotel and RestaurantAdministration Quarterly, Vol. Oct-Nov., pp. 48 – 59.Mohamed G. Aboelmaged & Abdallah M. Elamin. (2009). Teleworking inUnited Arab Emirates (UAE): An empirical study <strong>of</strong> influencingfactors, facilitators, and inhibitors. Int. Journal <strong>of</strong> Business Science andApplied Management, Volume 4, Issue 1.Mokhtarian, P.L. & Meenakshisundaram, R. (2002). Patterns <strong>of</strong> telecommutingengagement and frequency. Prometheus, Vol. 20, No. 1, pp. 21-37.Mokhtarian, P.L. & Salomon, I. (1997). Modeling the desire to telecommute:the importance <strong>of</strong> attitudinal factors in behavioral models.Transportation Research Part A 31 (1), pp. 35-50.© 2012 by MIP 64
PLANNING MALAYSIAJournal <strong>of</strong> the Malaysia <strong>Institute</strong> <strong>of</strong> <strong>Planners</strong> (2012)Mokhtarian, P. L. & Salomon, I. (1996a). Modeling the choice <strong>of</strong>telecommuting: the importance <strong>of</strong> attitudinal factors in behavioralmodels. Environment and Planning, Vol. 28, pp. 1877-1894.Mokhtarian, P. L. & Salomon, I. (1996b). Modeling the choice <strong>of</strong>telecommuting 2: A case <strong>of</strong> the preferred impossible alternative.Environment and Planning A. Vol. 28, pp. 1859-1876.Mokhtarian, P. L. & Salomon, I. (1996c). Modeling the choice <strong>of</strong>telecommuting 3: Identifying the choice set and estimating binarychoice models for technology-based alternatives. ForthcomingEnvironment and Planning A. Vol. 28, pp. 1877-1894.Peters, P., Tijdens, K. & Wetzels, C. (2004). Employees‘ opportunities,preferences, and practices in telecommuting adoptionǁ. Information &Management, Vol. 41 No. 4, pp. 469-82.Popuri, Y. & Bhat, C.R. (2003). On modeling choice and frequency <strong>of</strong> homebased telecommuting. Transportation Research Record, Vol.1858, pp.55–60.Pulido, J. & Lopez, F. (2005). Teleworking in the information sector in Spain,International Journal <strong>of</strong> Information Management, Vol. 25, pp. 229239.Rognes, J. (2002). Telecommuting resistance, s<strong>of</strong>t but strong: Development <strong>of</strong>telecommuting over time, and related rhetoric, in three organizations.SSE/EFI Working Paper Series in Business Administration, No 2002:1,Stockholm School <strong>of</strong> Economics, Sweden.Sabariah Jemali. (2011). Getting the public transport policy right. The EdgeFinancial Daily. Retrieved from http://my.news.yahoo.com/gettingpublic-transport-policy 031502581.html.Safirova, Elena & M. Walls. (2004). What have we learned from a recentsurvey <strong>of</strong> teleworkers? Evaluating the 2002 SCAG Survey. DiscussionPaper 04–43, NW: Resources for the Future, Washington, D.C.Sullivan, M.A., H.S. Mahmassani & J-R. Yen. (1993). Choice model <strong>of</strong>employee participation in telecommuting under a cost-neutral scenario.Transportation Research Record 1413, TRB, National ResearchCouncil, Washington, D.C., pp.31-41.The Star. (2007). Aiming to be premier Islamic university. Retrieved 2011-0417.Thériault, M., P. Villeneuve, M. Vandersmissen, & F. Des Rosiers. (2005).Home working, telecommuting and journey to workplaces: aredifferences among genders and pr<strong>of</strong>essions varying in space?. The 45 thCongress <strong>of</strong> the European Regional Science Association, 23-27 August2005, Vrije Universiteit Amsterdam.65© 2012 by MIP
Farah Diyanah Ismail, Abdul Azeez Kadar Hamsa & Mansor IbrahimAnalysis <strong>of</strong> Factors Influencing the Stated Preference <strong>of</strong> Academic Employees Towards Telecommutingin IIUM Campus, GombakTremblay, Diane-Gabrielle. (2003). Telework: A new mode <strong>of</strong> genderedsegmentation? Université du Québec: Télé Université.Tung, L-L. & Turban, E. (1996). Information technology as an enabler <strong>of</strong>telecommuting. International Journal <strong>of</strong> Information Management,Vol.16 No. 2, pp. 103-18.Walls, M., Safirova, E., and Y. Jiang. (2007). What Drives Telecommuting?Relative Impact <strong>of</strong> Worker Demographics, Employer Characteristics,and Job Types Transportation Research Record 2010: TRB, NationalResearch Council, Washington, D.C., pp.111-120.Wan Rozaini Sheik Osman and Haitham Rashdan. (2005). Exploring thepossibility <strong>of</strong> implementing telecommuting at University UtaraMalaysia (Master’s thesis). Retrieved fromhttp://etd.uum.edu.my/1187/.Wells, Kimberly, F. Douma, H. Loimer, L. Olson, & C. Pansing. (2001).Telecommuting implications for travel behavior: case studies fromMinnesota. Transportation Research Record, Vol. 1752, pp. 148–5.Yamane, Taro. (1967). Statistics, An Introductory Analysis 2 nd Ed. New York:Harper and Row.Yap, C. S. & Tng, H. (1990). Factors associated with attitudes towardstelecommuting. Information & Management, Vol. 19, pp. 227–235.Yen, J-R and Mahmassani. (1997). Telecommuting adoption: Conceptualframework and model estimation. Transportation Research Record1606: 95-102.Yen, J-R. and H.S. Mahmassani. (1994). The Telecommuting Adoption Process:Conceptual Framework and Model Development. Report 60055-1,Center for Transportation Research, The University <strong>of</strong> Texas at Austin,Austin, Texas.© 2012 by MIP 66
PLANNING MALAYSIAM y I PP N IAL AN S PAS S AINA L I YN M N M A1 2y P yAand publics’ views are clearly pertinent in urban’IN I N© 2012 by MIP
Noralizawati Mohamed, Noriah Othman & Mohd Hisham AriffinThe Potential <strong>of</strong> Urban Forest Park for Sustainable Cityenvironment (Noralizawati, 2009). In 2011, the world’s population crossed overthe 7 billion mark, and the United Nations Population Division projects thisfigure could reach 9.3 billion by 2050 and more than 10 billion by the end <strong>of</strong> thecentury (United Nation Conference on Sustainable Development, 2012).As for Malaysia, it is predicted that by year 2020, 73% <strong>of</strong> thepopulation will be urbanites (Nor A’aini and Kamarul’ain, 2007). In line withthis, the National Town and Country Planning Department and LandscapeDepartment had taken steps by developing more urban parks and urban forestparks to enhance the quality and sustainability in urban environment. Generally,urban forest parks can be found in gazetted forest areas <strong>of</strong> urban areas. Asmentioned by Noor Azlin and Sabri (1997), these parks are designated areas forconservation <strong>of</strong> local flora and fauna as well as areas where environmentaleducation and recreation can be conducted. They are also a great assets for thecities and urbanities (Sreetheran, 2007), created to preserve existing vegetation(Noralizawati, 2009), enhance natural environment (Noralizawati, 2011), forpeople to gain a positive psychology (Kaplan, 1973) and increase aestheticvalues in city centre (Noriah, 2004).Although achieving sustainable cities are crucial in the urbanizationworld (Yin and Siong, 2011), analysis <strong>of</strong> the landscape and natural environmentliteratures showed that these objective can be achieved through systematicplanning on natural resource and urban forest parks have been given muchattention for this (Chiesura, 2004; Noralizawati, 2011; Oku and Fukamachi,2005 and Ozguner and Kendle, 2007). The overview <strong>of</strong> landscape designresearch by previous researchers agreed that the urban forest park shouldnaturally design and represent great diversity for biotic and abiotic componentsaround the forest (Noralizawati, 2011 and Ozguner and Kendle, 2007). TheNational Landscape Policies under the Housing and Local Government Ministry<strong>of</strong> Malaysia interprets these natural resources as national heritage areas whichmust be conserved and manage sustainably as an investment to benefit thenation. At a higher level, sustainable city approaches that is summarized by thecommittee <strong>of</strong> United Nation Conference on Sustainable Development as animportant evidence-based for world recognition. Table 1 provides an indicativelist <strong>of</strong> focus areas for priority attention.© 2012 by MIP
PLANNING MALAYSIAJournal <strong>of</strong> the Malaysia <strong>Institute</strong> <strong>of</strong> <strong>Planners</strong> (2012)Table 1: Focus areas for priority attention at Rio +20 as articulated by member states and major groupsFocus areas for priority attention1. Green jobs, youth employment and social inclusion2. Energy access, efficiency, sustainability3. Food security, sustainable agriculture4. Water5. Sustainable city6. Management <strong>of</strong> the oceans, fisheries and other marine resources7. Improve resilience and disaster preparednessSource United Nation Conference on Sustainable evelo ment, 2012THE SUSTAINABLE CITYThe Bruntland Report 1987 defines sustainable development as a ‘developmentwhich meets the needs <strong>of</strong> present generation without compromising the ability<strong>of</strong> future generation to meet their own needs’. Through studies in Hong Kong,Netherland, United Kingdom and apan, the ability <strong>of</strong> urban parks as provider<strong>of</strong> social services and their importance for city sustainability has been addressed(Chiesura, 2004, Lo and im, 2010; Oku and Fukamachi, 2005 and Ozguner andKendle, 2007 ). The potential <strong>of</strong> Urban Forest Park and publics’ views areclearly pertinent in urban greening and sustainability, yet they are <strong>of</strong>ten ignoredby certain countries. In a nutshell, the strategies for certain cities are mainlyfocus on man-made elements and built components. As mentioned by Yin andSiong (2010), the future <strong>of</strong> our cities lies in the action we make today. Thus, thisaim should be clearly identified and understood by many urban residents inrelationship with their surrounding landscapes.It is known that urban forest parks carry lots <strong>of</strong> functions in urbanenvironment. esides important in environmental services such as stabilize themicroclimate and air purification, the urban forest parks which were developedin the perimeters <strong>of</strong> forest reserve in the urban area <strong>of</strong>fered many recreationalactivities, facilities and were beneficial for education purposes (Noralizawati,2009). Oku and Fukamachi (2006) addressed that the presence <strong>of</strong> landscapesetting and public choice <strong>of</strong> activities in forest parks contributes to the quality <strong>of</strong>life and sustain the communities in many ways. As an example, the ForestRecreational Park at FRIM (Forest Research Institution <strong>of</strong> Malaysia) has beendeveloped the forest research area into a successful botanical garden, naturaltrail and recreational spot. This park has received high number <strong>of</strong> local andinternational visitors due to its natural setting, recreational facilities andecological function towards environment. The ukit Nanas Forest Reserve inKuala Lumpur and Urban Forest Park in Kota Damansara and ohore ahru69© 2012 by MIP
Noralizawati Mohamed, Noriah Othman & Mohd Hisham AriffinThe Potential <strong>of</strong> Urban Forest Park for Sustainable Cityalso becoming the green iconic for urban people too. These parks enrich theirquality <strong>of</strong> life, reduce stress and encourage social integration among visitors.THE URBAN FOREST PARKAccording to Noor Azlin and Ahmad Nazaruddin (2003), the green areas withinand near town municipality areas are termed as urban forest. Grey and Deneke(1986) defined urban forest to include all greenbelts, municipal watershed,recreation sites and roadsides. In Malaysia, over than 60% <strong>of</strong> its total land areais forested and the biodiversity is immense including the urban forest park. Theurban forest is a concept that encompasses the natural landscape and series <strong>of</strong>vegetation <strong>of</strong> a city. It attempts to provide a different understanding regardingits naturalistic landscape pattern, low maintenance and self-sustaining greenarea as compared to modern and formal garden.In 1986, ustice urged Kuala Lumpur to adopt the urban forestlandscape concept since it still has lots <strong>of</strong> reserve forest in the middle <strong>of</strong> thecity. He believed that this concept could be as foundation for better opportunityin greening and sustaining the Kuala Lumpur in future. And today, the<strong>Malaysian</strong> local planners have also set a plan to gazette more green spaces inmaster plan development and investigate the value <strong>of</strong> this Mother Nature whichin turn is a key component for sustainable development. The degree for masterplan that is ideal and equilibrium for green urban structure may also vary by thesize <strong>of</strong> existing and proposed green space, population density, landscape qualityand healthy life style <strong>of</strong> urban residents. The study was conducted at FRIM(Forest Research Institution <strong>of</strong> Malaysia). FRIM is located in the middle <strong>of</strong>Kepong City and surrounded by the ukit Lagong Forest Reserve. The forestpark represents naturalistic landscape pattern and it is maintained through thepreservation <strong>of</strong> existing vegetation and well controlled by human influenced(Noralizawati, 2009). Here visitors will be rewarded with a breath-taking view<strong>of</strong> the surrounding forest. The sound <strong>of</strong> birds singing and the occasional shrill <strong>of</strong>insects tantalize the mind and makes one forget the hustle and bustle <strong>of</strong> KepongCity activities that surrounds the park.© 2012 by MIP 70
PLANNING MALAYSIAJournal <strong>of</strong> the Malaysia <strong>Institute</strong> <strong>of</strong> <strong>Planners</strong> (2012)METHODOLOGYThe data collections have been collected through a survey conducted amongvisitors at Forest Recreational Park at FRIM. The study used structureddesigned questionnaires to collect data from the visitors <strong>of</strong> the study area. Fieldstudy observations and a pilot test were done to obtain information on theimprovement <strong>of</strong> the questionnaire. A face-to-face administration <strong>of</strong> the surveywas done and visitors approached in the park were first informed about survey’sobjectives. Only willing visitors to participate will be taken as respondents forthe study. The objectives will be limited to the following issues: (Section A)Demographic background question, (Section ) Reason for visiting the studyarea- instrumental, social or dispositional reasons, (Section C) Survey onenvironmental, social and physical contributions <strong>of</strong> the study area (Section D)Expectation towards urban forest park in meeting their current and future needs.The survey was conducted on October until December 2011. Thestatistic <strong>of</strong> visitors as reported by Human Resource Division <strong>of</strong> FRIM is200,000 every year and the monthly average is 16,666 visitors. For thisresearch, there were 375 respondents participated in this study. These numbersprojected based on a statistical table by Krejcie and Morgan (1970) cited fromSekaran (2003). They suggested that, if the population (N) is 16,666, the samplesize (n) should be 375. The questionnaires have been distributed on bothweekdays and weekends during the day and subjected to visitors that agreed tocooperate and spend their time for the survey. The results and findings from thesurvey provided rooms for urban planners, landscape architects, forestconservator, environmentalist and anybody who are interested to explore thepotential <strong>of</strong> Urban Forest Park in sustaining the city.RESULTS AND DISCUSSIONThe value for the the Cronbach’s alpha coefficients for the survey questionnaireis 0.70. According to Pallant (2005), the results between 0.70 – 0.80 shows anacceptable reliability <strong>of</strong> questionnaires development.a) Demographic BackgroundFrom the demographic background data analysis, 53.3% <strong>of</strong> respondents weremale and 46.7% were female. Malay ethnic represents 38.7% followed by27.5% for Chinese, 30.9% for Indians. The international visitors that took partin this survey were determined as 0.5% from Sweden, 1.3 % from China and71© 2012 by MIP
Noralizawati Mohamed, Noriah Othman & Mohd Hisham AriffinThe Potential <strong>of</strong> Urban Forest Park for Sustainable City1.1% from apan. The average respondents were from 18 to 50 years old.Among all age groups, the highest percentage 40.2% which represents age from18 to 30 and the lowest is 12.3% represents from 51 years old and above.The average level <strong>of</strong> education <strong>of</strong> respondents is with degree which is 34.0%,and only 14.8% were graduated with Masters and 9.3% with PhD. Workersfrom private sectors represents 31.5% were the largest group in the distribution<strong>of</strong> respondents, followed by 30.1% for students, 23.7% for government servantand 14.7% for retired.b) Respondents’ Reason <strong>of</strong> VisitingThe result in Table 2, 3 and 4 shows the reason <strong>of</strong> visiting by the respondents.Under Table 2, 45.6% <strong>of</strong> them gave a ‘very strong reason’ and 33.3% gave a‘strong reason’ answer for Instrumental Reason which is to get result that givebenefit to their work and study. For the Social Reason in Table 3, it is reportedhigh rating where 44.3% from the total respondents gave a ‘very strong reason’and 39.7% gave a ‘strong reason’ to accompany or socialize with family andtheir friends. The Dispositional Reason in Table 4 includes the reason that theyreally interested with the place and like the recreational activities and 62.4%answered a ‘very strong reason’ and 26.9% for a ‘strong reason’. The overview<strong>of</strong> the analysis concludes that majority <strong>of</strong> respondents rated a ‘very strongreason’ answer for all reason. The result <strong>of</strong> this study identified a high numberrespondents showed their interest towards the study area. These findings arealso consistent with those <strong>of</strong> previous documenting people’s preference andpurpose when visiting forest landscape (Park, 2011; Matsuoka and Kaplan,2007; Tsunetsugu et al., 2010). The previous research finding (Noralizawati,2009; Noralizawati, 2011; Ozguner and Kendle, 2006; Todorova et. al, 2004)identified some differences between visitor’s reason for visiting and theirperception about the forest setting. These findings were taken into account and aset <strong>of</strong> qualitative analysis was done to measure their perception and severalanswers on benefits and potentials <strong>of</strong> study area were identified.Table 2: Instrumental Reason (to get a result that give benefit to work/study)Answer Frequency PercentageVery weak reason 11 2.9Weak reason 57 15.3Strong reason 125 33.3Very strong reason 171 45.6Not a reason 11 2.9Total 375 100.0© 2012 by MIP 72
PLANNING MALAYSIAJournal <strong>of</strong> the Malaysia <strong>Institute</strong> <strong>of</strong> <strong>Planners</strong> (2012)Table 3: Social Reason (to accompany or socialize with family/friend)Answer Frequency PercentageVery weak reason 19 5.1Weak reason 30 8.0Strong reason 149 39.7Very strong reason 166 44.3Not a reason 11 2.9Total 375 100.0Table 4: Dispositional Reason (really interested with the place and like the recreational activities)Answer Frequency PercentageVery weak reason 0 0Weak reason 40 10.7Strong reason 101 26.9Very strong reason 234 62.4Not a reason 0 0Total 375 100.0Figure 1 shows the percentage <strong>of</strong> most mentioned keywords from thesurvey. Under Instrumental Reason, the feeling <strong>of</strong> ‘Escape from busy city’accounts for almost 79.4% <strong>of</strong> the data obtained. It has been agreed by Chiesura(2004) that a park experience may escape people from hectic and busy city aswell as provide a sense <strong>of</strong> peacefulness and relax our mind. ‘Love the naturescenery’ accounts 64.0% from total respondents. This finding is associated withprevious research done by Noralizawati (2009) where the strongly preferredsceneries such as water, dense and matured tree scene were highly rated andaccording to Hull and Stewart (1995) and Yang and rown (1992), as innaturalistic landscape, these natural elements are always stated as a positivefocal point for visitors. 42.7% told that they also came to the study area to‘Relax their mind’. This is supported by Schroeder (1986) that naturalenvironments with vegetation and water induce relaxed and less stressfulcompared with urban scenes with no vegetation. The ‘Research and educationbenefits’ answer represents 31.2% and majority <strong>of</strong> the answers were given byschool and university students as well as researcher from government andprivate companies. It is associated with the status <strong>of</strong> FRIM which is known asthe best place to gain and practice knowledge.73© 2012 by MIP
Noralizawati Mohamed, Noriah Othman & Mohd Hisham AriffinThe Potential <strong>of</strong> Urban Forest Park for Sustainable CityEscape from busy/ polluted city298Love the nature scenery (flora/fauna)240Relax mind160Research and education benefit/Plantsand environmental studies117100 200 300 400Figure 1: Keywords for Instrumental Reason (to get a result that give benefit to work and study)A strong relationship has been identified in Figure 2 where the SocialReason somehow plays an important role for the respondents. The reason for‘Family/friends gathering’ indicates 52.3% and ‘School/university academictrip’ reason indicates 51.2%. Those results portrays that the ability <strong>of</strong> urbanforest parks to function as social network. As stated by Coley et al., (1997)nature encourages the use <strong>of</strong> outdoor spaces, increase social integration andinteraction. The reason for ‘To get privacy’ accounts 41.1% in this study. Thisfinding supported research done by Hammit (2002) that parks can also be aplace for people to find degrees <strong>of</strong> privacy. Noralizawati (2009) found in herprevious study that the feeling <strong>of</strong> privacy also associated with viewing natureand restoring mental and spiritual activities. 13.3% <strong>of</strong> the respondents answer to‘Make new friend/Share ideas’. As explained by Conway (1991) the interactionamong the park visitors can prevent social tensions thus improving the physicaland moral conditions <strong>of</strong> urban citizens.Family/friends gathering211School/university academic trip192To get privacy154Make new friend/Share ideas50100 200 300 400Figure 2: Keywords for Social Reason (to accompany or socialize with family and friend)© 2012 by MIP 74
PLANNING MALAYSIAJournal <strong>of</strong> the Malaysia <strong>Institute</strong> <strong>of</strong> <strong>Planners</strong> (2012)Figure 3 shows the Dispositional category results and it is identified thatthe ‘Like the natural forest setting’ is the most liked reason gave by therespondents and indicates 80.5% from the survey. Study conducted by Park(2011) identified the natural setting is the most preferable for urban residentsand Chiesura (2004) stated that the presence <strong>of</strong> natural assets (i.e. urban parksand forest) and components (i.e. tree, water) in urban contexts contributes to thequality <strong>of</strong> life and visual. The reason for ‘Exercise/recreation/meditation’represents 53.3%. Through an observation, some respondents reported that theyhad a passion for physical activities and it shows that the tendency <strong>of</strong> visitingthe study area is getting higher when it is associated with activities and properfacilities. As highlighted by Noralizawati (2010) and Oku and Fukamachi(2006) the increasing demands for forested areas is for the one that providegood recreational facilities. 57.1% represents for ‘Green and well preserved’reason and 53.3% for ‘Fresh air/unpolluted water’. It has been identified that therelationship <strong>of</strong> people and preference towards study area spans a wide range <strong>of</strong>environmental benefits.Like the natural forest setting302Exercise/Recreation/Meditation255Green and well preserved214Fresh air, unpolluted water200100 200 300 400Figure 3: Keywords for Dispositional Reason (really interested with the place)c) Survey on Environmental, Social and Physical ContributionsIt is found that the respondents’ evaluation on environmental contribution atstudy area is associated with great and intense environmental values. 33.5% <strong>of</strong>respondents mentioned that the forest setting could balance the urbanecosystem, 29.0% <strong>of</strong> respondents agreed the forest setting could filter airpollution around the city, while 26.6% <strong>of</strong> respondents believed it is rich withbiodiversity and 10.9% said they like the forest setting and green landscape.This is clearly showed that the biodiversity and forest ecosystem that listedunder this component will play a vital role in facilitating sustainable city.Furthermore, according to research article by FRIM Research Unit, an analysison carbon footprint on June 2012 identified the level <strong>of</strong> Carbon dioxide75© 2012 by MIP
Noralizawati Mohamed, Noriah Othman & Mohd Hisham AriffinThe Potential <strong>of</strong> Urban Forest Park for Sustainable Cityemission <strong>of</strong> FRIM Research and Design activities was 50 times less than theamount <strong>of</strong> Carbon dioxide sequestered by the dipterocap trees in FRIM. Fromthis environmental finding, it is clearly shows that the FRIM ForestRecreational Park has a high potential as a tool in developing a sustainable city.Survey on social contribution reported a growing body <strong>of</strong> evidence indicatingthat exposure and social activities at urban forest park have beneficial effects onrespondents. 42.4% <strong>of</strong> respondents agreed that the study area provides space forpublic engagement either formal or informal way. 25.1% <strong>of</strong> respondentsmentioned certain spaces as appropriate for recreation and safe for children,disable person and senior citizens. 17.8% stated it serves as a resource for reliefand escape from troubles and tensions and aid in our daily lives. 9.1% said thestudy area is the best place to be away from crowded city, 5.6% mentioned theplace <strong>of</strong>fers them to think through personal matters and share confidence andintimacies with family and friends. From the findings, it is confirmed thatrespondents’ interpretation are valuable and should be taken into account bypr<strong>of</strong>essionals since they are the users and responsible to ensure thesustainability <strong>of</strong> urban forest for future generation. Research finding on thephysical aspects should be considered as an important contribution just likeenvironment and social. 48% <strong>of</strong> respondents mentioned they like the landscapecharacter such as landforms, vegetation and water forms and 31.2% stated awell arrangement <strong>of</strong> facilities for recreational purposes. 13.4% <strong>of</strong> respondentssuggested the management to preserve and protect the flora and fauna, 7.4%suggested the management to upgrade the research facilities and educate publicon the function <strong>of</strong> study area. According to them also, the public choice <strong>of</strong>activities is very much depending on the safety, functionality and informationthat provides for them. Therefore, proper design guidelines must be introducedto ensure the suitability and maximize the usage <strong>of</strong> facilities in the urban forestsetting.© 2012 by MIP 76
PLANNING MALAYSIAJournal <strong>of</strong> the Malaysia <strong>Institute</strong> <strong>of</strong> <strong>Planners</strong> (2012)d) Expectation in Meeting Respondents’ Current and Future NeedsThe final section is the result on respondent’s expectation. Regarding the studyarea in meeting their current and future needs, it is reported that 66% <strong>of</strong> themindicated high expectation regarding the capability in protecting naturalresource, improve the environment quality and sustaining future needs. Asmentioned by Chiesura (2004), the nature fulfills important in-material humanneeds as well. Only 22% gave low expectation and predict the potential <strong>of</strong>existing place would shrink since it is located in a middle <strong>of</strong> the city thatexposed to lots <strong>of</strong> urbanization impact and 8% showed mixed feeling towardsthe question.CONCLUSIONAccording to previous findings above, the researcher illustrates the relationshipbetween urban forest park and city sustainability as shown in Figure 4. Thosecomponents play an important role to support the sustainability and healthyurban forest; it must be preserved and avoided from any distraction. This issupported by the World’s Civil Society Organizations and as listed by them, thesustainable development goals should make an agreement on healthy forest,green cities and also public participation programme (United Nation Conferenceon Sustainable Development, 2012). Public expectation and their reasons tocome to the study area should be taken into account. Even though the overallpercentage <strong>of</strong> survey showed that public gave good expectation, however, thesmall percentage could be an eye opener as they assumed the existing settingwill face big challenge to sustain in the future. It is hoped that the identifiedpotentials in Urban Forest Park and positive public involvement can serve asreference criteria for local planners, landscape architects, park managers andother related pr<strong>of</strong>essionals to envision more sustainable city strategies in thefuture.77© 2012 by MIP
Noralizawati Mohamed, Noriah Othman & Mohd Hisham AriffinThe Potential <strong>of</strong> Urban Forest Park for Sustainable CityEnvironmental(biodiversity, forestecosystem)UrbanforestparkSocial (publicengagement andexpectation)PotentialCitysustainabilityPhysical (amenitiesand public activities)Source: Researchers, 2012Figure 4: Relationship between Urban Forest Park and City Sustainability© 2012 by MIP 78
PLANNING MALAYSIAJournal <strong>of</strong> the Malaysia <strong>Institute</strong> <strong>of</strong> <strong>Planners</strong> (2012)REFERENCESChiesura, A. (2004). The role <strong>of</strong> urban parks for the sustainable city. Landscapeand Urban Planning, 64, 129-138.Coley, R., Kuo, F., & Sullivan, W. (1997). Where does community grow? Thesocial context created by nature in urban public housing. Environmentand Behavior, 29, 468-494.Conway, H. (1991). People's parks: The design and development <strong>of</strong> VictorianParks in Britain. Cambridge University Press.Grey, G.W and Deneke, F.J.(1989). Urban forestry. Second edition. John Wileyand Sons. New York, U.S.A.Hammitt, W. E. (2002). Urban Forests and parks as privacy refuges. Journal <strong>of</strong>Arboriculture, 28, 19-26.Hisham, M.A.(2008). Motives for participation into Continuing Pr<strong>of</strong>essionalDevelopment Activities by <strong>Malaysian</strong> Licensed/ RegisteredPr<strong>of</strong>essionals in the Construction and Real Estate Industries.Unpublished research, Universiti Teknologi MARA.Hull, R. B., & Stewart, W. P. (1995). The landscape encountered andexperience while hiking. Environment and Behavior, 27, 404-426.http://www.frim.gov.myhttp://www.uncsd2012.orgJustice, C.L. (1986). The concept <strong>of</strong> the urban forest as applied to KualaLumpur. Journal <strong>of</strong> Arboriculture, 12, 178-181.Kaplan, R. (1973). Some psychological benefits <strong>of</strong> gardening. EnvironmentalBehavior, 5, 145-152.Lo, A.Y.H., and Jim, C.Y (2010). Differential community effects onperception and use <strong>of</strong> urban greenspaces. Landuse policy, 6, 430-442Matsuoka, R. H., and Kaplan, R. (2008). People needs in the urban landscape:Analysis <strong>of</strong> landscape and urban planning contributions. Landscape andUrban Planning, 84, 7-19.Noor Azlin, Y., and Sabri, N. (1997). Forest recreation environment: Visitorspreferences and perceptions. FRIM, 1, 1-12.Noor Azlin, Y and Ahmad Nazaruddin, M.R. (2003). Benefits <strong>of</strong> urban forest:FRIM Papers: Habitat Malaysia, 7, 80-87.Noriah, O. (2004). A cross cultural comparison on preferences towards selectedurban landscape planting compositions. Unpublished doctoraldissertation, Universiti Teknologi MARA.Nor' A aini, O., and Kamarul Ain, K. (2007, November). Keeping the green inurban area: An approach towards sustainable development. Proceeding<strong>of</strong> the Seminar Kebangsaan Rupabandar Malaysia, 28 - 29 November2007, Lumut, Perak.79© 2012 by MIP
Noralizawati Mohamed, Noriah Othman & Mohd Hisham AriffinThe Potential <strong>of</strong> Urban Forest Park for Sustainable CityNoralizawati, M. (2009). Public Preferences Towards Naturalistic and DesignedLandscape Pattern. Unpublished doctoral dissertation, UniversitiTeknologi MARA.Noralizawati, M. (2011). Assesing the Visual Quality <strong>of</strong> Penang BotanicalGarden. Unpublished research report, Universiti Teknologi MARA.Oku, H., and Fukamachi, K. (2006). The differences in scenic perception <strong>of</strong>forest visitors through their attributes and recreational activity.Landscape and Urban Planning, 75, 34- 42.Ozguner, H., and Kendle, A. D. (2007). Attitudes <strong>of</strong> landscape pr<strong>of</strong>essionalstowards naturalistic versus formal urban landscapes in the UK.Landscape and Urban Planning, 81, 34-45.Pallant, J. (2005). SPSS survival manual: A step by step guide to data analysisusing SPSS. Allen and Unwin.Park, B.J. (2011). Relationship between psychological responses and physicalenvironments in forest settings. Landscape and Urban Planning, 101,117-145.Schroeder, H. W. (1986). Estimating park tree densities to maximize landscapeaesthetics. Journal <strong>of</strong> Environmental Management, 23, 325- 333.Sekaran, U. (2003). Research methods for business: A skill building approach.John Wiley and Sons, Inc.Sreetheran, M., and Kamariah, D. (2007). Performance indicators to evaluateurban parks from the saftey and security perspective. Proceeding <strong>of</strong> theSeminar Kebangsaan Rupabandar Malaysia. 28- 29 November 2007,Lumut, Perak.Todorova, A., Asakawa, S., & Aikoh, T. (2004). Preferences for and attitudestowards street flowers and trees in Sapporo, Japan. Landscape andUrban Planning, 69, 403- 416.Tsunetsugu, B. (2010). Shirinyoku: Taking in the Forest Atmosphere and ForestBathing in Japan. Environmental Health and Preventive Medicine, 151,27-37.Yang, B. E., & Brown, T. J. (1992). A cross- cultural comparison <strong>of</strong> preferencesfor landscape styles and landscape elements. Journal <strong>of</strong> EnvironmentalBehavior, 24(4), 471- 507.Yin, N.S and Siong, H.C. (2010). The relationship between urban populationdensity and transportation fuel consumption in <strong>Malaysian</strong> cities.Journal <strong>of</strong> Planning Malaysia, 8, 45-66.© 2012 by MIP 80
PLANNING MALAYSIAM y I PI N SS P ISI N N S A IIN MA I N SIGNAG A AS S Y IN NA I NALISLAMI NI SI Y MALAYSIA G M A AMP SS S S M M1 2yyAprovided. There is lack <strong>of</strong> study, however, on the impacts <strong>of</strong> and drivers’ responsesUniversity Malaysia’s young student drivers as the unique purposive samples, statisticalinfluenced drivers’ responses towards the information conveyed by the signages.IN I NCastro and Horberry, 2004; Bell, Bonsall, and O’Falherty© 2012 by MIP
Syazwani Sahrir, Syahriah Bachok & Mariana Mohd. OsmanThe Effectiveness <strong>of</strong> Provision <strong>of</strong> New Static Information Signage: A Case Study <strong>of</strong> IIUM, Gombakcontrol devices subscribed to the detailed requirements or conditions affectingroad use at specific places and times in order that proper actions may be takenso as to avoid accidents or delays (Cunard, 1999). Control devices are necessaryfor strangers to the locale or for the first time users. The underlying principles<strong>of</strong> traffic control devices are: 1) design factors, 2) position or placement, 3)maintenance <strong>of</strong> condition and visibility, and 4) uniformity <strong>of</strong> application anduse (Cunard, 1999).Traffic signs are signs erected at the side <strong>of</strong> roads to provide guidanceto the road users. Traffic sign can be divided into four which are: 1) warningsigns, 2) regulatory signs, 3) informatory signs and 4) direction signs (Slinn,Matthews and Guest, 2005). Traffic signs help creates a safer environment forroad users by visually communicating information relating to regulations,warnings, directional and locational guidance to drivers and pedestrians. Theinformation must be unambiguous and conveyed in a manner that is suited tothe type <strong>of</strong> road condition and traffic characteristics. Traffic signs play anincreasingly important role in daily traffic. Traffic Signs (Size, Colour andType) Rules 1959 by Department <strong>of</strong> Works Malaysia prescribe the types,meaning, dimension, colour, placement and height <strong>of</strong> signs under Part I throughto Part VI. Additionally, many studies have concentrated on the responses andimpacts <strong>of</strong> these types <strong>of</strong> signage (Abdur Razzak and Tanweer Hasan, 2010;Baas, 2000; Ng and Chan, 2008). However, in many other private roads whichare not regulated under these Acts, Rules and Regulations, several nonconventionaltypes <strong>of</strong> signages have been provided. There however a lack <strong>of</strong>study is on the impacts and drivers’ responses towards these signages.Accordingly, this research is to assess the effectiveness <strong>of</strong> informationsigns provision in International Islamic University Malaysia (IIUM), Gombakcampus. The findings from this study are very useful in the enhancement on theunderstanding <strong>of</strong> traffic regulations among <strong>of</strong> several important groups; rangingfrom the urban planning studies, road users and the IIUM community.Nevertheless, this research only focuses on the new informatory signs in IIUMGombak campus. The current informatory signs do not subscribe to theinformative signs provision under Part IV <strong>of</strong> the Rules (1995). Therefore, it willbe a useful reference for the campus management in providing better trafficsigns system in the future. The traffic sign has to be considered carefully when‘designing the street’. It is essential that the campus design translates theuniversity’s education philosophy. Thus, the physical forms and configurationsshall be conducive for the aims and objectives <strong>of</strong> the university.© 2012 by MIP
PLANNING MALAYSIAJournal <strong>of</strong> the Malaysia <strong>Institute</strong> <strong>of</strong> <strong>Planners</strong> (2012)Each campus and each individual faculty has its own uniquearchitectural signature aimed at creating distinctive effect within the overallparts <strong>of</strong> the campus design. The principle adopted in IIUM is one <strong>of</strong> a unifiedcampus architecture rather than single-building exhibitionism. The campus is aplace <strong>of</strong> respite where one feels comfortable and relaxed, a place where thelandscape <strong>of</strong> knowledge and the landscape <strong>of</strong> buildings and groundssynergistically meet. The campus design promotes optimum social dynamicsamong staffs and students (IIUM Master Plan, 1995). Some important principles<strong>of</strong> campus planning are the arrangement <strong>of</strong> faculties, central amenities, andphysical environments. Additionally, one <strong>of</strong> the important safety elements <strong>of</strong>physical environment <strong>of</strong> a campus is the provision <strong>of</strong> effective staticinformation signage. Studying the road user perceptions on the traffic signprovided an insight to behavioural responses to this provision. It can alsopromote convenience and safety. Future planning for traffic sign in theuniversity needs also to consider better design <strong>of</strong> the street furniture.S A I IN MA I N SIGNInformatory signs are erected on the road to provide information on direction,destination and roadside, facilities to the road user which may be <strong>of</strong> assistanceto them in making their journey. These cover a wide range <strong>of</strong> sign messages,from one way signs to junction countdown signs. These sign tend to berectangular blue signs with a white edge (Slinn, Matthews and Guest, 2005).Based on Malaysia Guidelines, these signs are rectangular in shape, andthe colours are generally either white letters or symbol and border on bluebackground (Manual <strong>of</strong> Traffic Control Devices JKR, 2006). In a general way,informatory signs give road users the information that will help them along theirway to town, villages or other important destinations in the most simple, directmanner possible to them as well as to inform them <strong>of</strong> interesting routes.83© 2012 by MIP
Syazwani Sahrir, Syahriah Bachok & Mariana Mohd. OsmanThe Effectiveness <strong>of</strong> Provision <strong>of</strong> New Static Information Signage: A Case Study <strong>of</strong> IIUM, Gombak1 (a) 1 (b)Figure 1: Example <strong>of</strong> informatory signInformation sign in International Islamic University Malaysia (IIUM)Information signs in IIUM are provided in English most <strong>of</strong> the time, and onoccasion bilingually. Staff, students, visitors and business community using thecampus’ traffic signs are <strong>of</strong> mixed ethnicity and nationality, representing aninternational perspective <strong>of</strong> traffic signs effectiveness. For this reason <strong>of</strong>distinctiveness, the IIUM Gombak campus has been chosen as a case study. Thecolours <strong>of</strong> the informatory traffic signs are the corporate colour for IIUM. Theheight <strong>of</strong> the informatory traffic signs in IIUM is 2,750mm. The width for thesign was 1,370mm (CBE, IIUM, 2011). The size <strong>of</strong> the traffic sign can beconsidered as appropriate to be seen by the road users.CORPORATE COLOUR IIUMCORPORATE COLOUR IIUMAS FOR THE IIUM LOGO, THE COLOURIS PANTONE 12 C, AND TO BEREPRODUCE USING SPECIAL COLOURPRINT PROCESS UNLESS STATEDOTHERWISE.THE TURQUOISE IS THE CORORATECOLOUR OF IIUM. IT IS THECOMBINATION OF BLUE AND GREEN.THE TURQUOISE COLOR CHOOSEN ISPANTONE 327 C.Source: Centre for Built Environment, IIUM (2011)Figure 2: Colour <strong>of</strong> information sign in IIUM© 2012 by MIP 84
PLANNING MALAYSIAJournal <strong>of</strong> the Malaysia <strong>Institute</strong> <strong>of</strong> <strong>Planners</strong> (2012)Tunnard and Pushkarev (1963) argued that human can easily predictobjects with higher contrast. The colours <strong>of</strong> the informatory traffic signs are thecorporate colour for IIUM. Colours that are used for traffic signs are thecombination <strong>of</strong> turquoise and grey. The turquoise colour chosen was Pantone327 C (Figure 2). By means <strong>of</strong> using the same colour code, the road users caneasily identify and recognize the exact informatory traffic signs and the messagedelivered seemed to be very clear. The large signs should have light colourmarkings on a dark background <strong>of</strong> blue, green or yellow (Hobbs andRichardson, 1967). Small signs should have dark coloured markings on a lightbackground either white or yellow (Hobbs and Richardson, 1967). Grey colouris used in background; hence the wording must use the dark colour such asblack, to provide a contrasting effect in order to create attraction. However, thewording use turquoise colour. To increase detectability, the suitable colour <strong>of</strong>the wording could be black in order to contrast the colour <strong>of</strong> light grey.In general, attentions are directed to simple, regular shapes becausethey can easily draw driver’s attention. For instance, most road users werefamiliar with the standard shape and color <strong>of</strong> the traffic signs. If there arechanges in the design and shape <strong>of</strong> traffic sign, the road users would beconfused and these may lead to an accident. The shape for informatory trafficsigns in IIUM was rectangular. The design should not be complex where thedrivers can get confused (Figure 3).The shape <strong>of</strong>theinformatorysigns iscomplexthan thestandardrectangularshapeSource: Field Survey in IIUM Gombak Campus, 2011Figure 3: Example <strong>of</strong> informatory sign in IIUM85© 2012 by MIP
Syazwani Sahrir, Syahriah Bachok & Mariana Mohd. OsmanThe Effectiveness <strong>of</strong> Provision <strong>of</strong> New Static Information Signage: A Case Study <strong>of</strong> IIUM, GombakEFFECTIVENESS OF TRAFFIC SIGNMatson, Smith, and Hurd (1955) identified that, the effectiveness <strong>of</strong> any signdepends upon its attention, meaning, response time, size, shape, contrast andillumination. Meanwhile, in order for traffic signs to be effective, signs mustattract visual attention, sign lettering and legibility, maintenance, siting <strong>of</strong> signs,night visibility requirements and standards <strong>of</strong> traffic sign (Hobbs, 1979).Visual attentionVisual attention is the characteristics <strong>of</strong> a sign that would make it be noticeablefrom its background as well as surrounding objects (Matson, Smith and Hurd,1955).i. Size: Hobbs (1974) asserted that the larger the traffic sign, within thedriver’s visual cone, the greater its impact on driver’s attention. However,there still a limit to size due to practical considerations <strong>of</strong> siting andlighting as well as aesthetic reasons. Hobbs highlighted that a minimumsign is about 0.3m 2 <strong>of</strong> white board area required for each 30m <strong>of</strong> viewingdistance.ii. Contrast: The human can easily predict on the object with higher contrast(Tunnard and Pushkarev, 1963). Hobbs and Richardson (1967) identifiedthat colour and contrast are the two basic requirements for the sign to standout from the background and the message displayed stand out from thesign board. The large signs should have light colour markings (white) on adark background <strong>of</strong> blue, green or yellow. Basically, two basic colours areused for the ground colour <strong>of</strong> traffic sign, yellow for all warning signs andwhite for all other standard signs (Hobbs and Richardson, 1979).iii. Shape: Irregular cut-out shape must be avoided as the basic shape for thetraffic signs (Hobbs, 1974). The shapes are (1) the octagon for the stopregulations, (2) the square for warning, (3) the rectangle with major axis onthe vertical to convey a regulatory message, (4) the rectangle with majoraxis on the horizontal to inform or guide road users and (5) a variety <strong>of</strong>forms for marking other routes (Matson, Smith and Hurd, 1955).Familiarity with legend, brevity and clarity <strong>of</strong> the message give trafficsigns a sense <strong>of</strong> readability which affects the speed with which meaning iscomprehended (Matson, Smith and Hurd, 1955).© 2012 by MIP 86
PLANNING MALAYSIAJournal <strong>of</strong> the Malaysia <strong>Institute</strong> <strong>of</strong> <strong>Planners</strong> (2012)Sign lettering and legibilityThe sign and style <strong>of</strong> lettering and their spacing influences legibility. Matson,Smith and Hurd (1967) agreed that word messages including numbers andletters should be listed as simple as possible; not more than three or fourfamiliar and practicable words should be conveyed at one glance. There are twobasic forms <strong>of</strong> lettering that are used comprehensively. They are upper-case andlower-case. The upper-case (capital letters) is used as starting letters to thelower-case words. Meanwhile, the lower-case was used to complete themessage. Basically, the height <strong>of</strong> the letter ascenders or descenders equals to theupper-case letters (Hobbs and Richardson, 1979). Indeed, analysis mentioned onthe legibility depends upon size <strong>of</strong> letter, stroke width, letter and word spacing,and size <strong>of</strong> margins (Slinn, Matthews and Guest, 2005).Response timeThere exist three factors that may affect the adequate time for response whichare the speed <strong>of</strong> the road users and his vehicle approach, the legibility distance<strong>of</strong> the sign and its message, and the longitudinal site <strong>of</strong> the sign (Matson, Smithand Hurd, 1955). Time is required by the road users for changing lanes,changing speed as well as to stop the vehicles. The simpler message may onlyneed 1 sec to understand but the multiple choice <strong>of</strong> the message may require 3to 4 sec to be understand (Khan, 2008). This shows that the human hadlimitation to memorize information and visualization. For example, a car wasmoving on a road with 110 km/hr which equals to 30.5 m/sec. Traffic sign wasabout 50m from the car and this minimum distance is required for the driver toget the clear image <strong>of</strong> a traffic sign. The time can be calculated by using theaverage velocity algorithm which is given as:-Distance50Time = Speed= 30.5 = 1.6 secSource: Khan, M. T. (2008). Real-Time Recognition System for Traffic Signs, pg.12 (pp.12)Therefore, factors such as speed <strong>of</strong> vehicles, time reaction, and drivers’visualisation give direct implications towards the size, location and design <strong>of</strong>the traffic signs (Khan, 2008).87© 2012 by MIP
Syazwani Sahrir, Syahriah Bachok & Mariana Mohd. OsmanThe Effectiveness <strong>of</strong> Provision <strong>of</strong> New Static Information Signage: A Case Study <strong>of</strong> IIUM, GombakMaintenanceMaintenance is a straightforward undertaking that requires no formal training orspecial skills. The cleaning and repainting <strong>of</strong> signs is <strong>of</strong> the utmost importancein order to stimulate the concentration <strong>of</strong> the driver and satisfactory <strong>of</strong> thefunctions (Hobbs, 1979).Siting <strong>of</strong> signsOther measure <strong>of</strong> effectiveness is the siting <strong>of</strong> traffic signs. The correct siting <strong>of</strong>the traffic sign from the hazard is also vital in relation to vehicle speeds.Locating a sign too close to a hazard is unlikely to give drivers sufficientwarning and message (Hobbs, 1979).IlluminationThe application <strong>of</strong> lighting or illumination is the deliberation <strong>of</strong> light to achievesome aesthetic or practical effect. Lighting includes use <strong>of</strong> both artificial lightsources such as lamps and natural illumination <strong>of</strong> interiors from daylight(Matson, Smith and Hurd, 1955). Practically all traffic signs use retro reflectivesheeting. Retro reflective sheeting is designed to return light from theheadlamps with just sufficient spread <strong>of</strong> beam to include the driver’s eyes(Matson, Smith and Hurd, 1955).GUIDELINES IMPLEMENTATION FOR TRAFFIC SIGNSThe authority <strong>of</strong> Department <strong>of</strong> Public Works (JKR) (2006), Malaysia has comeout with crelevant guidelines that need to be observed in providing the trafficsigns. The purpose <strong>of</strong> these guidelines is to establish uniformity in design andapplication <strong>of</strong> all traffic signs and control devices in Malaysia for the benefit <strong>of</strong>road users, road and traffic authorities, and manufacturers <strong>of</strong> traffic signs. Thestandardisation is very important in order for the road users to experience andbe familiar with the traffic signs. The uniformity in design encompasses theshape, word messages, symbols, size, colour, illumination or reflectorization(Manual <strong>of</strong> Traffic Control Devices JKR, 2006).© 2012 by MIP 88
PLANNING MALAYSIAJournal <strong>of</strong> the Malaysia <strong>Institute</strong> <strong>of</strong> <strong>Planners</strong> (2012)Guidelines for Informatory signsThe informatory signs are provided for the convenience <strong>of</strong> road users as well asfor improving the efficiency and safety for roadway. There are fourclassifications <strong>of</strong> informatory signs which are (1) destination signs, (2) distanceSigns, (3) information signs and (4) route markers (Manual <strong>of</strong> Traffic ControlDevices JKR, 2006). This study will be focusing more on the informatory sign.i. Colours and Shapes <strong>of</strong> Guide SignsBasically, the informatory signs are rectangular in shape and the colourgenerally either white letters or symbol and border on blue background.However, for local streets, the letterings and arrows should be yellow incolour.ii.iii.Size <strong>of</strong> Guide SignsThe size <strong>of</strong> informatory signs must be legible to road users and followthe standard size. However, for other guide signs, the legend is sovaried that the size must be fixed in terms <strong>of</strong> the length <strong>of</strong> wordmessages and the size <strong>of</strong> lettering and spacing necessary for properlegibility are ensured.Lettering On Guide SignsThe lettering for the informatory sign should be clear, open capitalletters <strong>of</strong> the type approved. The names <strong>of</strong> places and rivers should bein lower-case lettering with initial capitals.CASE STUDY OF STATIC INFORMATION SYSTEMSeveral criteria like conspicuity, legibility, distinctiveness, and comprehensionmust be met for a sign to be effective. There are five cognitive features are <strong>of</strong>central concern in sign research (Ng and Chan, 2008). They are familiarity,concreteness, complexity, meaningfulness, and semantic distance. Ng and Chan(2008) employed a 0 to 100 points scale for rating cognitive features.Familiarity is defined in terms <strong>of</strong> the frequency with which icons had beenencountered. For a group <strong>of</strong> novice subjects, significant and positiverelationships were found amongst the cognitive features <strong>of</strong> familiarity,concreteness, meaningfulness and semantic closeness (Ng and Chan, 2008).Furthermore, the study by Schnell (2010) investigated the effect <strong>of</strong>luminance and letter size on the information acquisition time and transfer89© 2012 by MIP
Syazwani Sahrir, Syahriah Bachok & Mariana Mohd. OsmanThe Effectiveness <strong>of</strong> Provision <strong>of</strong> New Static Information Signage: A Case Study <strong>of</strong> IIUM, Gombakaccuracy from simulated traffic signs. Luminance on the sign legend wasadministered at fives levels; 3.2 cd/m2, 10 cd/m2, 20 cd/m2, 40 cd/m2 and 80cd/m2, on positive-contrast textual traffic sign stimuli with contrast ratios <strong>of</strong> 6:1and 10:1. The simulated signs were positioned at 33 foot/inch and 40 foot/inchlegibility indices viewed under conditions simulating a night time drivingenvironment. The findings suggested that increasing the sign luminancesignificantly reduced the time to acquire information. Similarly, increasing thesign size also reduced the information acquisition time (Schnell, 2010).Furthermore, as the text size decreased, the reading times showed a much moredramatic increase at lower luminance levels (Schnell, 2010). These findingssuggest that larger and brighter signs are more efficient in transferring theirmessage to the driver by reducing information acquisition time, or alternatively,by increasing the transfer accuracy. In return, reduced sign viewing durationsand increased reading accuracy is likely to improve roadway safety.METHODOLOGYThe primary data obtain were research derived from site observations andquestionnaire surveys. The site observations were to identify the existingphysical conditions <strong>of</strong> the informatory traffic signs in IIUM Gombak campus.Personal interviews can generate a very high response rate. The questionnairesurvey was to gather the information <strong>of</strong> the respondents’ perception andapproach towards the effectiveness <strong>of</strong> the informatory traffic signs in IIUM. Therespondents were selected from Zone I: Ahmad Ibrahim Kulliyyah <strong>of</strong> Law(AIKOL) and Zone 2: Kulliyyah <strong>of</strong> Architecture and Environmental Design(KAED) areas in IIUM.This research tends to focus <strong>of</strong> respondents form different faculties inorder to identify the differences <strong>of</strong> perceptions <strong>of</strong> the students as they were formdifferent background <strong>of</strong> study and characteristics. The selection was based onAIKOL students being knowledgeable and familiar with laws and regulations asthey were studying in law. Meanwhile, the selections <strong>of</strong> KAED students werebecause they were knowledgeable and familiar with urban design setting andtraffic and transportation matters as they were studying built environment anddesign. However, the analysis and findings may not be applicable to otheruniversities due to IIUM signages being different from other universities. Thepopulation was divided into homogenous groups (based on faculties). Due to thelarge number <strong>of</strong> population, the purposive sampling has been used.© 2012 by MIP 90
PLANNING MALAYSIAJournal <strong>of</strong> the Malaysia <strong>Institute</strong> <strong>of</strong> <strong>Planners</strong> (2012)The questionnaire survey was divided into four sections. The firstsection was the revealed preference where the respondent provided theirperception on the effectiveness <strong>of</strong> the traffic sign. These variables were thedependent variables. Meanwhile, the second section was on the tripcharacteristics. The third section dealt with the driving characteristics <strong>of</strong> therespondents. Trip and driving characteristics were independent variables. Thelast section was on the basic questions pertaining the respondent’s backgrounds.Variables such as gender, age and faculties have been asked. These variableswere the independent variables. Likert Scale was used for the relevantperception questions.DATA ANALYSIS AND FINDINGSEffectiveness <strong>of</strong> New Static Information Signage in IIUMThe questionnaire has been distributed to 130 respondents. 128 have beenanalysed after the data cleaning. The Relative Importance Index (RII) methodwas adopted by many researchers (Kometa, et al., 1994). This method wasadopted to analyse the data collected from the questionnaire survey. Therespondent’s perception towards the traffic sign has been scaled by; 1=veryunsatisfied, 2=unsatisfied, 3=satisfied and 4= very satisfied. The four-pointscale 0–3 mentioned earlier was transformed into relative importance indices foreach satisfaction <strong>of</strong> related question on font size, board size, illumination,colour <strong>of</strong> sign, language and siting <strong>of</strong> sign. The indices were then used todetermine the rank <strong>of</strong> each item. These rankings made it possible to crosscompare the relative importance <strong>of</strong> user’s satisfaction and the measure <strong>of</strong> trafficsign effectiveness. The RII was used to determine the variables most effectivefor informatory traffic sign in IIUM.Table 1: Relative Importance Index (R.I.I)Measure <strong>of</strong>EffectivenessVery Satisfied(Score <strong>of</strong> 3)Satisfied(Score <strong>of</strong> 2)Unsatisfied(Score <strong>of</strong> 1) R.I.I RankLanguage <strong>of</strong> sign 52 156 74 148 2 2 0.79 1Board Size 30 90 86 172 12 12 0.71 2Font Size 26 78 75 150 27 27 0.66 3Colour <strong>of</strong> sign 28 84 58 116 42 42 0.63 4Siting <strong>of</strong> sign 18 54 78 156 32 32 0.63 5Luminance 24 72 52 104 52 52 0.59 6Based on the findings, language <strong>of</strong> sign most effective, with a R.I.Iscores 0.79 highlight in the Table 1. IIUM was known as internationaluniversity, which was why English language was used as the main language.91© 2012 by MIP
Syazwani Sahrir, Syahriah Bachok & Mariana Mohd. OsmanThe Effectiveness <strong>of</strong> Provision <strong>of</strong> New Static Information Signage: A Case Study <strong>of</strong> IIUM, GombakThus, it shows that the respondents were really satisfied with the use <strong>of</strong> Englishlanguage on sign. The luminance has the lowest score as during the observationthat has been done by the researcher, only certain time the lighting would beturned on.Chi-Square testThe chi-square test analysis can be carried out with two different variableswhich are nominal and ordinal variables. In order to reject the null hypothesis,the p value (significant level) should be
PLANNING MALAYSIAJournal <strong>of</strong> the Malaysia <strong>Institute</strong> <strong>of</strong> <strong>Planners</strong> (2012)Dorcus (1926) found that yellow had a higher affective value for the men thanwomen.Kendall Tau-b Correlation analysisKendall's tau is a measure <strong>of</strong> correlation, i.e. the strength <strong>of</strong> the relationshipbetween two variables. Kendall’s coefficient ranges from 0 to 1. Larger valuesindicate a stronger association among appraisers’ ratings. In order to reject thenull hypothesis, the p value (significant level) should be
Syazwani Sahrir, Syahriah Bachok & Mariana Mohd. OsmanThe Effectiveness <strong>of</strong> Provision <strong>of</strong> New Static Information Signage: A Case Study <strong>of</strong> IIUM, Gombaktraffic signs. However, insignificant relationship may be due to the smallnumber <strong>of</strong> sample size.SYNTHESIS OF THE RESEARCHThe research was aimed at determining the effectiveness <strong>of</strong> the informatorytraffic signs in IIUM, which was guided by four objectives. Basically, theeffectiveness <strong>of</strong> the traffic sign depends upon visual attention, sign lettering andlegibility, response time, maintenance, siting <strong>of</strong> signs as well as illumination.Analyses show that:i. It has been found that gender was the factor that influenced theperceptions <strong>of</strong> the respondents towards the effectiveness <strong>of</strong> the colourand illumination <strong>of</strong> traffic signs. Dorcus (1926) found yellow had ahigher affective value for the men than women.ii. It can be concluded that the frequency <strong>of</strong> signage observationinfluenced the perceptions <strong>of</strong> respondents toward the font size <strong>of</strong> thetraffic signs.iii. Familiarity with legend, brevity and clarity <strong>of</strong> the message give trafficsigns a sense <strong>of</strong> readability which affects the speed with whichmeaning is comprehended (Matson, Smith and Hurd, 1955).Thus, it can be concluded that, the effectiveness <strong>of</strong> the traffic signsdepends upon the gender as well as the familiarity with the signs.RECOMMENDATIONSVisual AttentionOne <strong>of</strong> the measures <strong>of</strong> effectiveness <strong>of</strong> traffic sign was visual attention.Comprehension must also take place in sufficient time so that the driver can actupon the sign message without distraction from the surrounding situation. Thatwas why the standardisation <strong>of</strong> traffic sign should be taken into consideration bythe agency involved. However, visibility <strong>of</strong>ten been impede by hedges, trees,curvature and others. The human ability in visualization was limited. It will beapparent on values such as on contrast and board size as highlighted below:© 2012 by MIP 94
PLANNING MALAYSIAJournal <strong>of</strong> the Malaysia <strong>Institute</strong> <strong>of</strong> <strong>Planners</strong> (2012)i. Contrast: Hobbs and Richardson (1967), in their analysis <strong>of</strong> the trafficsigns identified that colour and contrast were the two basicrequirements for the sign stands out from the background and themessage displayed stand out from the sign board. Contrast depended onthe brightness <strong>of</strong> the colour. Contrast can be effective by the use <strong>of</strong>different colour and brightness. The existing background for theinformatory traffic signs in IIUM was grey in colour, and the letteringare turquoise. For instance, lettering that used black colour and lightgrey colour for its sign’s background is more legible compared towording in turquoise colour (Figure 4 and 5).Figure 4: Existing conditionFigure 5: Example <strong>of</strong> recommendationIn this context, the differences between letter and itsbackground will enlighten the image due to the contrast <strong>of</strong> thebackground colour against dark lettering coloured <strong>of</strong> the sign. Eventhough the location <strong>of</strong> the signage is strategic, reasonable size andcolour contrast are important for the sign to be effective.Background- grey in colourLettering- turquoiseTable 4: Recommendations <strong>of</strong> colourBeforeAfterBackground- light grey in colourLettering- blackii.Maintenance: In order to achieve the necessary effectiveness, it isimperative that the traffic signs provided at any site are adequate in sizefor the speed <strong>of</strong> the road it is erected on. The correct siting <strong>of</strong> the traffic95© 2012 by MIP
Syazwani Sahrir, Syahriah Bachok & Mariana Mohd. OsmanThe Effectiveness <strong>of</strong> Provision <strong>of</strong> New Static Information Signage: A Case Study <strong>of</strong> IIUM, Gombaksign from the hazard is also vital in relation to vehicle speeds. Locatinga sign too close to a hazard is unlikely to give drivers sufficientmessage.There were some traffic signs that were hidden by the trees. Itis essential to reiterate that, the humans had their limitation invisualization. Basically, traffic sign were placed adjacent to thejunctions. However, the placements <strong>of</strong> some <strong>of</strong> the traffic sign werehidden by the trees and shrubbery and this interrupted the drivers’ view<strong>of</strong> the signs. The siting <strong>of</strong> traffic signs are recommended to be located atthe right siting and follow the guidelines. The responsible agenciesshould maintain the vegetation growth (trees and shrubbery) so thatthey will not interrupt the drivers’ attention. Trees and shrubbery needto be cut as the vegetations grow and obscure the line-<strong>of</strong>-sight to thesigns.CONCLUSIONSTraffic signs are important in promoting road safety towards the road users.However, the effectiveness <strong>of</strong> the traffic sign must take into consideration.Several aspects including colours, contrast, legibility, maintenance, siting <strong>of</strong>signs, night visibility requirements and standards <strong>of</strong> traffic sign needsimprovement measures through a systematic planning and implementation <strong>of</strong>proper guidelines must be imposed to create good image as well as enhancingthe visual quality <strong>of</strong> traffic sign. Erection <strong>of</strong> traffic signs at inappropriatelocations has produced some problems and issues, which need to be mitigated inthe future. For instance in the case <strong>of</strong> IIUM, the resulted in applications <strong>of</strong>visual attention elements still need to be enhanced and increased for betterlegibility <strong>of</strong> traffic sign. Consideration has to be made in colour, gender <strong>of</strong> theusers, familiarity with multilingual signage and legibility. This research hasproven that these factors influenced the effectiveness <strong>of</strong> signage andrecommended the respective <strong>of</strong> strategies.© 2012 by MIP 96
PLANNING MALAYSIAJournal <strong>of</strong> the Malaysia <strong>Institute</strong> <strong>of</strong> <strong>Planners</strong> (2012)REFERENCESAbdurRazzak and TanweerHasan. (2010). Motorist understanding <strong>of</strong> trafficsigns: A study in Dhaka city. Journal <strong>of</strong> Civil Engineering (IEB),38 (1),17-29.Baas P. Influencing driver behaviour through road marking. University <strong>of</strong>Waikato and TERNZ Ltd.Babbie, E. R. (2002). Fundamentals <strong>of</strong> Social Research.Nelson Education.Bell, M. G. H., Bonsall, P. W., and O’Falherty, C. A. (1997).Driver Informationsystem.In O’Falherty, C. A. (Ed.).Transport Planning and TrafficEngineering (pp. 517-531). Butterworth Heinemann: London.Castro C. and Horberry T. (2004).The Human Factors <strong>of</strong> Transport Signs.CRCPress: United States <strong>of</strong> America.Centre for Built Environment (CBE) .(2011). IIUM.Conover W.J. (1980) Practical Non-Parametric Statistics, 2nd edn. John Wileyand Sons :New York.Cunard, R. A. (1999). Traffic control devices: Signs. In <strong>Institute</strong> <strong>of</strong>Transportation Engineers (Ed.).The traffic safety toolbox: A primer ontraffic safety (pp. 47-56). <strong>Institute</strong> <strong>of</strong> Transportation Engineers (ITE):United States <strong>of</strong> America.D.W. Harwood,et al., (2002) Safety Effectiveness <strong>of</strong> Intersection Left- andRight-Turn Lanes, Federal Highway Administration Office <strong>of</strong> SafetyResearch and Development.David V. And Moldoveanu Ș.(2002). Sample preparation inchromatography.Journal <strong>of</strong> chromatography library.Elsevier :Netherlands.Dewar R. (1998). Design and evaluation <strong>of</strong> public information symbols. InZwaga H, Boersema T. and Hoonhout H. (Ed.) Visual information foreveryday use: design and research perspectives (pp. 285-304). Taylor& Francis: United Kingdom.Dorcus R. M. (1926). Color preferences and color association. John HopkinsUniversity.Hobbs, F. D. and Richardson B. D. (1967).Traffic Engineering (Vol.2).Pergamon Press: Britain.Hobbs, F.D. (1979), Traffic Planning and Engineering(2 nd ed.).Pergamon Press:Britain.IIUM Master Plan.(1995). IIUM Publication.Jackson S. L. (2003). Research Methods and Statistics: A Critical ThinkingApproach. Thomson Wadsworth: United States <strong>of</strong> America.Keeble, L. (1969). Principlesand Practice <strong>of</strong> Town and CountryPlanning.Timber City Books.97© 2012 by MIP
Syazwani Sahrir, Syahriah Bachok & Mariana Mohd. OsmanThe Effectiveness <strong>of</strong> Provision <strong>of</strong> New Static Information Signage: A Case Study <strong>of</strong> IIUM, GombakKendrick, P., Copson, M., Beresford, S., and McCormick, P. (2004).Roadwork:Theory and practice (5th ed.). Elsevier Butterworth- Heinemann:Britain.Khan, M. T. (2008). Real-Time Recognition System for Traffic Signs.Department <strong>of</strong> Computer Engineering, Dalarna UniversityKometa, S.T.; Olomolaiye, P.O. and Harris, F.C. (1994) Attributes <strong>of</strong> UKconstruction clients influencing project consultants’ performance,Construction Management and Economics, 12(2), pp. 433-443.Kurniawan Sri H. and Zaphiris P. Investigating the Age Effects on SubjectiveAssessments <strong>of</strong> Traffic Signs.Dept. <strong>of</strong> Industrial and ManufacturingEngineering and <strong>Institute</strong> <strong>of</strong> Gerontology Wayne State University.Manual <strong>of</strong> Traffic Control Devices(2006). Department <strong>of</strong> Public Works:Malaysia.Manual on Uniform Traffic Control Devices (MUTCD) (2003). Department <strong>of</strong>Transport: United State <strong>of</strong> America.Matson T. M., Smith, W. S., and Hurd, F. W. (1955).Traffic Engineering.McGraw-Hill Book Company: New York.Newman, W. L. (2006). Social Research Methods: Qualitative and QuantitativeAproaches. Pearson Education Inc.:United States <strong>of</strong> America.Ng W.Y A. and Chan H.S. A. (2008) Visual and Cognitive Features on IconEffectiveness.Proceedings from ‘International Multi Conference <strong>of</strong>Engineers and Computer Scientists’Vol II IMECS 2008: Hong Kong.Rencher Alvin C. (2002). Methods <strong>of</strong> multivariate analysis (2 nd ed.). John Wileyand Sons: United States <strong>of</strong> America.Roess, R. P., Prassas, E. S., and McShane, W. R. (2004).Traffic Engineering(3rd ed.). Pearson Prentice Hall: United States <strong>of</strong> America.Schlabbach K. "Traffic Calming in Europe".<strong>Institute</strong> <strong>of</strong> TransportationEngineers.Schnell T., Yekhshatyan L., Daiker R. and Konz J. (2010) Effect <strong>of</strong> Luminanceon Information Acquisition Time and Accuracy from Traffic Signs.Unpublished Thesis: University <strong>of</strong> Iowa.Slinn M, Matthews P. and Guest P. (2005). Traffic Engineering Design:Principles and Practice(2 nd ed.).Oxford: AmsterdamTraffic Signs Manual (2003). Department <strong>of</strong> Transport :United Kingdom.Tunnard C. and PushkarevB. Man-made America: chaos or control?: Aninquiry into selected problems <strong>of</strong> design in the urbanized landscape.Yale University Press: United States <strong>of</strong> America.Wohl, M. and Martin, B. (1967).Traffic systems analysis for engineers andplanners.McGraw-hill Book Company: United States <strong>of</strong> America.© 2012 by MIP 98
PLANNING MALAYSIAM y I PNS I N AN M LI I N AS S IN LANGALL Y MALAYSIAM A M I I1 2yyMyyAIN I N© 2012 by MIP
Muhammad Abu Eusuf, Mansor Ibrahim & Rafikul IslamThe Construction and Demolition Wastes in Klang Valley, Malaysiawith ever increasing population growth have led to an increase in solid wastesin most developing countries. The wastes generated from various humanactivities, both industrial and domestic, can result in health hazards and have anegative impact on the environment. In Peninsular Malaysia, the amount <strong>of</strong>solid waste generated per day increased from an estimated 23, 000 tonnes in2010 to 25, 000 tonnes in 2012, averaging about 0.9 kilograms per person perday. Solid waste in Malaysia on average consists <strong>of</strong> 45.0 per cent food waste,24.0 per cent plastic, 7.0 per cent paper, 6.0 per cent iron, and 3.0 per cent glassand others (Ahmed, 2010).Waste management is defined as the discipline associated with thecontrol <strong>of</strong> generation, recovering, processing and disposal <strong>of</strong> wastes in a mannerthat is in concordance with the best principles <strong>of</strong> human health, economic,engineering, aesthetics, and other environmental considerations(Tchobanoglous, 1993/ 2003). It is an important part <strong>of</strong> the urban infrastructure,as it ensures and provides protection <strong>of</strong> the environment and human health. Inorder to ensure proper management <strong>of</strong> waste, it is vital that the types <strong>of</strong> wasteare identified. Different wastes need different handling treatment and disposal.According to Wolley (2000), reducing, reusing and recycling appear to bepr<strong>of</strong>itable alternatives that will increase the lifetime <strong>of</strong> landfills and reduceexploration <strong>of</strong> natural resources. In addition to that, some European countries’waste management practices are based on prevention (minimization), recoveryand restriction (reusing and recycling). Though construction is one <strong>of</strong> the vitalissues for national economic growth, however, the activities pertaining toconstruction pose various kinds <strong>of</strong> hazards to the environment and public health(CIDB, 2009). Proper management <strong>of</strong> construction and demolition (C&D)wastes is a burning issue (European Commission, 2000). There is an urgentneed to look for improvements to the present C&D waste management practicesso as to ensure good public health in an atmosphere that is environmentfriendly. All pr<strong>of</strong>essionals have important roles in better management <strong>of</strong> C&Dwaste materials. The present research is conducted with reference to <strong>Malaysian</strong>perspectives through a case study on Klang Valley in peninsular Malaysia. Themain objectives <strong>of</strong> the present research are as follows:i) To identify the common types <strong>of</strong> waste materials generated at theconstruction sites and find out the common causes <strong>of</strong> generation;ii) To identify the most common methods applied in managing C&Dwastes at construction sites;iii) To recommend the ways through which the present C&D managementpractices can be improved in Malaysia.© 2012 by MIP
PLANNING MALAYSIAJournal <strong>of</strong> the Malaysia <strong>Institute</strong> <strong>of</strong> <strong>Planners</strong> (2012)BACKGROUND OF KLANG VALLEYKlang valley which is generally considered as a showcase <strong>of</strong> Malaysia consists<strong>of</strong> an area comprising Kuala Lumpur and its suburbs attached with adjoiningcities and towns in the state <strong>of</strong> Selangor. Geographically, it is delineated by theTitiwangsa Mountains to the north and east and the Strait <strong>of</strong> Malacca to thewest. The conurbation <strong>of</strong> Klang Valley is known as the heartland <strong>of</strong> Malaysia'sindustry and commerce and has a total population <strong>of</strong> about 6.6 million as <strong>of</strong>2010 (Wikipedia, 2011) with 1.7% average growth rate. Klang valley iscomprised <strong>of</strong> the following district areas: Federal Territory <strong>of</strong> Kuala Lumpur;Federal Territory <strong>of</strong> Putrajaya; Selangor District <strong>of</strong> Petaling, Klang, Gombak,Hulu Langat, Sepang, Kuala Langat, Kuala Selangor, Sebak Bernam and HuluSelangor. Principal cities/ towns in the Klang Valley are shown in Figure 1.Source Wiki edia (2011)Fi ure 1: Princi al cities towns in Klan Valley and the borders <strong>of</strong> state <strong>of</strong> Selan or and Kuala Lum ur101© 2012 by MIP
Muhammad Abu Eusuf, Mansor Ibrahim & Rafikul IslamThe Construction and Demolition Wastes in Klang Valley, MalaysiaAN OVERVIEW OF MALAYSIAN POLICIES AND LEGISLATIONS INSOLID WASTE MANAGEMENTThe construction industry in Malaysia has experienced a wide range <strong>of</strong>expansions during the past 20 years. Today, most <strong>of</strong> the construction projectsundertaken are complex in nature, demand greater skills and superiortechnologies, fast track and concurrent work practices, and are very competitivein terms <strong>of</strong> price. In order to promote environmentally sound and sustainabledevelopment, combined with the aims <strong>of</strong> continued robust economy, the<strong>Malaysian</strong> government has established a legal and institutional framework forenvironmental protection regarding solid wastes. If the construction solid wasteis not properly managed then it will affect the neighbourhood and consequently,it will have negative impact on all kinds <strong>of</strong> planning activities. TheEnvironmental Quality Act (EQA) was enacted in 1974 for the prevention,abatement and control <strong>of</strong> environmental pollution and to enhance the generalquality <strong>of</strong> the environment. The amendments were deemed necessary toincorporate new developments and issues in the control <strong>of</strong> the environment.The Local Government Act was adopted in 1976. This Act has provideda better institutional and legal framework for local authorities to carry out theirduties. The Act prohibits the deposition <strong>of</strong> waste in any stream, channel, drainand river. The Act also provides power to local authorities to maintaincleanliness in towns and put up sanitary measures for the removal <strong>of</strong> waste intheir respective operational area. Further, Malaysia has developed acomprehensive set <strong>of</strong> legal provisions related to the management <strong>of</strong>waste. The regulation is based on the “cradle to the grave” principle. Afacility which generates, stores, transports, treats or disposes scheduledwaste is subject to the following regulations: Environmental Quality (Prescribed Premises) (Schedule WasteTreatment and Disposal Facilities) Order 1989; Environmental Quality (Prescribed Premises) (Schedule WasteTreatment and Disposal Facilities) Regulations 1989; Environmental Quality (Prescribed Conveyance) Order 2005; Environmental Quality (Scheduled Waste) Regulations 2005.Overall, the government’s policy is to ensure:the clean, safe, healthy and productive environment for present andfuture generations;© 2012 by MIP 102
PLANNING MALAYSIAJournal <strong>of</strong> the Malaysia <strong>Institute</strong> <strong>of</strong> <strong>Planners</strong> (2012)the conservation <strong>of</strong> the country's unique, diverse cultural and naturalheritage with effective participation by all sectors <strong>of</strong> the society; anda sustainable lifestyle and pattern <strong>of</strong> consumption and production.A BRIEF LITERATURE REVIEW ON C&D WASTEIncreased Generation <strong>of</strong> C&D WasteThe materials generated from C & D waste activities are quite different, thereason is related with construction activities make use <strong>of</strong> presently availableindustrialized processes and materials while demolition activities <strong>of</strong>ten removeexisting unusable or abandoned structures form the proposed construction site,and consequence <strong>of</strong> different waste stream (Colin Jeffrey, 2011). Fishbein(1998) stated that construction waste is one <strong>of</strong> the main contributors to seriousenvironmental problems in many developing countries. According to statisticaldata, Construction and Demolition debris (C&D) recurrently makes up to 10-30% <strong>of</strong> the wastes received at any landfill sites all over the world. For example, inHong Kong an average <strong>of</strong> 7030 tonnes <strong>of</strong> C&D waste were disposed <strong>of</strong> atlandfills every day in 1998, representing about 42% <strong>of</strong> the total wastes(Environment Protection Department, 1999/ 2000). Approximately, 136 milliontonnes <strong>of</strong> C&D wastes were generated in the United States in 1996 (refer toTable 1), <strong>of</strong> which 53% accounts from residential areas (Franklin Associates,1998).Table 1: Summary <strong>of</strong> C&D Debris Generation in USA in 1996.Sources Residential Non- residential TotalTonnes % Tonnes % Tonnes %Construction 6, 560 11 4,270 06 10,830 08Renovation 31,900 55 28,000 36 59,900 44Demolition 19,700 34 45,100 58 64,800 48Totals (%) ,1 0 ( 3) 100 ,3 0 ( ) 100 13 , 30 (100) 100Sources: ranklin Associates, EPA 30 R 010, 1Figure 2 shows the classifications <strong>of</strong> solid wastes generators inPeninsular Malaysia: 1) Households, commerce, institutions (33%); 2)Industrial (25%); 3) Construction sector (41%); 4) Public places (1%); and 5)Special waste (9%). We observed that the construction industry has contributedthe highest percentage (41%) due to rapid development followed by households,commerce and institutions (33%) and 25% generated from Industrial process.103© 2012 by MIP
Muhammad Abu Eusuf, Mansor Ibrahim & Rafikul IslamThe Construction and Demolition Wastes in Klang Valley, MalaysiaSource: MHLG/ DanidaFigure 2: Solid Waste Generation in Peninsular Malaysia year 2007Form above description it obvious that due to increase the C&D wastequantity, dearth <strong>of</strong> enough landfills and then long-term unpleasantenvironmental, economic and social impacts <strong>of</strong> the disposal <strong>of</strong> C&D waste,where effective C&D waste management is indispensable to protectneighbourhood environment (Muluken et. al, 2012).Types and Components <strong>of</strong> C&D WastesGenerally, wastes are divided into a number <strong>of</strong> different categories according totheir physical, chemical and biological properties. Another classification ismade by their composition. Solid wastes are waste materials that contain lessthan 70% <strong>of</strong> water which includes materials such as household garbage, someindustrial wastes, some mining wastes, and oilfield wastes, e.g., drill cuttings(Chen and Li, 2006). Hurley (2003) affirmed that the main solid wastes presentin the construction are gravel, concrete, asphalt, bricks, tiles, plaster, masonry,wood, metal, paper and plastics. Franklin Associates (1998) explained thatconstruction debris from building sites typically consists <strong>of</strong> trim scraps <strong>of</strong>construction materials, such as wood, sheetrock, masonry, and ro<strong>of</strong>ingmaterials.Concrete: Concrete is a material that consists <strong>of</strong> cement, aggregate, water and anumber <strong>of</strong> other chemical admixtures. Generally, concrete is the mostcommonly used component for both substructure and superstructure <strong>of</strong>buildings and other infrastructures. Poon (2004) found that the material wastagein construction is mainly due to the disparity between the quantity <strong>of</strong> concreteordered and that required, mostly in the case <strong>of</strong> ready mix concrete supply. It isalso due to poor planning by the contractors on the amount <strong>of</strong> concrete required© 2012 by MIP 104
PLANNING MALAYSIAJournal <strong>of</strong> the Malaysia <strong>Institute</strong> <strong>of</strong> <strong>Planners</strong> (2012)for the construction. Further, project delays and inefficient material handlingprocesses also create wastes on site.Reinforcement: Reinforcement bars are regarded as an essential component <strong>of</strong>reinforced concrete and reinforced masonry structures in construction. Itprovides better frictional strength to the concrete. The main causes <strong>of</strong> itswastage are careless cutting by the labourers and inaccuracy in estimateddimension. Poon (2004) confirmed that damages during storage and rusting alsocontribute to the volume <strong>of</strong> wastes.Wood: According to the California Integrated Waste Management Board(2008), the primary constituents <strong>of</strong> wood waste are used lumber, trim, shippingpallets, and other kinds <strong>of</strong> wood debris from construction and demolitionactivities. Wood waste is, by far, the largest portion <strong>of</strong> the waste streamgenerated from construction and demolition activities. The main cause <strong>of</strong> woodwastes is natural deterioration (Poon, 2004), especially in the demolitionactivities.Bricks and blocks: Bricks and blocks are mostly used to form the internalwalls, fixtures and partitions <strong>of</strong> a building. Study conducted by Poon (2004)shows that the generation <strong>of</strong> bricks or blocks during construction process beginsfrom the transportation to the site until its point <strong>of</strong> use.Various Causes <strong>of</strong> C&D WastesThere are two kinds <strong>of</strong> C&D wastes – direct and indirect. Direct waste isdefined as a loss <strong>of</strong> value <strong>of</strong> those materials due to damage and normally thesecannot be repaired/ used again (Mahanim et al., 2007). Some <strong>of</strong> the causes <strong>of</strong>direct wastes are: Transportation, delivery and internal site movements(Formoso et al., 1999); poor storage <strong>of</strong> materials (Skoyles, 1987); Problem infabrication (Mahanim et al., 2007); poor attitudes <strong>of</strong> construction workers(Udayangani et al., 2006); design change/variation (Graham and Smither,1996). On the other hand, indirect wastes occur principally from replacement <strong>of</strong>materials.INTEGRATED C&D WASTE MANAGEMENTC&D Waste Management is a part <strong>of</strong> a growing movement towards developinga sustainable world. Sustainable or “green” management techniques aredesigned to protect the environment, save resources, and conserve energy.105© 2012 by MIP
Muhammad Abu Eusuf, Mansor Ibrahim & Rafikul IslamThe Construction and Demolition Wastes in Klang Valley, MalaysiaProper use <strong>of</strong> construction waste management techniques has proven to haveeconomic benefits for the construction industry (Simpson, 2006). No matterwhat the scale or complexity <strong>of</strong> the project be, from large new building <strong>of</strong>ficesto manufacturing facilities, waste management best practice strategies saveconstruction costs and dramatically reduce the impact on the environment.Integrated Waste Management (IWM) is defined as the selection andapplication <strong>of</strong> suitable techniques, technologies and management programs toachieve specific waste management objectives and goals (Tchobanoglous,2003). At the same time, the process takes into consideration <strong>of</strong> technical,legislative, economic, socio-cultural, institutional and environmental aspects <strong>of</strong>waste management. The authors <strong>of</strong> this study have identified four basicmanagement options for IWM: 1) source reduction; 2) recycling andcomposting; 3) combustion; and 4) landfills.The waste management process consists <strong>of</strong> material reduction in thedesign and planning stages, reducing scrap and waste at building site, reusingmaterials on site, and recycling materials which cannot be reused. All theprocesses involved are to be carried out within existing legal, social andenvironmental guidelines that protect the public health and the environment andare economically acceptable. For a successful integrated C&D wastemanagement plan, it is essential that all the disciplines including administrative,legal, construction pr<strong>of</strong>essional and workers, etc. communicate and interact witheach other and maintain a positive interdisciplinary relationship.Reduction <strong>of</strong> C&D WastesChadravanthani (2006) asserts that in Malaysia, wastes are being generated atan alarming rate. Despite the widespread acceptance <strong>of</strong> recycling as a formalwaste management method, however, in <strong>Malaysian</strong> national domestic recyclingrate still stay close around a mere five per cent. According to Kibert andLanguell (2000), the first priority <strong>of</strong> C&D waste management should go toreducing the amount <strong>of</strong> waste generated. Next priorities should go to reusing,recycling, composting, burning and land filling.Pichtel (2005) maintains that waste minimization must be given highpriority in order to limit any unfavourable environmental impacts, to hold downdisposal costs as well as minimizing future liability. He also asserts thatreducing C&D waste requires commitment and attention from all partiesinvolved.© 2012 by MIP 106
PLANNING MALAYSIAJournal <strong>of</strong> the Malaysia <strong>Institute</strong> <strong>of</strong> <strong>Planners</strong> (2012)Reuse <strong>of</strong> C&D WastesMany materials extracted from demolition or deconstruction can be reused orstored for future potential use (Mahanim et al., 2007). Tchobanoglous and Keith(2002) underlined that, in any construction or demolition project, a broadvariety <strong>of</strong> reusable and unused items should be found which include lumber <strong>of</strong>different sizes, plywood, asphalt shingles, insulation, heating ducts, etc.Furthermore, wastes such as broken concrete, blocks and bricks can be used in anumber <strong>of</strong> applications.In addition to the above, functional building or architecturalcomponents can <strong>of</strong>ten be reused for the next construction job. According to Punet al. (2006), demolition waste reuse and recycling play important roles in valuetransformation for building material lifecycle, local economics, sustainableenvironment and natural resource conservation.Recycling <strong>of</strong> C&D WastesRecycling is the process <strong>of</strong> collection, separation, clean-up and processing <strong>of</strong>waste materials to produce a marketable material or product and thereforecontributes to the economy, both in providing jobs and business opportunities(William, 1998; Sherman, 1996). In 1996, it was estimated that an average <strong>of</strong> 20to 30 per cent <strong>of</strong> the C&D debris generated were recycled (Southeast RegionalEnvironmental Finance Center, 1996).The waste materials to be recycled are determined on the basis <strong>of</strong> anumber <strong>of</strong> factors that include their market value, their access to potentialmarkets, and the quantities in which they are available (Dolan et al., 1999).Tchobanoglous and Keith (2002) have shown that the principal materials thatare now recovered from C&D waste for recycling include concrete, wood,asphalt shingles, drywall, metal and soil.Composting <strong>of</strong> C&D WastesThe present researchers assert that composting, which is an element <strong>of</strong> anintegrated solid waste management strategy, can be applied to mix up municipalsolid waste as well as it can contribute to the reduction <strong>of</strong> the amount <strong>of</strong> wasteproduced. Accordingly, construction and demolition debris, tree limbs, andother fibrous organic materials may be grounded to produce wood chips,mulches, and feedstock for composting. If the site layout provides an area tostore the compost, it may be kept and used for landscaping. The compost may107© 2012 by MIP
Muhammad Abu Eusuf, Mansor Ibrahim & Rafikul IslamThe Construction and Demolition Wastes in Klang Valley, Malaysiabe marketed to landscaping firms for commercial use. Compost can be used as asoil treatment, artificial topsoil, or growing medium amendment.Combustion and Land-filling <strong>of</strong> C&D WastesIt is also emphasized that burning should be one <strong>of</strong> the last alternatives for C&Dwaste with the permission from necessary authorities. Caution must be takenwhen burning takes place in order to prevent and avoid adverse health effects aswell as uncontrolled burns. A landfill, also known as a dump, is a site for thedisposal <strong>of</strong> waste materials by burial and is the oldest form <strong>of</strong> waste treatment.Historically, landfills have been the most common methods <strong>of</strong> organized wastedisposal and remain so until the modern era in many places around the world.RESEARCH METHODTo fulfil the objectives <strong>of</strong> the present research, a survey method was adopted.The prospective respondents are decided to be mainly contractors, engineersand quantity surveys. The present survey is self-administered and the samplesize is 32. After collecting all the responses from the respondents, SPSS version19.0 has been used to analyse the data. In particular descriptive statistics,analysis <strong>of</strong> variance (ANOVA), multi-variate analysis <strong>of</strong> variance (MANOVA)components have been used. To conduct the present research, a questionnairecovering all the salient aspects <strong>of</strong> C&D wastes was formed that consisted <strong>of</strong> thefollowing sections:Section A - Background <strong>of</strong> the Respondents: The respondents were asked toprovide information on position/pr<strong>of</strong>ession, gender, age, and workingexperience.Section B - Generation <strong>of</strong> C&D Waste: In the first two questions, therespondents were asked to articulate whether they are aware about constructionand demolition wastes and their level <strong>of</strong> agreement on the statement“Construction industry now-a-days generates the C&D waste which createssubstantial impacts on the environment and human health”. Further, on a set <strong>of</strong>factors pertaining to C&D waste, the respondents were asked to state their level<strong>of</strong> knowledge ranging from very poor to excellent. Next, from amongconstruction, renovation, refurbish, remodel, repair and demolition, therespondents were asked to tick the item(s) that contribute(s) largest amount <strong>of</strong>wastes.© 2012 by MIP 108
PLANNING MALAYSIAJournal <strong>of</strong> the Malaysia <strong>Institute</strong> <strong>of</strong> <strong>Planners</strong> (2012)Section C - Practice on C&D Waste Management: In this section, therespondents were asked to articulate their level <strong>of</strong> awareness on C&D wastemanagement and rating <strong>of</strong> its practice in his/her Construction Company. Theywere also asked to specify the waste management method (Reduce, Reuse,Recycle, Composting, Burning, Land filling) that has been in use in his/hercompany in reference to a variety <strong>of</strong> waste materials.Section D - Minimizing C&D Waste: Using the 1-5 Likert scale (where 1 =minimally potential and 5 = maximally potential), the respondents were asked torate several strategies in order to minimize the C&D waste materials.Altogether 50 questionnaires were distributed to the respondents that includemainly contractors, engineers, and quantity surveyors in Klang valley area. Allthe respondents were contacted personally. The questionnaire was pilot testedthrough one quantity surveyor. He recommended rewording some <strong>of</strong> thequestions which was done before communicating to the survey respondents.DATA ANALYSISThirty two completed questionnaires were analysed. Table 2 provided thecategory <strong>of</strong> respondents who completed the questionnaires. The pr<strong>of</strong>ile <strong>of</strong> therespondents is shown in Table 3.Table 2: Category <strong>of</strong> respondents.Respondents Distributed Responded Percentage <strong>of</strong> returnContractors 20 12 60%Engineers 12 8 67%Quantity Surveyors 12 9 75%Others 6 3 50%Total 50 32 64%On the question <strong>of</strong> awareness, 88% <strong>of</strong> the respondents (28 in number)mentioned that they were aware on C&D wastes and the rest 12% were notaware about that. Figure 3 represents respondents’ agreement/disagreement onthe impacts <strong>of</strong> C&D wastes on environment and public health. As we observe,72% <strong>of</strong> the respondents agree that C&D waste affects environment and publichealth, with 12% <strong>of</strong> them strongly agreeing or remaining neutral on the issue.Only 4% disagreed.109© 2012 by MIP
Muhammad Abu Eusuf, Mansor Ibrahim & Rafikul IslamThe Construction and Demolition Wastes in Klang Valley, MalaysiaTable 3: Respondents’ demographic informationPersonal Information Frequency PercentGenderMaleFemale25778.1221.88Age group Less than 25 years 25-34 years 35-44 years 45-54 years 55 years or moreWorking experience Less than 5 years 5 -14 years More than 15 years7986211111021.8828.1225.0018.756.2534.3734.3731.25ig re 3: Respondent’s perception to ards the impacts <strong>of</strong> C&D waste to the environment and public healthTable 4 presents the respondents’ level <strong>of</strong> knowledge on various aspects<strong>of</strong> C&D waste and its management. Last column shows the mean values <strong>of</strong> thelevel <strong>of</strong> understanding. We observe that the respondents’ level <strong>of</strong> understandingbelow average on the following matters: Current percentage <strong>of</strong> C&D wasteproducts; Waste management hierarchy; <strong>Malaysian</strong> policies and legislation inC&D waste. Apart from the above three matters, the respondents possess aboveaverage knowledge in all other aspects. In fact they are most knowledgeable inthe following four matters (refer to Table 4): Definition <strong>of</strong> C&D waste; Types<strong>of</strong> C&D waste; Factors contributing to C&D waste; Benefits <strong>of</strong> C&D wastemanagement.Table 4: Level <strong>of</strong> knowledge on various aspects <strong>of</strong> C&D wasteMatter Level <strong>of</strong> knowledge MeaVery Poor(1)Poor(2)Average(3)Good(4)Excellent(5)n© 2012 by MIP 110
PLANNING MALAYSIAJournal <strong>of</strong> the Malaysia <strong>Institute</strong> <strong>of</strong> <strong>Planners</strong> (2012)Definition <strong>of</strong> C&D 0 (0)* 2 (6) 17 (53) 9 (28) 4 (13) 3.47wasteTypes <strong>of</strong> C&D0 (0) 4 (13) 17 (53) 9 (28) 2 (6) 3.28wasteFactors contributing 0 (0) 5 (16) 17 (53) 9 (28) 1 (3) 3.19to C&D wasteBenefits <strong>of</strong> C&D 0 (0) 4 (13) 19 (59) 8 (25) 1 (3) 3.19waste managementRoles <strong>of</strong>1 (3) 5 (16) 16 (50) 10 (31) 0 (0) 3.09construction <strong>of</strong>people in managingand reducing C&DwasteIntegrated waste 0 (0) 8 (25) 17 (53) 6 (19) 1 (3) 3.00management<strong>Malaysian</strong> policies 3 (9) 9 (28) 16 (50) 2 (6) 2 (6) 2.72and legislation inC&D wasteWaste management 1 (3) 11 (34) 17 (53) 3 (9) 0 (0) 2.69hierarchyCurrent percentage 3 (9) 10 (31) 16 (50) 3 (9) 0 (0) 2.59<strong>of</strong> C&D wasteproducts* The first and second numbers show the number <strong>of</strong> respondents and percentage, respectively. The same modehas been adopted in many <strong>of</strong> the subsequent tables. It is noted here that the total sample size is 32.Does the respondents’ demography (particularly, pr<strong>of</strong>ession and extent<strong>of</strong> experience in work) have any effect on their knowledge on various aspects <strong>of</strong>C&D waste One-way ANOVA has been performed for all the items shown inTable 4 for both pr<strong>of</strong>ession and number <strong>of</strong> years <strong>of</strong> working experience. In thisANOVA analysis (also subsequent MANOVA analysis), independent variablesare ‘pr<strong>of</strong>ession’ and number <strong>of</strong> years <strong>of</strong> working experience and dependentvariables are various aspects <strong>of</strong> C & D waste. Minimum p-values were found tobe 0.143 (F=2.094) and 0.122 (F=2.266) for pr<strong>of</strong>ession and working experience,respectively. Hence, respondents’ pr<strong>of</strong>ession and years <strong>of</strong> working experiencedo not have significant impact on the results. In other words, contractors,engineers, and quantity surveyors do not differ significantly in their opinion onthe knowledge <strong>of</strong> CDW and its management. Same is the case for people havingdifferent amount <strong>of</strong> working experience. Two-way ANOVA (pr<strong>of</strong>ession versusworking experience) also confirms the findings. No interaction was found to besignificant for any item (minimum p-value = 0.168 was observed for ‘benefits<strong>of</strong> CDWM’). Since ANOVA considers only one dependent variable at a time,both 1-way (pr<strong>of</strong>ession and working experience, separately) and 2-way(pr<strong>of</strong>ession and working experience together) MANOVA were performed andthe results are shown in Table 5. None <strong>of</strong> the p-values was found to besignificant. Therefore, considering all the items together, the respondents’111© 2012 by MIP
Muhammad Abu Eusuf, Mansor Ibrahim & Rafikul IslamThe Construction and Demolition Wastes in Klang Valley, Malaysiaopinions do not differ significantly across various types pr<strong>of</strong>ession and thenumber <strong>of</strong> years <strong>of</strong> working experience. 1Table 5: 1-way and 2-way MANOVA tests results on the level <strong>of</strong> knowledge on various aspects CDW.Type <strong>of</strong> Independent Wilk’s λ F p Partial 2 ObservedMANOVA variablepower1-way Pr<strong>of</strong>ession 0.567 0.655 0.830 0.247 0.351Experience 0.412 1.238 0.279 0.358 0.6832-way Pr<strong>of</strong>ession 0.245 1.358 0.239 0.505 0.638Experience 0.222 1.496 0.176 0.529 0.693Pr<strong>of</strong>ession *Experience0.108 1.050 0.434 0.426 0.711Figure 4 shows the respondents’ opinion towards the types <strong>of</strong> pro ectsthat contribute largest generation <strong>of</strong> C&D wastes. It is found that 75% <strong>of</strong> therespondents’ view is that residential construction pro ects generate maximumamount <strong>of</strong> wastes and this is followed by non-residential demolition projects(69%).Other 0%Demolition69%Repair34%Remodel28%Refurbish38%Renovation53%Construction75%0% 20% 40% 60% 80%Non-Residential ProjectResidential ProjectFigure 4: Respondents’ opinion on types <strong>of</strong> projects which causes the biggest generation <strong>of</strong> C&D wasteAccording to the data obtained, <strong>of</strong> the respondents’ view is that residentialconstruction projects generate maximum amount <strong>of</strong> wastes and this is followedby non-residential demolition projects (69%). One <strong>of</strong> our objectives was toidentify the components <strong>of</strong> construction materials that contribute to the C&Dwastes. The respondents were asked to rank the components provided from theleast contributor (1) to the most contributor (5). Table 6 provides the results.1 For all the A O A and MA O A tests <strong>of</strong> the present study, ‘Others’ and ‘ oexperience’ categories under r<strong>of</strong>ession and Working experience, respectively wereomitted owing to smaller sample size.© 2012 by MIP 112
PLANNING MALAYSIAJournal <strong>of</strong> the Malaysia <strong>Institute</strong> <strong>of</strong> <strong>Planners</strong> (2012)ComponentTable 6: Respondents’ opinion on the composition <strong>of</strong> C&D wastes.Level <strong>of</strong> contributionLeast Less Moderate More Mostcontrib contributor contributor contributor contributorutor (1) (2)(3)(4)(5)MeanWood 0 (0) 0 (0) 16 (32) 8 (25) 8 (25) 3.75Concrete 0 (0) 5 (16) 6 (19) 14 (44) 7 (22) 3.72Bricks 0 (0) 5 (16) 11 (34) 8 (25) 8 (25) 3.59Plastics 0 (0) 3 (9) 16 (50) 9 (28) 4 (13) 3.44Others 0 (0) 1 (3) 6 (19) 1 (3) 2 (6) 3.40Reinforced 0 (0) 5 (16) 17 (53) 8 (25) 3 (9) 3.38ConcretePaper/ Cardboards 3 (9) 4 (13) 10 (31) 10 (31) 5 (16) 3.31Rubble 1 (3) 8 (25) 12 (38) 5 (16) 6 (19) 3.22Metals 2 (6) 3 (9) 17 (53) 8 (25) 2 (6) 3.16Reinforcement 2 (6) 4 (13) 11 (34) 13 (41) 1 (3) 3.13Drywall 1 (3) 2 (6) 22 (69) 6 (19) 1 (3) 3.13Ro<strong>of</strong>ing 1 (3) 8 (25) 13 (41) 8 (25) 2 (6) 3.06Rubber 2 (6) 7 (22) 18 (56) 2 (6) 3 (9) 2.91Glass 3 (9) 8 (25) 12 (38) 8 (25) 1 (3) 2.88*It is noted here that the total sample size is 32It is clear that wood, concrete, bricks, and plastics constitute the bulk <strong>of</strong>C&D waste materials. From the whole table, the single highest percentage (69)<strong>of</strong> respondents said that drywalls constitute moderately to C&D wastes.Generally speaking, most <strong>of</strong> the respondents held the view that the componentseither constitute moderately or more than moderately to the C&D wastes (this isevident from the columns “Moderate contributor” and “More contributor”). Wealso observe that rubber and glass comprise the least amount to C&D wastes.From the mean values, we can also conclude that moderate contributors arereinforced concrete, drywall, metals, rubble, and paper/cardboards. In additionto the above findings, with one way ANOVA, one & two way MANOVA hasalso been performed. In this regard, the independent variables are pr<strong>of</strong>essionand working experience and dependent variables are various composition <strong>of</strong> C& D waste. One-way ANOVA test shows that respondents’ pr<strong>of</strong>ession does nothave significant impact on their opinion except the component ‘Ro<strong>of</strong>ing’. Onthis component, quantity surveyors (M=3.778) and contractors (M=2.417) differsignificantly (F=8.559, p=0.001). With regards to working experience, 1-wayANOVA reveals that ‘less than 5 years’ (M=3.000) differ significantly from the‘5-14 years’ (M= 3.636) (F=3.815, p=0.034). However, they do not differ on theremaining components. One-way as well as two-way MANOVA tests confirmthe findings as shown in Table 7.113© 2012 by MIP
Muhammad Abu Eusuf, Mansor Ibrahim & Rafikul IslamThe Construction and Demolition Wastes in Klang Valley, MalaysiaTable 7: 1-way and 2-way MANOVA tests results on the composition <strong>of</strong> CDW.Type <strong>of</strong> Independent Wilk’s λ F p Partial 2 ObservedMANOVA Variablepower1-way Pr<strong>of</strong>ession 0.001 2.576 0.318 0.973 0.167Experience 0.003 1.148 0.571 0.941 0.1042-way Pr<strong>of</strong>ession 0.0.000 9.554 0.099 0.989 0.417Experience 0.000 5.989 0.152 0.982 0.301Pr<strong>of</strong>ession *Experience0.000 3.368 0.142 0.959 0.362A 3 × 3 factorial ANOVA was employed to determine the effects <strong>of</strong>pr<strong>of</strong>ession and working experience on the respondents’ opinion on the ranking<strong>of</strong> construction materials. The main effect <strong>of</strong> pr<strong>of</strong>ession F(2,20)=5.449,p=0.013, 2 = 0.353 and interaction F(4,20)=3.674, p=0.021, 2 =0.424 werefound significant for ‘Reinforced concrete’. Overall, quantity surveyors(M=3.667) consider that reinforced concrete contribute more to the production<strong>of</strong> CDW compared to contractors (M=2.917). No other significant differencewas observed in this factorial design experiment. Respondents were also askedto provide their opinion on the extent they agree/ disagree on a number <strong>of</strong>factors that generate C&D wastes. Table 8 shows the summary results.FactorWaste due to the nature <strong>of</strong>building demolition orrenovation worksTable 8: Respondents’ opinion on factors that generate C&D wastes.Level <strong>of</strong> agreement/disagreementStrongly Disagre Neutral (3) Agreedisagree e (2)(4)(1)Stronglyagree (5)Mean0 (0) 2 (6) 6 (19) 13 (41) 11 (34) 4.03Poor storage <strong>of</strong> construction 0 (0) 0 (0) 7 (22) 18 (56) 7 (22) 4.00materialsCarelessness <strong>of</strong> workers in 1 (3) 1 (3) 9 (28) 14 (44) 7 (22) 3.78handling materialsWaste due to design1 (3) 2 (6) 8 (25) 14 (44) 7 (22) 3.75changes/variationsExcessive handling 0 (0) 4 (13) 12 (38) 14 (44) 2 (6) 3.44Problems during fabrication 2 (6) 1 (3) 14 (44) 12 (38) 3 (9) 3.41Waste due to negligence 1 (3) 3 (9) 16 (50) 10 (31) 2 (6) 3.28Waste due to poor designspecificationsCarelessness during quantityanalysis and measurementSubstitution (materialsdelivered to the site are usedfor other purposes)1 (3) 6 (19) 10 (31) 14 (44) 1 (3) 3.252 (6) 4 (13) 14 (44) 8 (25) 4 (13) 3.252 (6) 12 (38) 8 (25) 10 (31) 0 (0) 2.81*It is noted here that the total sample size is 32© 2012 by MIP 114
PLANNING MALAYSIAJournal <strong>of</strong> the Malaysia <strong>Institute</strong> <strong>of</strong> <strong>Planners</strong> (2012)Most <strong>of</strong> the respondents are <strong>of</strong> the opinion that wastes depend on the nature <strong>of</strong>demolition/renovation <strong>of</strong> buildings. They also concur that following are threemajor reasons for generation <strong>of</strong> waste:Poor storage <strong>of</strong> construction materials;Carelessness on the part <strong>of</strong> workers in handling materials;Waste due to design changes/variationsHowever, the following three items were not found as significant in terms <strong>of</strong>generation <strong>of</strong> C&D wastes:Waste due to poor design specifications;Carelessness during quantity analysis and measurement;Substitution (materials delivered to the site are used for other purposes)One-way ANOVA results show that respondents on the basis <strong>of</strong>pr<strong>of</strong>ession differ on their opinion about ‘Substitution’. Quantity surveyors(M=3.333) opined that substitution generates more wastes compared tocontractors (M=2.333) (F=4.205, p=0.026). Tukey HSD post hoc test alsoconfirms the findings (p=0.041). With regrds to working experience,respondents having experience ‘less than 5 years’ (M=3.200) and ‘5-14 years’(M=3.273) consider that substitution generates more wastes compared to therespondents having experience ’15 years or more’ (M=2.000) (F=8.197,p=0.002). Tukey HSD homogeneous subsets are shown in Table 9.Table 9: Tukey HSD homogeneous subsets for ‘Substitution’.Experience N Subset for alpha =0.051 2Less than 5 years 10 2.0005-14 years 10 3.20015 years or above 11 3.273Sig. 1.000 0.977When pr<strong>of</strong>ession and experience were considered jointly, 2-wayANOVA experimental design test confirms that both (Pr<strong>of</strong>ession:F(2,20)=3.926, p=0.036, 2 =0.282; Experience: F(2,20)=3.968, p=0.035, 2 =0.284) differ significantly on ‘Problem during fabrication’. Contractors(M=3.583) and quantity surveyors (M=3.556) held the view that ‘Problemduring fabrication’ contributes in generating CDW more than engineers(M=2.875). On the other hand, respondents having working experience ‘5 to 14years’ (M=3.818) consider that ‘Problem during fabrication’ contributes moretowards CDW compared to ‘less than 5 years’ (M=3.200) and ’15 years or115© 2012 by MIP
Muhammad Abu Eusuf, Mansor Ibrahim & Rafikul IslamThe Construction and Demolition Wastes in Klang Valley, Malaysiamore’ (M=3.200). However, their interaction was not found significant (F(4,20)=1.206, p=0.334, 2 =0.194). One-way and two-way MANOVA testsresults are presented in Table 10, which indicate that respondents do not differsignificantly on the items when they are considered together.Table 10: 1-way and 2-way MANOVA tests results on the factors that generate CDW.Type <strong>of</strong>MANOVAIndependentVariableWilk’s λ F p Partial 2 Observedpower1-way Pr<strong>of</strong>ession 0.351 1.169 0.335 0.408 0.645Experience 0.366 1.240 0.277 0.395 0.6992-way Pr<strong>of</strong>ession 0.198 1.639 0.236 0.554 0.640Experience 0.188 1.434 0.205 0.566 0.666Pr<strong>of</strong>ession *Experience0.031 1.633 0.057 0.580 0.930Next, the results <strong>of</strong> a number <strong>of</strong> Yes/ No type <strong>of</strong> questions are presented(refer to Table 11). It is surprising to find that more than 50% <strong>of</strong> therespondents are either not familiar or they are not sure about C&D wastemanagement. Further, almost 50% <strong>of</strong> the respondents are either not familiar ornot sure about 3R principles <strong>of</strong> waste management. Again less than 50% <strong>of</strong> therespondents’ companies practice ‘Reuse’ to lessen the burden <strong>of</strong> C&D wastematerials.Table 11: Familiarity with C&D waste managementQuestion Yes No Not SureAre you familiar with C & D waste management? 13(41) 5(16) 14(44)Are you familiar with Reduce, Reuse and Recycle 18 (56) 4 (13) 10 (31)(3R), composting, burning and land filling options?In order to prevent larger amount <strong>of</strong> generation <strong>of</strong>C&D wastes, does your construction company practicereusing <strong>of</strong> construction materials?13 (41) 7 (22) 12 (38)Figure 5 provides the results on ratings (1 = Very poor, 5 = Excellent) <strong>of</strong> C&Dwaste management in the respondents’ companies construction sites. Clearly,in most <strong>of</strong> the companies, the level <strong>of</strong> C&D management is average.Very PoorPoor19%Average75%Good 6%Excellent0% 15% 30% 45% 60% 75%ExcellentGoodAveragePoorVery PoorFigure 5: Rating Level <strong>of</strong> C&D waste management on construction site© 2012 by MIP 116
PLANNING MALAYSIAJournal <strong>of</strong> the Malaysia <strong>Institute</strong> <strong>of</strong> <strong>Planners</strong> (2012)C&D waste management is a part <strong>of</strong> a growing movement towardsdeveloping a sustainable world. It is important to identify the most commonmethods being used at the construction sites in order to protect the environmentas well as to save resources, and conserve energy either directly or indirectly.Figure 6 shows the percentage <strong>of</strong> usage <strong>of</strong> various waste management methodsthat include reduce, reuse, recycle, composting, burning or land filling. Thelisting has been done for materials: wood, concrete products, reinforcedconcrete, reinforcement, drywall, metal products, plastics products, ro<strong>of</strong>ing,rubble, bricks, glass products, rubber, paper or cardboards and others.100%Common waste management80%81%60%40%47%66%59% 59%41%56%47%44%53%38%20%3%6% 6%3%6%6%13%3%41% 44% 6%6%3%6%3%3%6%0%Reduce Reuse Recycle Composting Burning LandfilledFigure 6: Extent <strong>of</strong> applications <strong>of</strong> various C&D waste management methodsFrom the figure, we note the following points:According to 47% <strong>of</strong> the respondents, reuse is the most commonmethod to handle wood wasteThe most common method for dealing with concrete, reinforcedconcrete, drywall, rubble waste, ro<strong>of</strong>ing, and bricks is land filling; thereason could be that land filling is a cheaper option.Metals, plastics, papers/ cardboards are mainly recycledRubbers are recycled.117© 2012 by MIP
Muhammad Abu Eusuf, Mansor Ibrahim & Rafikul IslamThe Construction and Demolition Wastes in Klang Valley, MalaysiaTable 11 provides the summary <strong>of</strong> the most commonly used methods to dealwith varieties <strong>of</strong> C&D waste materials.Types <strong>of</strong> C&DwasteWoodConcreteReinforcedConcreteReinforcementDrywallMetalsPlasticsRo<strong>of</strong>ingRubbleBricksGlassRubberPaper/ CardboardsOthersTable 11: Application <strong>of</strong> C&D waste management methodsWaste management methodReduce Reuse Recycle Composting Burning Land fillAll possible measures need to be taken to minimize the constructionwastes. Respondents were asked to provide their opinion on the effectiveness <strong>of</strong>a number <strong>of</strong> wastes minimization strategies. Table 12 provides the summaryresults.Potential wasteminimization strategiesAppropriate location forstorageFabrication: Handling andcutting <strong>of</strong> materialsappropriatelyStandardization andflexibility in designsEnsure appropriatedimensions and quality <strong>of</strong>materialsProper implementation <strong>of</strong>materials management planEarly plans for purchasesand deliveriesReturn ability <strong>of</strong> unusedcontainers and palletsAccuracy in take-<strong>of</strong>fquantitiesProvide convenientcontainers for materialsstorage and retrievalTable 12: Opinion on waste minimization strategiesLevel <strong>of</strong> agreement/disagreementMeanStrongly Disagre Neutral (3) Agree (4) Stronglydisagree (1) e (2)agree (5)0 (0) 1 (3) 7 (22) 17 (53) 7 (22) 3.940 (0) 1 (3) 9 (28) 14 (44) 8 (25) 3.911 (3) 1 (3) 7 (22) 16 (50) 7 (22) 3.840 (0) 2 (6) 9 (28) 14 (44) 7 (22) 3.810 (0) 2 (6) 7 (22) 18 (56) 5 (16) 3.810 (0) 1 (3) 11 (34) 15 (47) 5 (16) 3.750 (0) 1 (3) 11 (34) 16 (50) 4 (13) 3.720 (0) 1 (3) 14 (44) 12 (38) 5 (16) 3.660 (0) 2 (6) 15 (47) 8 (25) 7 (22) 3.63*It is noted here that the total sample size is 32© 2012 by MIP 118
PLANNING MALAYSIAJournal <strong>of</strong> the Malaysia <strong>Institute</strong> <strong>of</strong> <strong>Planners</strong> (2012)According to the respondents, the most preferred strategies are the following:Appropriate location for storageAppropriate cutting and handling <strong>of</strong> materialsDesign standardization and flexibility in designEnsure appropriate dimensions and quality <strong>of</strong> materialsProper implementation <strong>of</strong> materials management planSurprisingly, respondents’ pr<strong>of</strong>ession and extent <strong>of</strong> working experiencedo not have significant effect on the findings on the waste minimizationstrategies. In the relevant 1-way ANOVA, the minimum p-value and thecorresponding F-value were found to be 0.166 and 1.926, respectively(pr<strong>of</strong>ession); the corresponding values for working experience are 0.083 and2.722, respectively. Same is the observation even considering all the strategiestogether as it is noted from Table 13.Table 13: 1-way and 2-way MANOVA tests results on the waste minimization strategies.Type <strong>of</strong> Independent Wilk’s λ F p Partial 2 ObservedMANOVA Variablepower1-way Pr<strong>of</strong>ession 0.461 0.947 0.534 0.321 0.518Experience 0.413 1.237 0.280 0.358 0.6832-way Pr<strong>of</strong>ession 0.473 0.606 0.861 0.312 0.280Experience 0.358 0.894 0.591 0.401 0.423Pr<strong>of</strong>ession *Experience0.116 1.009 0.483 0.417 0.688However, the 3 × 3 ANOVA experimental results show significantinteraction on two strategies, namely, ‘Standardization’ (F(4,20)=4.892,p=0.006, 2 =0.495) and ‘Unused containers’ (F(4,20)=3.151, p=0.037, 2 =0.387). With regards to main effect, experience (F(2,20)=4.773, p=0.020, 2 =0.323) has significant impact on ‘Purchase plan’. Contractors (M=4.000)consider that this strategy has more potential to minimize CDW at constructionsites compared to quantity surveyors (M=3.300). At the end <strong>of</strong> thequestionnaire, the respondents were asked to provide more recommendationswhich they feel appropriate in order to reduce C&D waste materials andimproving efficiency <strong>of</strong> waste management at the construction sites. Thefollowing recommendations are provided herewith that possess higherfrequencies:Implement the Industrialized Building System (IBS);Control the purchasing activities systematically in order to preventsurplus materials;119© 2012 by MIP
Muhammad Abu Eusuf, Mansor Ibrahim & Rafikul IslamThe Construction and Demolition Wastes in Klang Valley, MalaysiaPlan appropriately at the early stage for the whole construction project;Use recycled materials for the future construction in order to reduce theamount <strong>of</strong> wastes generated;Enforce rules and regulations on proper site management and controlwith strict monitoring and supervision.Since the sample size <strong>of</strong> the present research (i.e. 32) is rather smallcaution should be exercised to generalize the forgoing findings.Table 14: Differences in respondent’s opinion across pr<strong>of</strong>ession, and experiencesNo Independent Dependent Variables Differencesvariables1 Pr<strong>of</strong>ession Various aspect <strong>of</strong> C & D No significant differenceWorkingWasteNo significant differenceExperiences2 Pr<strong>of</strong>ession Composition <strong>of</strong> C & DwasteOn ‘ro<strong>of</strong>ing’ component, quantity surveyors andcontractors differ significantly.Pr<strong>of</strong>ession andworkingexperiencesComposition <strong>of</strong> C & DwasteQuantity surveyors consider that reinforcedconcrete contributes more to the production <strong>of</strong>CDW compared to contractors when working3 Pr<strong>of</strong>ession Factors that generateC&D wastes.Pr<strong>of</strong>ession andworkingexperiencesFactors that generateC&D wastes.4 Pr<strong>of</strong>ession Waste minimizationstrategiesexperience is considered.Quantity surveyors are <strong>of</strong> the opinion thatsubstitution generates more waste compared tocontractors.Contractors and quantity surveyors contend that‘Problem during fabrication’ contributes ingenerating CDW more than engineers, whenworking experience is considered.Contractors (M=4.000) consider that ‘purchaseplan’ has more potential to minimize CDW atconstruction sites compared to quantitysurveyors.The summary <strong>of</strong> the significant differences in opinion betweenpr<strong>of</strong>essional experiences are provided in Table 14.CONCLUSIONS AND RECOMMENDATIONSOver the years, SWM has attracted considerable attentions from the researchers.Since solid wastes are being generated at an increasingly higher rate all over theworld, improvements in SWM techniques are in genuine need. In the presentwork, an attempt has been made to highlight a number <strong>of</strong> issues in SWM,particularly C&D waste management in the Klang Valley <strong>of</strong> Malaysia. First, wehave observed that the main wastes generated are: wood, concrete, bricks,plastics, and reinforced concrete. The two main causes <strong>of</strong> the generation <strong>of</strong>© 2012 by MIP 120
PLANNING MALAYSIAJournal <strong>of</strong> the Malaysia <strong>Institute</strong> <strong>of</strong> <strong>Planners</strong> (2012)excessive amount <strong>of</strong> wastes are poor storage <strong>of</strong> construction materials andcarelessness in handling and cutting <strong>of</strong> materials. Therefore, in order to reducewaste, appropriate actions are to look for better storage and in the provision <strong>of</strong>an adequate amount <strong>of</strong> training <strong>of</strong> the construction workers, especially how toreduce the amount <strong>of</strong> wastes. We anticipate high return on investment <strong>of</strong>training to the ground level construction workers.The following recommendations are also put forward towards improving C&Dwaste management in Klang Valley: The utilization <strong>of</strong> Industrialized Building System (IBS) to reduce waste,as suggested by some respondents; In order to minimize C & D wastes, awareness among various partiesinvolved is absolutely essential; Hire personnel with higher pr<strong>of</strong>essional skills and those who havegreater sense <strong>of</strong> responsibility and accountability at the grass root level<strong>of</strong> construction sites.Caution needs to be exercised to generalize the findings as the samplesize <strong>of</strong> the present study was rather small. Especially, the respondents’demographic effects on the findings could be different sample size is increased.121© 2012 by MIP
Muhammad Abu Eusuf, Mansor Ibrahim & Rafikul IslamThe Construction and Demolition Wastes in Klang Valley, MalaysiaREFERENCESAhmad Haji Kabit, (2010). Strategic Solid Waste Management: The <strong>Malaysian</strong>Approach, Keynote Address from Secretary General <strong>of</strong> Ministry <strong>of</strong>Housing and Local Government Malaysia, at the Second Meeting <strong>of</strong> theRegional 3R forum 4 th October 2010 at Sunway Hotel Resort & Spa,Kuala Lumpur.California Integrated Waste Management Board. (2008). Retrieved April 20,2008, from California Integrated Waste Management Board:www.ciwb.ca.govColin Jeffrey (2011), Construction and demolition waste recycling: A literaturereview,Dalhousie University’s Office <strong>of</strong> Sustainability, Resource and RecoveryFund Board <strong>of</strong> Nova ScotiaChen, Z and Li, H (2006), Environmental management in construction: Aquantitive approach. New York: Taylors & Francis.CIDB (2009), Construction Opportunities in 9 th <strong>Malaysian</strong> Plan,http://www.cidb.gov.my/v6/files/Dolan, P.J., Lampo R. G., and Dearborn J. C.(1999). Concepts for reuse andrecycling <strong>of</strong> construction and demolition waste, US Army Corps <strong>of</strong>Engineers Construction Engineering Research Laboratories. DianePublishing.European Commission (2000). Management <strong>of</strong> construction and demolitionwaste, Working Document No.1.Environmental Protection Department (1999). Environmental Hong Kong.EPD-HKSAR: HKEnvironmental Protection Department (2000). Environmental Hong Kong.EPD-HKSAR: HKEnvironmental Protection Department (2005). Hong Kong waste treatment anddisposal statistics. Hong Kong: Department <strong>of</strong> Hong Kong. Retrieved3 rd March, 2008, from www.epd.gov/hkFishbein, B. (1998). Building for the future: Strategies to reduce constructionand demolition waste in municipal projects. Waste prevention:promoting waste prevention and design <strong>of</strong> less wasteful products, 5,102.Formoso, C. T., Isatto E. L., Hirota E. H, (2000), Method for waste control inbuilding industry, IGLC-7. California: University <strong>of</strong> California.Franklin Associates, F. (1998). Characterizations <strong>of</strong> building relatedconstruction and demolition debris in the United States. New York:Techlaw, Inc.© 2012 by MIP 122
PLANNING MALAYSIAJournal <strong>of</strong> the Malaysia <strong>Institute</strong> <strong>of</strong> <strong>Planners</strong> (2012)Graham, P. & Smither, G. (1996), Construction waste minimization forAustralian residential development. Asia Pacific Building andConstruction Management Journal, 2, 14-19.Hurley, J. (2003). Construction, innovation and global competitiveness: How toSMART Waste the construction industry. 10 th InternationalSymposium. I & II. London: CRC Press LLC.Kibert, C.J. & Languell, J.L. (2000), Implementing Deconstruction in Florida:Materials Reuse Issues, Disassembly Techniques, Economics andPolicy, School <strong>of</strong> Building Construction, Univ. <strong>of</strong> Florida.Mahanim et al. (2007). Construction waste management: The way forward.Proceedings <strong>of</strong> Quantity Surveying International Convention, (pp.142-156). Kuala Lumpur.Muluken Yeheyis, Kasun Hewage, M. Shahria Alam, Cigdem Eskicioglu, andRehan Sadiq (2012), An overview <strong>of</strong> construction and demolitionwaste management in Canada: a lifecycle analysis approach tosustainability, Clean Technologies and Environmental Policy, SpringerPitchtel, J. (2005). Waste Management practices: Municipal hazardous andindustrial. New York: Taylor & Francis Group.Poon, C.S. (2004). Low-waste building technologies and practices. Hong KongPolytechnic University, Hong Kong.Pun S.K., Liu C., Langston C., Treloar G., & Itoh Y. (2006). Promoting thereuse and recycling <strong>of</strong> building demolition materials, WorldTransactions <strong>of</strong> Engineering and Technology Education, 1.Sherman, R. (1996). Managing construction and demolition debris: A guide forbuilders, developers and contractors. AGRIS Centre: NAL/USDA(USA), North Carolina Cooperative Extension Service.Simpson, S. (2006). Sustainability Progress Report; General AdminstrationState <strong>of</strong> Washington.Skoyles, J. (1987) Waste Prevention at site. Mitchell Publishing.Southeast Regional Environmental Finance Centre (1996), Construction anddemolition debris recycling for environmental protection and economicdevelopment, University <strong>of</strong> Louisville.Tchobanoglous, G. and Kith (2002). Handbook <strong>of</strong> Solid Waste Management.New York: McGraw Hill.Tchobanoglous, G. (2003). Handbook <strong>of</strong> Solid Waste Management. New York:Mc Graw Hill.Udayangani, K., Dilanthi A., Richard H., Raufdeen R (2006). Attitudes andperceptions <strong>of</strong> construction workforce on construction waste in SriLanka, Management <strong>of</strong> Environmental Quality: An InternationalJournal, Volume 17, Number 1, 2006 , pp. 57-72(16)123© 2012 by MIP
Muhammad Abu Eusuf, Mansor Ibrahim & Rafikul IslamThe Construction and Demolition Wastes in Klang Valley, MalaysiaWang Hongzhong (2010). Municipal Solid Waste Management in Beijing inPerspective <strong>of</strong> World City, C40 Cities Waste Workshop, London 22-24March 2010Williams, P.T.(1998). Waste treatment and disposal. England: John Wiley &Sons.Wikipedia (2011). The Klang Valley,http://en.wikipedia.org/wiki/Klang_ValleyWolley, G.R.(2000). “Waste materials in construction”, Science andEngineering <strong>of</strong> Recycling for Environmental Protection Proceedings <strong>of</strong>Waste 1, pp(685-694). Harrogate: pergamon.© 2012 by MIP 124
PLANNING MALAYSIAM y I PAS AL MANAG M N P G AMM INMALAYSIA MA ING AS ISI L PLANN SMA1yyAIN I N© 2012 by MIP
M.Zainora AsmawiThe Future <strong>of</strong> Coastal Management Programme in Malaysia: Making the Coast Visible to <strong>Planners</strong>richness has not only inspired human, but also sustained our survival on theearth. As such, the author would like to take a positive look at the future <strong>of</strong>coastal management (CM) programme in a town planning (TP) context. Thenotion <strong>of</strong> CM has been accepted greatly in many parts <strong>of</strong> the worlds, coveringdeveloped nations and developing nations, following the success <strong>of</strong> EarthSummit meeting held in Rio de Janerio in 1992 (Asmawi, 2010). In the context<strong>of</strong> Malaysia, the concept <strong>of</strong> CM can be considered quite new and not manypractitioners are aware <strong>of</strong> its existence in the true meaning. Its implementationis very close to the practice <strong>of</strong> town planning system. However, it is doubtfulwhether the <strong>Malaysian</strong> planners realise the potential <strong>of</strong> TP to be integrated inthe CM practice. In Malaysia, research on coastal and estuarine areas is stillnew and fragmented between various disciplines, like coastal geomorphology,coastal engineering and marine biology, which according to Abdul Salam(1998), it is oriented to be institutionally or individually efforts. Thus, thisresearch studies and examines the TP system practised by the <strong>Malaysian</strong>Government with respect to the application <strong>of</strong> development plans anddevelopment control in managing coastal areas. This paper however does not<strong>of</strong>fer a wide ranging discussion <strong>of</strong> the issues and problems encountered inmanaging coastal areas in terms <strong>of</strong> resources and management techniques as thefocus in given to the discipline <strong>of</strong> TP in facilitating the coastal managementprogrammes.OBJECTIVESThis study aims to show that the TP system has potential to operate as a tool <strong>of</strong>CM in Peninsular Malaysia. This paper attempts to discuss the level <strong>of</strong>acceptance <strong>of</strong> <strong>Malaysian</strong> planners towards the concept <strong>of</strong> CM in relation to thescope <strong>of</strong> TP. Hence, the outline objectives for this study are:a. To study and examine the existing CM programmes in PeninsularMalaysia;b. To examine the content and practice <strong>of</strong> the present <strong>Malaysian</strong> TPsystem; andc. To analyse the relationship between TP and CM.© 2012 by MIP
PLANNING MALAYSIAJournal <strong>of</strong> the Malaysia <strong>Institute</strong> <strong>of</strong> <strong>Planners</strong> (2012)CONTEXT OF STUDYThe context <strong>of</strong> this study starts with the development <strong>of</strong> CM, which is greatlyconsidered as a useful medium for managing coastal areas in many countries.The development <strong>of</strong> CM is accepted in many countries, especially with theimpetus gained following the Earth Summit meeting in Rio de Janeiro in 1992.So far, there is no legal framework for establishing CM in Malaysia. In the localcontext, Abdullah (1999) and asiron (1998) state that CM in Malaysia hastraditionally been carried out on a sectoral basis with a top-down approach todealing with the matter. Though this has many limitations such as conflicts <strong>of</strong>interest, overlaps and duplication, Abdullah (1999) suggests that the sectoralbasedapproach has worked relatively well during the past decade. Itsdrawbacks signal a number <strong>of</strong> improvements required for developing a bettersystem <strong>of</strong> managing the coastal areas efficiently.In Peninsular Malaysia, the Federal Constitution 1957 apparentlyindicates that the TP system falls under the Concurrent List (List III), meaning itinvolves Federal, State and Local powers (Government <strong>of</strong> Malaysia, 1999).Therefore, the involvement <strong>of</strong> all these levels <strong>of</strong> government in the TP system isnecessary when dealing with planning and managing the coastal areas. Asmawi(2010) suggests that TP could be employed as a tool that has great influence onCM in Malaysia. Though the international perspective indicates that TP shouldbe seen as one sector in CM, the situation in Malaysia does not reflect thisopinion. Perhaps it reflects that <strong>Malaysian</strong> planners have not thought a greatdeal about CM. In Malaysia, coastal management and TP have been set up in asectoral basis and there is a lack <strong>of</strong> appropriate communication, co-operation,co-ordination and collaboration. The existing poor relationship between the TPsystem and the coastal management approach demonstrates the need for a studyon this matter. A comprehensive investigation <strong>of</strong> the relationship between theTP system and coastal management is necessary. This is to show that therelationship could be more effective, and that an appropriate relationship couldcontribute to the better implementation <strong>of</strong> CM.A brief observation indicates that CM concentrates on environmentalresource elements and is poorly integrated with TP. Some writers (e.g.,Allmendinger, arker Stead, 2002; Halliday, 1986; ay and Alder, 2005;Taussik, 1998, 2001, 2004) include the TP system aspect in their studies incoastal management. In Malaysia, very few studies have been undertaken toshow the links between the planning system and coastal resource managementin a local context (see e.g., Abdul Salam, 1998; Mokhtar Aziz, 200 ;Usuluddin, 1999).127© 2012 by MIP
M.Zainora AsmawiThe Future <strong>of</strong> Coastal Management Programme in Malaysia: Making the Coast Visible to <strong>Planners</strong>The <strong>Malaysian</strong> context echoes the international picture, though at aslower pace. Evidence <strong>of</strong> environmental degradation, with reference to seriouscoastal erosion problems in the early 1980s, triggered some initial action oncoastal management. Due to those problems, the Government launched theNational Coastal Erosion Study (1984-1985) under the Environment andNatural Resources Division <strong>of</strong> the Economic Planning Unit (EPU) in the <strong>of</strong>fice<strong>of</strong> the Prime Minister (Basiron, 1998; Loi, 1993 in Cicin-Sain & Knecht, 1998).Consequently, two important institutions related to coastal management wereestablished in 1987: the Coastal Engineering Technical Centre (CETC) and theNational Coastal Erosion Control Council (NCECC). Another major nationallevelcoastal area management effort involved the Environmental ImpactAssessment prescribed by the Environmental Quality Act 1974 (Act 127). Atthe national level, coastal management activities are co-ordinated on a project orprogramme basis by the Office <strong>of</strong> the Prime Minister’s Environment andNatural Resources Division.More major efforts at the local level are aimed at integrated coastalzone management (Basiron, 1998). In 1992, the first Coastal ResourcesManagement Plan for South Johore (CRMPSJ) was prepared with support fromvarious agencies: the Association <strong>of</strong> South East Asian Nations (ASEAN); theUnited States Agency for International Development (USAID); the CoastalResources Management Project <strong>of</strong> the Ministry <strong>of</strong> Science, Technology andEnvironment; the Implementation Co-ordination Unit <strong>of</strong> the Office <strong>of</strong> the PrimeMinister; and the Department <strong>of</strong> Fisheries (Ministry <strong>of</strong> Science, Technology andthe Environment, 1992). There are three pilot projects for CM initiatives beingundertaken in Sabah, Sarawak and Penang in 1999 to formulate an CM strategyat the respective State level (Jakobsen, Hartstein, Frachisse and Golingi, 2007).According to Basiron (1998), the main aim <strong>of</strong> the projects is to have all states inMalaysia replicate the effort and then produce their respective CM programmes.The progress in CM in these states represents the <strong>Malaysian</strong> commitment toChapter 17 <strong>of</strong> Agenda 21. These actions should provide the basis for developingfurther workable frameworks for coastal zone management plans in Malaysia(Basiron, 1998). The recent project for the coastal management initiative at thelocal level is the Port Klang CM programme (2001). However, the success <strong>of</strong>these coastal management plans still has to be evaluated. In 2011, the Town andCountry Planning Department (Federal) conducts a study on Physical Plan forNational Coastal Zones (Rancangan Fizikal Zon Persisiran Pantai Negara), acomprehensive study on coastal environment in relation to planning aspect. Thisis a positive effort considering that the nation’s coastline is facing variouschallenges due to the climate change effects globally. More importantly, it is© 2012 by MIP 128
PLANNING MALAYSIAJournal <strong>of</strong> the Malaysia <strong>Institute</strong> <strong>of</strong> <strong>Planners</strong> (2012)expected that the report is applicable to become as a workable mechanism incoastal management. Although there are difficulties in implementing Chapter 17<strong>of</strong> Agenda 21 in the local context (Chong, L.S., 2001), Malaysia has acceptedthe challenge <strong>of</strong> this agenda as evidenced by taking early steps in launchingprogrammes on coastal management and establishing government-relatedagencies under various ministries (Harakunarak, 2001). The Agenda provides agood framework to distil valuable lessons that could pave the way for the wiseuse <strong>of</strong> coastal resources through sustainable coastal management in Malaysia.Focusing on the <strong>Malaysian</strong> scenario, the conceptual idea <strong>of</strong> TP as a toolin CM applies to Malaysia. However, the interaction between these twoactivities is limited. The establishment <strong>of</strong> the TP system in Peninsular Malaysiadates back 30 years, whereas the CM system only started 14 years ago whichmakes it quite new in the national development agenda. The differences in theirsetting up put them apart. The legal backup <strong>of</strong> TP (i.e. Town and CountryPlanning Act 1976, Act 172) places it in a strong position while CM has nostatutory basis. CM needs support for its operation and for implementation. IfCM is to succeed, it demands serious attention to resolve these planning anddevelopment issues as well as issues related to other sectors. Since TP has amore established status in Malaysia, it could be the key to the successfulimplementation <strong>of</strong> the development related aspects <strong>of</strong> CM, like coastalsettlement development and tourism. Town planner is one <strong>of</strong> the keystakeholders in planning and managing coastal areas that could contribute to asustainable coastal management. In line with that, this paper tries to assist byinvestigating how town planners via the TP system can contribute best to CM inthe <strong>Malaysian</strong> context.LITERATURE REVIEW ON TOWN PLANNING AND COASTALMANAGEMENTMany parts <strong>of</strong> the coast around the world are considered risk areas becausesignificant coastal erosion, pollution, flooding, hurricane and tsunami eventsoccur frequently in many coastal nations. Coastal hazards are created wherenatural processes interact with, and threaten, human environments (Klee, 1999).This situation requires good management <strong>of</strong> coastal areas. Jones andWestmacott (1993), the Department <strong>of</strong> the Environment (1995) and Haslett(2008) suggest that the dominant elements <strong>of</strong> CM are the coastal resources andcoastal system itself, and human intervention in terms <strong>of</strong> skillful planning andmanagement within the coastal zone. The United Nations (1982) also recognises129© 2012 by MIP
M.Zainora AsmawiThe Future <strong>of</strong> Coastal Management Programme in Malaysia: Making the Coast Visible to <strong>Planners</strong>that the principle <strong>of</strong> CM is to understand the interrelationships between themany parts <strong>of</strong> the natural system.Many scholars in TP field agree that TP relates with a governmentactivity that regulates the development and physical use <strong>of</strong> land in the publicinterest (see Blowers, 2000; Gubbay, 2003; Southgate, 2003). As stated byDumashie (2001) and Rydin (1998a, 1998b), there are two principal instrumentsunderlie the TP framework, i.e. development plan system and developmentcontrol decisions. Development plans are considered the ‘heart’ <strong>of</strong> the forwardplanning framework, and development control, which is the implementationmechanism (Bishop, Tewdwr-Jones & Wilkinson, 2000). Most forwardplanning systems generally involve these two elements <strong>of</strong> TP practice.A major instrument <strong>of</strong> CM is the coastal management plan orprogramme (Stojanovic, 2002). This provides an important context for localauthorities and other relevant organisations involved in CM in producingdevelopment strategies. CM has some objectives that can only be achieved bycurtailing development. Only TP has the power that lies in a statutory regime.The legislation back-up <strong>of</strong> TP practice sets a powerful system. Therefore, CMmust be able to create a communication and collaboration partnership effortswith TP. At a local level, the TP system can make a contribution to CM byusing its development plan and development control systems. Coastal policiescould be widely incorporated into development plans and development controldecisions made based on development plans.Compared to many other sources in the literatures (e.g., Pido & Chua,1992), Vallega’s classification <strong>of</strong> coastal users covers many important users(Table 1). This covers a comprehensive list <strong>of</strong> activities on the coast,demonstrating that effective management tools are needed to control all theactivities without them falling into conflict with each other. The list consists <strong>of</strong>various coastal users, indicating the importance <strong>of</strong> an integration process toaccommodate the complexity <strong>of</strong> the coast.Table 1: Generic coastal users in literaturesSorensen and McCreary Pido and C ua 1 Valle a 111. Fisheries1. Agriculture1. Seaports2. Natural area protection 2. Fisheries and 2. Shipping, carrierssystemsaquaculture3. Shipping, routes3. Water supply3. Infrastructure 4. Shipping, navigation aids4. Recreation development 4. Mining5. Sea pipelines5. Tourism development 5. Ports and harbours 6. Cables6. Port development6. Industry7. Air transportation© 2012 by MIP 130
PLANNING MALAYSIAJournal <strong>of</strong> the Malaysia <strong>Institute</strong> <strong>of</strong> <strong>Planners</strong> (2012)7. Energy development8. Oil and toxic spillcontingency planning9. Industrial siting10. Agricultural development11. Mariculture development7. Tourism8. Urban development9. Forestry10. Shipping8. Biological resources9. Hydrocarbons10. Metalliferous renewablesources11. Renewable energy sources12. Defence13. Recreation14. Waterfront man-madestructures15. Waste disposal16. Research17. Archaeology18. Environmental protection andpreservationSource: Based on Vallega, 1999The classification by Sorensen and McCreary (1990) was set up toshow the issues (such as coastal erosion) and economic prospects (such asrecreation and development) which, at that time, were perceived by thecontemporary decision-makers as important. As a result, most <strong>of</strong> the categoriesare in the economic sector. Pido and Chua (1992) also include common sectorsassociated with the coasts and natural resources. Vallega (1992) shows a widerscope <strong>of</strong> sectors, including: resources (biological and energy resources); theeconomic sector (e.g., seaports and air transportation); man-made structures;and environmental protection.THE CURRENT INSTITUTIONAL ARRANGEMENTS FOR TP ANDCM IN PENINSULAR MALAYSIAThe current interaction between TP and CM in Peninsular Malaysia withreference to socio-economic and physical planning at three levels <strong>of</strong>administration involved: Federal; State; and Local. Traditionally, a top-downapproach has been applied with the significant driving force being the FederalGovernment. At the Federal level, the preparation <strong>of</strong> national documents likethe National Coastal Zone Policy (NCZP), the National Physical Plan (NPP)and Physical Plan for National Coastal Zones are undertaken by Federalagencies, namely, the Economic Planning Unit (EPU) and the Federal Townand Country Planning Department (TCPD) respectively. Any developmentdocuments produced at the Federal level, which come under the sector <strong>of</strong> socioeconomicand physical planning, interact with TP and CM. These two activitiesshould have two-way interaction since they would need to reinforce policy,implement policy and set the context for policy, as well as exchanginginformation.131© 2012 by MIP
M.Zainora AsmawiThe Future <strong>of</strong> Coastal Management Programme in Malaysia: Making the Coast Visible to <strong>Planners</strong>At present, there is no overall CM plan at the State level in PeninsularMalaysia, except for Penang. Unlike TP, which requires a Structure Plan to beprepared for every state in Peninsular Malaysia, CM does not have a State CMto reinforce the coastal management strategies and objectives. This is a missinglink between Federal and Local levels in the CM system. However, manyrelated technical agencies, such as the Department <strong>of</strong> Environment (DOE), theDepartment <strong>of</strong> Irrigation and Drainage (DID) and the Department <strong>of</strong> Forestry(DOF), have two-way interactions with the state Structure Plans by supplyinginformation and getting feedback.At the Local level, only three CM programmes have been established inPeninsular Malaysia: Port Klang; Kuantan; and South Johore. These initiativesare not led by LPAs even though they are the bodies that have powers to controlany development on land. For example, the Selangor Waters ManagementAuthority (SWMA) leads the Port Klang CM programme with major assistancefrom Klang Municipal Council and Kuala Langat District Council. At this level,currently, the practice shows that both CM and TP interact with the technicalagencies at State level.METHODOLOGICAL APPROACHThis research employs descriptive and argumentative analysis to explain therelationship between the two activities. Generally, the methods employed forthis study consist <strong>of</strong> the content analysis from the document search andquestionnaire survey (Figure 1).Content analysis (literature review):Supplementary information to the national primary researchPostal questionnaires survey:Provides first-hand data on the relationship between CM and TP at the nationallevel.Figure 1: The sequence <strong>of</strong> methods used in the national study© 2012 by MIP 132
PLANNING MALAYSIAJournal <strong>of</strong> the Malaysia <strong>Institute</strong> <strong>of</strong> <strong>Planners</strong> (2012)Study AreaMalaysia, a country <strong>of</strong> Southeast Asia, is composed <strong>of</strong> two non-contiguousregions – Peninsular Malaysia (West Malaysia) and East Malaysia - separatedby some 400 miles (650 kilometres) <strong>of</strong> the South China Sea. The latter,comprising the states <strong>of</strong> Sarawak and Sabah, is located along the northern andwestern edge <strong>of</strong> the island <strong>of</strong> Borneo. The study area, i.e. Peninsular Malaysia,as the name suggests, is bounded by the sea, except in the north where it isattached to mainland Asia via the Isthmus <strong>of</strong> Kra with Thailand. It is borderedon the north by Thailand, on the south by Singapore, on the west by the Strait <strong>of</strong>Malacca, and on the east by the South China Sea (Figure 2). PeninsularMalaysia comprises the Federal Territory <strong>of</strong> Kuala Lumpur and 11 states(Perlis, Kedah, Penang, Perak, Selangor, Negeri Sembilan, Malacca, Johore,Pahang, Terengganu and Kelantan) with a total area <strong>of</strong> 50,810 square miles(131,598 square kilometres). Formerly, known as the Federation <strong>of</strong> Malaya(1948-63), it contains the bulk <strong>of</strong> Malaysia's population.Figure 2: The study area <strong>of</strong> Peninsular Malaysia133© 2012 by MIP
M.Zainora AsmawiThe Future <strong>of</strong> Coastal Management Programme in Malaysia: Making the Coast Visible to <strong>Planners</strong>The total coastline in Peninsular Malaysia is 1970 kilometres(Abdullah, 1992; Economic Planning Unit, 1985). Physiographically, thecoastline <strong>of</strong> Peninsular Malaysia is <strong>of</strong> varied character and configuration(Abdullah, 1992). Abdullah states that the 860 kilometres long east coast <strong>of</strong>Peninsular Malaysia consists <strong>of</strong> straight sandy beaches in the north whilst thesouthern half comprises a series <strong>of</strong> large and small hook, or spiral, shaped bays.In contrast, the west coast, which measures 1,110 kilometres long, is made up <strong>of</strong>low elevation coastal plains <strong>of</strong> marine clay and river alluvium with mangroveswamps constituting 640 kilometres <strong>of</strong> its coastline (Syed Abdullah, 1992).Malaysia’s coastal areas are endowed with valuable marine ecosystems andvaluable resources. It provides economic opportunities and resources <strong>of</strong>developable land. But, at the same time, Abdul Salam (1998) states that coastalareas face many critical problems associated with wastewater discharge, erosionand coastal pollution. This situation has created a dilemma as how to plan andmanage the coastal areas in a sustainable manner whilst, simultaneously,encouraging economic development in Malaysia. Since there is no specificoverall national legislation, administrative or planning system for <strong>Malaysian</strong>coastal areas, and no single coastal development authority, this suggests thatimmediate action on coastal planning and management is crucial and timely.Questionnaire SurveyGovernment <strong>of</strong>ficials <strong>of</strong> Planning Unit at Local Planning Authority (LPA) wereselected as the respondents to supply required information. Only LPA that havecoastal areas were involved in the survey. Coastal LPAs are defined as thesuperior local authorities that administer one particular coastal district. Thesurvey covered all 40 coastal LPAs in Peninsular Malaysia. The response ratewas 65% and this could be considered as sufficient to provide a broader picture<strong>of</strong> the level <strong>of</strong> acceptance <strong>of</strong> planners towards the concept <strong>of</strong> CM (Figure 3).The formulation <strong>of</strong> the questionnaire form was based on the aspects <strong>of</strong> coastalmanagement concept.To ic <strong>of</strong> question1. Background details2. Awareness <strong>of</strong> the concept <strong>of</strong> CMTable 2: Rationale for the questions in the surveyRationaleTo determine the level <strong>of</strong> confidence that could beplaced on the answers and to show the pattern <strong>of</strong>expertise involved in CM programmesTo see whether <strong>Malaysian</strong> town planners are aware<strong>of</strong> the concept <strong>of</strong> CM.3. Availability <strong>of</strong> CM plan for that coastal LPA To identify the level <strong>of</strong> commitment <strong>of</strong> coastalLPAs to developing CM initiatives by producingCM plans4. Availability <strong>of</strong> any other programme on coastal To identify whether any other programme on© 2012 by MIP 134
PLANNING MALAYSIAJournal <strong>of</strong> the Malaysia <strong>Institute</strong> <strong>of</strong> <strong>Planners</strong> (2012)managementcoastal management had been established5. Reasons for lack <strong>of</strong> programme on CM To discover the obstacles stopping LPAs fromhaving CM programmes.6. Intention to set up a coastal group To identify the intentions <strong>of</strong> LPAs in coastalmanagementData AnalysisThe questionnaires apply the closed-ended questions with various choices.Respondents were asked to answer to a series <strong>of</strong> questions without prioritisingtheir responses. In order to establish the most important issues, analysisinvolved applying the Likert Scale. This technique is commonly used tomeasure attitudes, knowledge, perceptions, values, and behaviour changes.Responses were coded into numerical forms to produce ordinal data that isbased on a scale representing a range. It is one <strong>of</strong> the most standardised andacceptable response techniques in the field <strong>of</strong> social sciences. Thus, this hasallowed the author to make the analysis based on the priority <strong>of</strong> items, as shownin the analysis tables. The following steps were used in applying the LikertScale to the qualitative types <strong>of</strong> the questions designed in the study:a. Respondents were requested to evaluate the extent <strong>of</strong> theiragreement with a series <strong>of</strong> attitude statements;b. Each degree <strong>of</strong> response was given a numerical value or score. Forexample, very important (3), moderately important (2), <strong>of</strong> littleimportance (1), or not important (0);c. The numerical values <strong>of</strong> the scores for a set <strong>of</strong> questions weresummed to arrive at a total score where the highest total score isassociated with the most important item; andd. The resulting summed scores permit inferences to be made aboutthe selection <strong>of</strong> a specific group <strong>of</strong> people or specific issue.RESULTS AND DISCUSSIONBackground <strong>of</strong> respondentsThe respondents to the national study were all personnel <strong>of</strong> coastal LPAs.Figure 3 shows the breakdown <strong>of</strong> their backgrounds. Half <strong>of</strong> the respondentswere pr<strong>of</strong>essional town planners. This is followed by assistant town planners(29%) and planning technician (21%) respectively. The pattern <strong>of</strong> respondentdifferent roles indicates the validity <strong>of</strong> data in analysing the acceptance <strong>of</strong> CMamong the planning <strong>of</strong>ficers in Peninsular Malaysia.135© 2012 by MIP
M.Zainora AsmawiThe Future <strong>of</strong> Coastal Management Programme in Malaysia: Making the Coast Visible to <strong>Planners</strong>Planningtechnician5 (21%)Assistant townplanner7 (29%)Town planner12 (50%)Figure 3: Roles <strong>of</strong> respondents in the national studyThe national questionnaire covered 40 coastal LPAs. The state <strong>of</strong>Selangor provided the largest number <strong>of</strong> responding coastal LPAs. There wasone response from at least one LPA in each <strong>of</strong> the 11 states, indicating that theoverall coastline <strong>of</strong> Peninsular Malaysia was covered. Figure 4 shows thecoastal LPAs involved in the national survey. The distribution <strong>of</strong> responses wasquite evenly spread between the west and east coasts <strong>of</strong> Peninsular Malaysia.Thus, this means that the following analysis represents the whole study area <strong>of</strong>Peninsular Malaysia.Figure 4: Coastal LPAs involved in the questionnaire survey© 2012 by MIP 136
PLANNING MALAYSIAJournal <strong>of</strong> the Malaysia <strong>Institute</strong> <strong>of</strong> <strong>Planners</strong> (2012)Awareness <strong>of</strong> the concept <strong>of</strong> CMCurrently, Malaysia as a whole has not developed a national coastalmanagement programme. As one <strong>of</strong> the stakeholders in the coastal managementinitiative, planners were asked to see the level <strong>of</strong> the awareness <strong>of</strong> the coastalmanagement concept (Figure 5). This question is limited at local level; over half(58%) <strong>of</strong> the respondents considered they were poorly aware. A further 17% didnot know about the relevance <strong>of</strong> CM in their daily planning work commitments.This is not surprising given the limited national achievement on CM and thefact that respondents were town planners who mainly concentrate on terrestrialissues, particularly related with land matters. The result indicates that plannersdid not really realise that their works eventually contribute significantly towardsthe achievement <strong>of</strong> coastal strategies.Figure 5: Level <strong>of</strong> awareness <strong>of</strong> the coastal management conceptAvailability <strong>of</strong> CM plans and programmesThe previous question leads on to the subject <strong>of</strong> the availability <strong>of</strong> CM plansand programmes. As expected, few, 13% responding authorities had any CM137© 2012 by MIP
M.Zainora AsmawiThe Future <strong>of</strong> Coastal Management Programme in Malaysia: Making the Coast Visible to <strong>Planners</strong>plan (Figure 6). It was reported that these plans were prepared because therewere some substantial conflicts between economic development, environmentand tourism in those LPAs areas (i.e., Klang Municipal Council, Seberang PeraiMunicipal Council and Pekan District Council). These areas have widespreaddevelopment located within their coastal stretch in which the collaborationbetween TP and CM should be regarded as highly recommended. The plans,however, were merely on voluntary efforts and did not have statutory status.This situation consequently leads to the issue <strong>of</strong> lacking <strong>of</strong> implementationworks on the ground. Similarly, only four responding authorities (17%) had aCM programme as shown in Figure 7. The LPA are Klang Municipal Council(declaration on Port Klang Coastal Strategy), Muar Municipal Council (aprogramme integrating the coastal and river management sectors <strong>of</strong> itsdevelopment plans), Sepang Municipal Council (coastal development <strong>of</strong> BaganLalang area) and Kuala Selangor District Council (conservation <strong>of</strong> mangroveforest reserve). This demonstrates that the nature <strong>of</strong> programmes was basicallyfocused on the environmental management resources, targeting on specificcoastal issue. Currently, no comprehensive CM programmes were undertaken inan integrated approach between the agencies involved in TP and CM.Figure 6: Availability <strong>of</strong> CM plans© 2012 by MIP 138
PLANNING MALAYSIAJournal <strong>of</strong> the Malaysia <strong>Institute</strong> <strong>of</strong> <strong>Planners</strong> (2012)Figure 7: Availability <strong>of</strong> CM programmesAvailability <strong>of</strong> any other programmes on CMLPAs can be involved in CM indirectly through coastal groups. This couldallow CM objectives to be delivered through TP practice. However, generallythroughout the country, there is little commitment to coastal groups. Only AlorGajah Municipal Council and Penang Municipal Council (8%) said that theyhave coastal groups (Figure 8). The main tasks <strong>of</strong> these groups are cleaning upthe coastal areas or maintenance <strong>of</strong> the facilities provided at the beach for publicuse. These groups were formed by the department for planning anddevelopment control. The low response on having coastal groups is the mainconcern <strong>of</strong> this study where it reflects the priority is not given to the CM workas part <strong>of</strong> the TP works. Meanwhile, four other LPAs (Port Dickson MunicipalCouncil, Marang District Council, Kubang Pasu District Council and YanDistrict Council) intended to set up coastal groups. A specific question wasasked about the reasons for setting up coastal groups as shown in Table 3.Generally, the result demonstrates that concern for public safety seems to be themost important reason for setting up coastal groups, followed by (in priorityorder):139© 2012 by MIP
M.Zainora AsmawiThe Future <strong>of</strong> Coastal Management Programme in Malaysia: Making the Coast Visible to <strong>Planners</strong>a. Increased environmental pollution (Score <strong>of</strong> 9);b. Economic benefit from coasts (Score <strong>of</strong> 9);c. Loss <strong>of</strong> habitat (Score <strong>of</strong> 8); andd. Increasing onshore development (Score <strong>of</strong> 8).Figure 8: Availability <strong>of</strong> coastal groupTable 3: Reasons identified for setting up coastal groupsQuestion: Why do you feel it is necessary to set up a group dealing with coastal matters?ReasonsVery Moderate Minor NotTotalsignificant(Score <strong>of</strong> 3)significance(Score <strong>of</strong> 2)significance(Score <strong>of</strong> 1)relevant(Score <strong>of</strong> 0)No. Sc No. Sc No. Sc No. Sc N (%) Score(%) ore (%) ore (%) ore (%) ore1. Concern about theprotection <strong>of</strong>public safetywithin coastalareas3(75)9 1(25)2 0 0 0 0 4 (100) 112. Increasingenvironmentalpollution3. Economic benefitfrom coasts2(50)1(25)1(25)3 3(75)2 1(25)1 0 0 4 (100) 90 0 0 0 4 (100) 9© 2012 by MIP 140
PLANNING MALAYSIAJournal <strong>of</strong> the Malaysia <strong>Institute</strong> <strong>of</strong> <strong>Planners</strong> (2012)4. Increasing loss <strong>of</strong> 20 0 2 2 0 0 4 (100) 8habitats(50)(50)5. Increasing onshore 1 3 21 1 0 0 4 (100) 8development (25) (50) (25)6. Increasing1 3 1 2 2 2 0 0 4 (100)importance <strong>of</strong>fisheries activity(25) (25) (50)7. Importance <strong>of</strong> 0 0 3 6 1 1 0 0 4 (100)having anintegratedapproach(75) (25)8. Commitment to 0 0 3 6 1 1 0 0 4 (100)Agenda 21(75) (25)9. Concern about sealevel1 3 0 0 2 2 1 0 4 (100)rise(25)(50) (25)10. Increasing0 0 21 1 1 0 4 (100)navigationalactivities(50) (25) (25)11. Increasing <strong>of</strong>fshore 0 0 21 1 1 0 4 (100)development(50) (25) (25)12. Directive from 0 0 21 1 1 0 4 (100)federaladministration/government(50) (25) (25)Note: Total res ondents answering this uestion (Port Dickson Munici al Council, Marang DistrictCouncil, Kubang Pasu District Council and an District Council)Reasons for lack <strong>of</strong> programme on CMThe poor response on the awareness <strong>of</strong> CM and efforts undertaken in relation toTP and CM triggered the curiosity to the underlying reasons for that scenario.The main reason given for not being able to produce any programme on CM isthat expertise in CM is not available (Table 4). Lack <strong>of</strong> manpower, combinedwith severe financial constraints, suggests there is a need to develop human andinstitutional capacity in CM at the local level because the limited expertise thatexists is concentrated in universities, government organisations or independentresearch agencies.Table 4: Reasons for not producing any programme on CMQuestion: What do you see as the reasons that your local authority has not produced any programme onCM?Reasons1. No expertise incoastalmanagementVerysignificant(Score <strong>of</strong> 3)No.(%)15(75)2. Lack <strong>of</strong> manpower 13(65)ScoreModeratesignificance(Score <strong>of</strong> 2)No.(%)3(15)39 3(15)ScoreMinorsignificance(Score <strong>of</strong> 1)Notrelevant(Score <strong>of</strong> 0)No.(%)ScoreNo.(%)6 0 0 2(10)6 1 (5) 1 3(15)ScoreNo.(%)0 20(100)0 20(100)TotalScore16141© 2012 by MIP
M.Zainora AsmawiThe Future <strong>of</strong> Coastal Management Programme in Malaysia: Making the Coast Visible to <strong>Planners</strong>3. Financialconstraints4. No directive fromtop administration5. Poor level <strong>of</strong>awareness <strong>of</strong>coastal issuesamongadministrativepersonnel12(60)5(25)5(25)26 6(30)1 6(30)1 5(25)12 0 0 2(10)12 6 6 3(30) (15)10 6 6 3(30) (15)0 20(100)0 20(100)0 20(100)Note: Total res ondents answering this uestion 20.383331MAKING THE COAST VISIBLE TO PLANNERSFor too long the coast has been seen as a limited environmental issues andremained invisible in mainstream policy where planners involve largely in theprocess. With the advent <strong>of</strong> new approaches to coastal policy and planning, ifthe coast to receive the attention it demands from planners, then its wider socialrelevance must be elaborated and widely communicated. Taking intoconsideration the global movement on the significance <strong>of</strong> CM, it is essential thatthe TP system in Malaysia must be given a coastal focus. Previous practicesindicate that the coast barely receives a mention in development plan and whereit does, and then it is only in relation to major elements, all with a strongenvironmental focus, concerning the water environment and coastal erosion.This happens when the LPAs rely heavily on coastal areas for importanteconomic sectors such as tourism activities. The formulation <strong>of</strong> Physical Planfor National Coastal Zones (Rancangan Fizikal Zon Persisiran Pantai Negara)by the Federal Town and Country Planning Department has marked atremendous milestone for the nation in engaging coastal areas in planningpractice. It is hoped that with this important document, the coast will notcontinue to remain virtually invisible in future spatial planning and policy inthis country.CONCLUSIONIn terms <strong>of</strong> the relationship between CM and TP, the analysis <strong>of</strong> this papersuggests that generally planners have little awareness <strong>of</strong> CM. The notion <strong>of</strong> CMis rarely understood by <strong>Malaysian</strong> planners. Consequently, they do notrecognise the importance <strong>of</strong> TP to CM or the nature <strong>of</strong> relationship between thetwo activities. This reduces the ability and capability <strong>of</strong> <strong>Malaysian</strong> planners toimplement coastal policy but also leaves them with an expectation that TP can© 2012 by MIP 142
PLANNING MALAYSIAJournal <strong>of</strong> the Malaysia <strong>Institute</strong> <strong>of</strong> <strong>Planners</strong> (2012)play an over extended role in CM. In addition, this paper also discovers thatdevelopment planning is greatly considered as the means by which TP canimplement CM strategies. It is recognised that the development plan <strong>of</strong> TP canhelp implement CM objectives and strategies. This is the major mechanism bywhich TP can contribute to CM. As such, this study suggests TP has a vital rolein implementing CM, considering town planner as the main player in the overallsystem <strong>of</strong> CM in Peninsular Malaysia. While planning is, perhaps, uniquelyplaced to lead this and there are advantages in it doing so, this study also has toacknowledge the drawbacks <strong>of</strong> this. In the end, it is felt that the planningfunction, with greater guidance and support from the government, could providea platform for the future success <strong>of</strong> CM in Malaysia.143© 2012 by MIP
M.Zainora AsmawiThe Future <strong>of</strong> Coastal Management Programme in Malaysia: Making the Coast Visible to <strong>Planners</strong>REFERENCESAbdullah, K. (1999). <strong>Malaysian</strong> coastal environment: planning, developmentand management <strong>of</strong> the environment in preparation for the nextmillennium. Proceeding <strong>of</strong> the international symposium and expositionon coastal environment and management: challenges in the newmillennium. 13-15 October, 1999. Kuala Lumpur, Malaysia.Abdul Salam, M.N. (1998). An overview <strong>of</strong> integrated coastal and estuarinearea management. Kuala Lumpur. World Wildlife Fund-Malaysia.Allmendinger, P., Barker, A. and Stead, S. (2002). Delivering integrated coastalzone management through land use planning [Electronic version].Planning Practice and Research, 17 (2), 175-196.Asmawi, M. (2010) Integrated Coastal Management and Town Planning inPeninsular Malaysia: Concept and Practice, Mauritius: VDM Publishing.Basiron, M.N. (1998). The implementation <strong>of</strong> chapter 17 <strong>of</strong> Agenda 21 inMalaysia: challenges and opportunities. Ocean and CoastalManagement, 41, 1-17.Bishop, K., Tewdwr-Jones, M. and Wilkinson, D. (2000). From spatial to local:the impact <strong>of</strong> the European Union on local authority planning in the UK[Electronic version]. Journal <strong>of</strong> Environmental Planning andManagement, 43 (3), 309-334.Blowers, A. (2000). Ecological and political modernisation [Electronic version].Town Planning Review, 71 (4), 371-393.Chong, L. S. (2001). Coastal zone management: the <strong>Malaysian</strong> experience.National conference on hydrology, hydraulics and sustainable waterresources management. Kuala Lumpur.Cicin-Sain, B. and Knecht, R.W. (1998). Integrated coastal and oceanmanagement: concepts and practices. USA: Island Press.Department <strong>of</strong> the Environment. (1995). Coastal planning and management: areview <strong>of</strong> earth science information needs. London: HMSO.Dumashie, D.A. (2001). Strategic management <strong>of</strong> the coast: landowners, localauthorities and coastal zone management. Unpublished doctoraldissertation. UK: The University <strong>of</strong> Wales.Economic Planning Unit. (1985). National coastal erosion study phase 1.Kuala Lumpur: Economic Planning Unit.Gubbay, S. (2003). From land use planning to sea use planning. In Earll, R.(ed.) Spatial planning in the coastal and marine environment: nextsteps to action. CoastNET conference 1 October 2003, SOAS,University <strong>of</strong> London.Halliday, J. (1986). Coastal zone management in England and Wales. a study <strong>of</strong>© 2012 by MIP 144
PLANNING MALAYSIAJournal <strong>of</strong> the Malaysia <strong>Institute</strong> <strong>of</strong> <strong>Planners</strong> (2012)area, organisation and attitude. Unpublished doctoral dissertation. UK:University <strong>of</strong> Wales.Harakunarak, A. (2001). Malaysia: ICM Country Pr<strong>of</strong>ile. Retrieved September14, 2005 from www.globaloceans.org/country/malaysia.Haslett, S. (2008). Coastal Systems (Second edition). UK: Routledge.Jakobsen, F., Hartstein, N., Frachisse, J. and Golingi, T. (2007). Sabah shorelinemanagement plan (Borneo, Malaysia): Ecosystems and pollution[Electronic version]. Ocean & Coastal Management, 50 (1–2), 84-102.Jones, V. and Westmacott, S.E. (1993). Management arrangements for thedevelopment and implementation <strong>of</strong> coastal zone managementprogrammes. World Coast Conference 1993. International Conferenceon Coastal Zone Management. The Netherlands: Coastal ZoneManagement Centre.Kay, R. and Alder, J. (2005). Coastal Planning and Management (Secondedition). UK: Taylor and Francis.Klee, G.A. (1999). The coastal environment: toward integrated coastal andmarine sanctuary management. New Jersey: Prentice Hall.Ministry <strong>of</strong> Science, Technology and the Environment. (1992). The coastalresources management plan for South Johore, Malaysia. Manila:ICLARM Mokhtar, M. and A.Ghani Aziz, S.A. (2003). Integratedcoastal zone management using the ecosystems approach: someperspectives in Malaysia [Electronic version]. Ocean and CoastalManagement, 46, 407-419.Pido, M.D. and Chua, T.-E. (1992). A framework for rapid appraisal <strong>of</strong> coastalenvironments. In Chua, T.-E. and Scura, F. (Eds.), Integrativeframework and methods for coastal area management (pp. 133-148).Manila: International Center for Living Resources Management.Rydin, Y. (1998a). Land use planning and environmental capacity: reassessingthe use <strong>of</strong> regulatory policy tools to achieve sustainable development[Electronic version]. Journal <strong>of</strong> Environmental Planning andManagement, 41 (6), 749-765.Rydin, Y. (1998b). Urban and environmental planning in the UK. Basingstoke:Macmillan Press Ltd.Sorensen, J.C. and McCreary, S.T. (1990). Institutional arrangements formanaging coastal resources and environments. Washington D.C.: U.S.National Park Service.Southgate, M. (2003). The plan-led approach. In Earll, R. (ed.) Spatial planningin the coastal and marine environment: next steps to action. CoastNETconference 1 October 2003, SOAS, University <strong>of</strong> London.Stojanovic, T.A. (2002). Coastal strategies in England and Wales: principlesfor managing information. Unpublished doctoral dissertation. Cardiff:145© 2012 by MIP
M.Zainora AsmawiThe Future <strong>of</strong> Coastal Management Programme in Malaysia: Making the Coast Visible to <strong>Planners</strong>University <strong>of</strong> Wales, Cardiff:Syed Abdullah, S.M. (1992). Development plan for coastal zone management inMalaysia: issues and recommendations. In Tjia H.D. and SyedAbdullah, S.M. (Eds.), The coastal zone <strong>of</strong> Peninsular Malaysia (pp.63-71). Kuala Lumpur: Universiti Kebangsaan Malaysia.Taussik, J. (1998). The contribution <strong>of</strong> town and country planning to themanagement <strong>of</strong> coastal resources: England/Wales and Sweden.Scandinavian Housing and Planning Research, 15, 175-182.Taussik, J. (2001). Collaborative planning in the coastal zone. Unpublisheddoctoral dissertation. Cardiff: Cardiff University.Taussik, J. (2004). Changes to the planning system. Unpublished document.Usulludin, Y. (1999). A legal and policy analysis <strong>of</strong> integrated coastal zonemanagement within the framework <strong>of</strong> sustainable development:protection and preservation <strong>of</strong> the <strong>Malaysian</strong> coastal environment.Unpublished doctoral dissertation. UK: University <strong>of</strong> Wales.Vallega, A. (1999). Fundamentals <strong>of</strong> integrated coastal management (Vol. 49).The Netherlands: Kluwer Academic Publishers.© 2012 by MIP 146
PLANNING MALAYSIAJournal <strong>of</strong> the Malaysia <strong>Institute</strong> <strong>of</strong> <strong>Planners</strong> (2012)NOTES TO CONTRIBUTORS AND GUIDELINES FOR MANUSCRIPTSUBMISSIONINTRODUCTION:PLANNING MALAYSIAPLANNING MALAYSIAArticles, viewse t res will t e t e t e t e ici l view t e M l siI stit te Pl ers MIP less it c rries t e e MIP s t e t rSUBMISSION OF MANUSCRIPTS:SCOPUSE it ri C ie , PLANNING MALAYSIA r l t e M l si I stit tePl ers , Pert Per c M l si , B , l SS B,A Seri, el , , Pet li , Sel r D r l E s ,MALAYSIA Tel: F :i t ree c ies s l i e ll e i t e r e, t , w r s© 2012 by MIP
Guidelines for Manuscript Submissionconsideration for this, tw c ies t e c rre t r l will be provided foreach article. Additional reprints <strong>of</strong> articles can be ordered, at cost, by theauthor(s). PD format <strong>of</strong> the article (if available) can be obtained from thePublisher.LAYOUT:Articles should be typed in single spacing (including footnotes, endnotes andreferences) on one side <strong>of</strong> the paper only (preferably A4) with the followingmargins: right and left - 4.25 cm, top - 5.5 cm and bottom - 5.2 cm (includingheader – 4.5 cm and footer – 4. cm) in 11 point Times New oman font.ootnotes should be numbered consecutively and placed at the end <strong>of</strong> themanuscripts. ootnotes should be kept to a minimum. Tables and diagramsshould be provided on separate sheets at the end <strong>of</strong> the manuscript and theirpositions indicated in the text.eferences should be placed in alphabetical order at the end <strong>of</strong> the text andshould be cited in the text by the name(s) <strong>of</strong> the author(s), followed by the year<strong>of</strong> publication. hen an author has more than one publication, arrange thereferences by placing the most recent one first. or books, be certain to includeplace <strong>of</strong> publication and publisher for a journal include volume, month, andpages. Do not abbreviate titles or citations.They shall appear in the following format:Journals Ahris Yaakub, ealey, . G., and ughes, C. G. (1 0). TheApplication <strong>of</strong> Geographic Information Systems forrban Landuse Planning and Monitoring: A CaseStudy <strong>of</strong> Low-cost ousing Development in ualaLumpur, Malaysia. n ironment and PlanninPlannin and esi n, 17, 85- .Lee Lik Meng and Alias Abdullah. (1 ). Concepts andIdeas for An Information System for Land andDevelopment (ISLAND). Journal <strong>of</strong> PlanninMalaysia, , 24- 4.oo s mer, Spahic. (2002). Studies in the Islamic uiltn ironment. uala Lumpur: esearch Centre,International Islamic niversity Malaysia.© 2012 by MIP 148
PLANNING MALAYSIAJournal <strong>of</strong> the Malaysia <strong>Institute</strong> <strong>of</strong> <strong>Planners</strong> (2012)Steiner, Frederick. (1999). The Living Landscape: AnEcological Approach To Landscape Planning. NewYork: McGraw-Hill, Inc.Book Chapters:Thesis andUnpublishedMaterials:Proceedings:Reference:Miller D. J., and Sias J. (2000). Deciphering LargeLandslides: Linking Hydrological, Groundwaterand Slope Stability Models Through GIS. InHydrological Applications <strong>of</strong> GIS, Guernell A.M. and Montrgomery D. R., eds. New York:John Wiley and Sons. 103-121.Alias Abdullah. (1995). An Integrated Method <strong>of</strong>MCDM and GIS for Land Use Planning andEnvironmental Resources Management.Unpublished Ph.D. Thesis. Kumamoto, Japan:Kumamoto University.Rainis, R., Jaafar, N., and Mohd Zain, S. (2002). GIS-Based Decision Support System (DSS) forMonitoring and Simulating River WaterQuality. Proceedings <strong>of</strong> the NationalConference on Rivers ’99, 14-17 October 1999,Penang. 263-269.http://www.sciencebuddies.org/science-fairprojects/project apa format examples.shtml(retrieved date: ………..)All foreign words must be typed and transliterated. The Editorial Board reservesthe right to change the transliteration <strong>of</strong> all historical names, titles and non-English terminology to bring them into conformity with its own style.USE OF FORMULA, FIGURES AND TABLES:Formula (mathematical formula) should be used only when necessary and theconclusions derived must be explained and made intelligible to a nonmathematicalreader. Wherever possible, authors are encouraged to place themathematical parts <strong>of</strong> the article in an appendix. In cases <strong>of</strong> empirical articles,authors are expected to make readily available a complete set <strong>of</strong> data and anyspecialized computer programs to interested readers.14© 2012 by MIP
Guidelines for Manuscript SubmissionAll illustrations, figures and/or tables in the manuscript must be captioned, inclear black and white (grayscale) and ready for reproduction.REFEREEING PROCEDURE:Articles will be acknowledged upon receipt. Only selected (preferred) articleswill be reviewe tw r t ree re erees in addition to the editors. Editorialdecision will normally be made within tw t si t s, but circumstancesbeyond control occasionally dictate a longer cycle. If authors are invited toprepare a revision for further consideration, the major issues to be resolved willoutlined and will be forwarded to them as quickly as possible.ACCEPTED ARTICLES:Authors <strong>of</strong> accepted articles will be requested to provide a digital copy <strong>of</strong> themanuscript, preferably in Micros<strong>of</strong>t Word to the MIP (the Publisher) via emailat pmjournal@gmail.com and/or mip@mip.org.my. MIP will not be responsiblefor the loss or damage <strong>of</strong> the digital copy.COPYRIGHT:Once published in the PLANNING MALAYSIA, the copyright <strong>of</strong> the article isautomatically vested with the <strong>Malaysian</strong> <strong>Institute</strong> <strong>of</strong> <strong>Planners</strong> (MIP). Thecopyright covers the exclusive use <strong>of</strong> rights to reproduce and distribute thearticle, including reprints, photographic reproductions, micr<strong>of</strong>ilm or anyreproduction <strong>of</strong> a similar nature and translations. Permission to publishillustrations must be obtained by the author before submission. Anyacknowledgements should be included in the figure captions.Contact:Editor-in-ChiefPLANNING MALAYSIAJournal <strong>of</strong> the <strong>Malaysian</strong> <strong>Institute</strong> <strong>of</strong> <strong>Planners</strong>B-01-02, Jalan SS7/13B, Aman Seri, Kelana Jaya,47301, Petaling Jaya, Selangor Darul Ehsan, MALAYSIATel: 603 78770637 Fax: 603 78779636Email: pmjournal@gmail.com or mip@mip.org.myHomepage: http://www.mip.org.my© 2012 by MIP 150
PLANNING MALAYSIAJournal <strong>of</strong> the Malaysia <strong>Institute</strong> <strong>of</strong> <strong>Planners</strong> (2012)PLANNING MALAYSIA JOURNAL:THE PAST ISSUESMuha a aris b ullah Isha riffino iah Johara aru in Moha e b ul i ussinorhayati MahyuinIbrahiahI a elias b ullah Muha a aris b ullah au an or ineei MenJa alunlailib ullahCreating The Essence Of Cities: The Putrajaya’s ExperienceJebasin a Issa e Johnlias b ullah i Munerahani i Muha aa aru in Moha e ah at a Mustafa rin b ullah hafar h ahi a Ir ana arhaharu in I rus b ul a a a iMuha a aris b ullahMoh halha litha byan hean ie© 2012 by MIP
he Past IssuesA Study On The Demand Of Spatial Planning & Decision Support System In MalaysiaMuhammad Faris Abdullah, Alias Abdullah, Mansor Ibrahim & Dazilah AbdulSamadThe Technology Of Asset Management & Maintenance Culture In Ensuring SustainableDevelopmentKhairiah Talha & KC LeongTessellation Planning & Honeycomb HousingMazlin Ghazali, Michael J. Durack & Mohd Peter DavisThe Application Of The Concept Of Defensible Space For Secured Housing EnvironmentSaari Omar & Megat Arif Shah Megat OmarVolume 4, 2006:How We Failed To Plan For HabitabilityLee Lik Meng, Aldrin Abdullah, Tan Sook Fern, Nurwati Badrulzaman & AhmadSanusi HassanCairo’s Al-A har Park: Millennium Development oals Etched In reenKhaled el-KhishinKnowledge Cities: Examining The Discourse Smart illages, Internet Cities Or CreativityEnginesAli A. AlroufA Preliminary Investigation Of A Model On The Decision To Implement Teleworking InThe apanese Business OrganisationsAbdul Azeez Kadar Hamsa & Masao MiuraAn Integration Of Multicriteria Analysis WithPlanNor Sallehi Kassim & Rafikul IslamIS In The <strong>Malaysian</strong> National PhysicalVolume 5, 2007:Effectiveness <strong>of</strong> Public Participation Programme: A Feedback from Participants SabakBernam District Local Plan and Kuala Lumpur Structure PlanDasimah Omar & Oliver Ling Hoon LehMulticriteria Analysis <strong>of</strong> Flood Causes in Kuala LumpurNur Fazzillah Muhamed Noordin, Alias Abdullah & Muhammad Nur AzraeiShahbudinUrban Housing Development: Town Planning IssuesIbrahim Mohd @ Ahmad, Ezrin Arbi & Ahmad RamlySustainable City Planning: Emphasis on The Management <strong>of</strong> Environmentally SensitiveAreasHalimaton Saadiah Hashim, Joy Jacqueline Pereira & Ibrahim KomooThe Environment Component in Sustainability Assessment at The Local Level PlanAbdul Hadi Harman Shah, Shaharudin Idrus & Abdul Samad HadiDeveloping a Communicative Planning Approach to Resolve Land Use Conflicts inelutong Area <strong>of</strong> eorgetown, Penang, MalaysiaMohammad Abdul Mohit & Raja Mohd. Firdous B. R.M. HarunKomuniti Mapan: Penilaian Tahap Kemapanan Komuniti Orang Asli Temiar Di PerakKhairul Hisyam B. Kamarudin & Ibrahim B. Ngah© 2012 by MIP 152
PLANNING MALAYSIAJournal <strong>of</strong> the Malaysia <strong>Institute</strong> <strong>of</strong> <strong>Planners</strong> (2012)Book Review: “The Boulevard Book”Shu Charng YenVolume 6, 2008:Safe City Programme: Are we on the right path to reduce crime?Kamalruddin bin ShamsudinThe Contribution <strong>of</strong> Fiqh al-Jinayat (Islamic Criminal Law) To The Planning <strong>of</strong> A SafeCityAzila Ahmad Sarkawi, Ahmad Basri Ibrahim & Alias AbdullahUrban Crime and Safe Neighbourhood: Community PerspectivesKhairiah TalhaTowards A Safe Place for Children in Today’s Residential NeighbourhoodsHalimaton Saadiah Hashim, Joy Jacqueline Pereira & Ibrahim KomooRole <strong>of</strong> Land Use Planning in Improving Public Health: Way Forward For MalaysiaAinul Jaria MaidinEnergy Consumption and Carbon Dioxide Emission Considerations in The UrbanPlanning Process in MalaysiaWee Kean Fong, Hiroshi Matsumoto, Chin Siong Ho & Yu Fat LunVolume 7, 2009:Urbanization, Environmental Planning and Management: A Challenge for JamaicaLeiska J. PowellStructural Changes <strong>of</strong> The <strong>Malaysian</strong> Economy and Its Spatial Incidence on RegionalEconomic GrowthMohammad Abdul MohitUrban Sustainability and Growth Management in South-East Asian City-Regions: Thecase <strong>of</strong> Kuala Lumpur and Hong KongSuharto Teriman, Tan Yigitcanlar, Severine MayereUrban Sprawl in Malaysia: Evidences From Three Largest Metropolitan AreasJamalunlaili, Mohd. Zulhafidz Yahaya, Mohd Zuwairi Mod Yunus & Mohd Shakir MdAli SafudinAn Integrated Approach for The Prediction <strong>of</strong> Water uality Index Based on Land UseAttributes Using Data Generation Method and Back Propagation Network AlgorithmFaris Gorashi & Alias AbdullahGroundwater Extraction Modeling for Kuala Lumpur Water Resource PlanningPieter E. StekPower <strong>of</strong> The Local Authority in Regulating Land Planning and Development Control:Whither ControlAinul Jaria Maidin & Bashiran Begum Mobarak AliAustralia Planning Report Card – Telling It Like It IsLiz de ChasterlVolume 8, 2010:Vehicle Ownership andPeninsular Malaysiauality <strong>of</strong> Life in Urban Residential Neighbourhoods, Northern153© 2012 by MIP
The Past IssuesAbdul Ghapar Othman & Hassim MatAnalysis <strong>of</strong> Commute Characteristics and Residential Location Choice <strong>of</strong> IIUMGombak Campus Employees <strong>of</strong> Malaysia.Mohammad Abdul Mohit & Mootaz Munjid MustafaThe Relationship between Urban Population Density and Transportation FuelConsumption in <strong>Malaysian</strong> CitiesNeoh Siew Yin & Ho Chin SiongThe Socio-technical Factors in the Use <strong>of</strong> GIS at the Planning Departments <strong>of</strong> the KualaLumpur City HallMohd Ramzi Mohd HussainBook Review: Handbook <strong>of</strong> Research on E-Planning: ICTs for Urban Development andMonitoring, Carlos Nunes Silva (Eds.) IGI Global Publishing Company, Hershey,Pennsylvania, USA (2 1 ). 454 pages. ISBN-13: 1 152 2 3.Alias Abdullah & Carlos Nunis SilvaVolume 9, 2011:City Development Strategies (CDS) Contribution Toward Sustainable UrbanDevelopment in Developing CountriesS. Mostafa Rasoolimanesh, Nurwati Badarulzaman & Mastura JaafarUrban Residents’ Attitude Toward Wildlife in Their Neighbourhoods: The Case Study<strong>of</strong> Klang Valley, MalaysiaNik Hanita Nik MohamadEvaluating Stakeholders’ Preferences: Reconciling Heritage And Sustainability InKuala Lumpur Traditional AreaNoor Amila Wan Abdullah Zawawi & Alias AbdullahSolid Waste Generation Characteristics: The Malaysia Local Authorities’ OutlookMuhammad Abu Eusuf, Mansor Ibrahim, Shamzani Affendy Mohd. Din & Rafikul IslamUrban Air Environmental Health Indicators: A Preliminary Set for City <strong>of</strong> KualaLumpurOliver Ling Hoon Leh, Shaharuddin Ahmad Kadaruddin Aiyub & Yaakob Mohd. JaniClassification <strong>of</strong> Satellite Fused Data for Land Use Mapping in Development PlanNorzailawati Mohd Noor, Alias Abdullah & Mazlan HashimSpecial Issue, 2011:Conservation with Development: Showcasing Langkawi Geopark - An IntroductionHalimaton Saadiah Hashim & Rahimah Abdul AzizGeopark for Heritage Conservation: A Need for Integrated Planning and ManagementRahimah Abdul Aziz, Halimaton Saadiah Hashim, & Ibrahim KomooImplementing Langkawi Geopark Through Land Use PlanningNoor Yazan Zainol, Hapiz Abd Manap, Ibrahim Yacob, Mahani Muhammad, MariamTajuddin & Ikhwan Mohd SaidThe Importance <strong>of</strong> Geological Heritage Resources in Land Use Planning: ExperienceFrom Langkawi GeoparkChe Aziz Ali & Tanot UnjahLand Use Planning Statutes for Langkawi Geopark Conservation and DevelopmentSarah Aziz, Halimaton Saadiah Hashim, Rahimah Abdul Aziz, Chan K. L. Geraldine &Tanot Unjah© 2012 by MIP 154
PLANNING MALAYSIAJournal <strong>of</strong> the Malaysia <strong>Institute</strong> <strong>of</strong> <strong>Planners</strong> (2012)Potential Biosites <strong>of</strong> Significant Importance in Langkawi Geopark: TerrestrialVertebrate FaunaNorhayati, A., Chan, K.O., Daicus, B., Samat, A.,Grismer, L.L, & Mohd Izzuddin, A.Planning for Heritage Tourism: The Case <strong>of</strong> Langkawi GeoparkOng Puay Liu & Sharina Abd HalimPlace Making, Place Names, and Local Myths and LegendsRahimah Abdul Aziz & Ong Puay LiuIntroducing Networks in Planning: An Example from LangkawiChan K. L. Geraldine, Halimaton Saadiah Hashim & Sarah AzizParticipation Towards Heritage Conservation: Case <strong>of</strong> a Fishing Community inLangkawi GeoparkSharina Abdul Halim, Ong Puay Liu, Nurhafizah Yuss<strong>of</strong> & Lim Choun SianCOPYRIGHT OF THE JOURNALThe copyright <strong>of</strong> all articles in PLANNING MALAYSIA JOURNAL is vestedwith the <strong>Malaysian</strong> <strong>Institute</strong> <strong>of</strong> <strong>Planners</strong> (MIP). The copyright covers theexclusive use <strong>of</strong> rights to reproduce and distribute the article, including reprints,photographic reproductions, micr<strong>of</strong>ilm or any reproduction <strong>of</strong> a similar natureand translations. Permission to publish illustrations must be obtained by theauthor before submission. Any acknowledgements should be included in thefigure captions.DISCLAIMERStatements, opinions and findings expressed and described in articles publishedin this journal are solely the responsibility <strong>of</strong> the individual authors, and do notimply the endorsement <strong>of</strong> PLANNING MALAYSIA JOURNAL or the<strong>Malaysian</strong> <strong>Institute</strong> <strong>of</strong> <strong>Planners</strong> (MIP).You can get the Journal by contacting:The President<strong>Malaysian</strong> <strong>Institute</strong> <strong>of</strong> <strong>Planners</strong> (MIP)B-01-02, Jalan SS7/13B, Aman Seri, Kelana Jaya,47301, Petaling Jaya, Selangor Darul Ehsan, MALAYSIATel: +603 78770637 Fax: +603 78779636Email: mip@mip.org.my or pmjournal@gmail.comHomepage: http://www.mip.org.my155© 2012 by MIP