Lighting and Color Introduction Lighting Science - Illuminating ...
Lighting and Color Introduction Lighting Science - Illuminating ...
Lighting and Color Introduction Lighting Science - Illuminating ...
You also want an ePaper? Increase the reach of your titles
YUMPU automatically turns print PDFs into web optimized ePapers that Google loves.
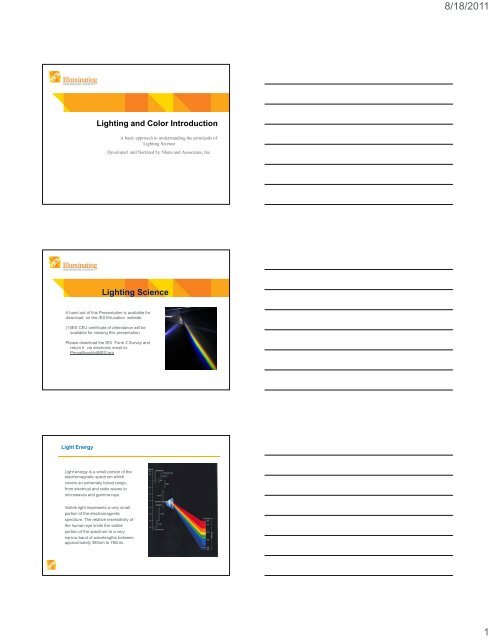
8/18/2011Light <strong>and</strong> <strong>Color</strong> Perception•Typically characterized as Red, Green <strong>and</strong> Blue receptors, itwould be far more accurate to describe observer sensitivity asshort , medium <strong>and</strong> long wavelength responses.Natural Light SourcesSunlightBioluminescenceReflected SunlightPhosphorescenceCommon Light SourcesDaylightInc<strong>and</strong>escentLEDHorizon DaylightFluorescentHID3
8/18/2011Common Light Sources LEDMetamerismSamples or Objects appear to match under daylight viewingconditions but do not match under other lighting conditions.Visible Light EnergySir Isaac Newton 1600sParticle TheoryChristian Huygens 1670Wave TheoryMaxell <strong>and</strong> Hertz 1800sElectromagnetic Waves4
8/18/2011Light EnergyWhite light is dispersed into itscomponent colors by refraction.The angle of deviation varies withwavelength.Visible Spectrum<strong>Color</strong> ModelsbluegreenredAdditive Principals (Light)5
8/18/2011<strong>Color</strong> ModelsmagentayellowcyanSubtractive Principals(Dyes <strong>and</strong> Pigments)CIE INTERNATIONAL COMMISSION ON ILLUMINATIONThe International Commission on Illumination - abbreviated as CIE from itsFrench title Commission Internationale de l’Eclairage - is an organizationdevoted to international cooperation <strong>and</strong> exchange of information among itsmember countries on all matters related to the science <strong>and</strong> art of lighting. TheCIE is an autonomous organization. It is not appointed by any otherorganization political or otherwise but has grown out of the interests ofindividuals working in illumination. Since its inception, the CIE has beenaccepted as representing the best authority on the subject <strong>and</strong> as such isrecognized by the ISO as an international st<strong>and</strong>ardization body.www.cie.co.atAccomplishments of the CIE• St<strong>and</strong>ard observer• CIE chromaticity diagrams• Chromaticity coordinates• Calculation of Tristimulus values• Method for calculating l Correlated<strong>Color</strong>Temperature• Development of <strong>Color</strong> MatchingFunctions• Definition of St<strong>and</strong>ard Illuminants6
8/18/2011Correlated <strong>Color</strong> Temperature CCT• The concept of color temperature is extended to includesources which emit light that may be close to the CCTLocus - but not an exact match to a perfect radiator.• The expression correlated color temperature is used todescribe the light from such sources.• CCT is not totally accurate for characterizing light sourceswhich have narrow-b<strong>and</strong> spectral emittance curves <strong>and</strong>that do not match the blackbody curve such as a LED,CFL, HID or Linear Fluorescent sources.<strong>Color</strong> Temperature20000KBlue Northwest SkyBlue Sky with Thin White CloudsBlue Sky10000K7500K high CRIfluorescentsShort-arc Xenon7000K6000KNorth SkyOvercast North Sky5000K high CRIfluorescentsCW & CWXWW & WWXHPS5000K4000K3000K2000KNoon SunDeluxe MercuryInc<strong>and</strong>escentC<strong>and</strong>le FlameSpectral Sensitivity Corresponding to Human Eyey()= Sensitivity of humaneye to brightnessThe wavelength range visible to the human eye is 380nm to 780nm.Spectral sensitivity is specified as the average visual perception ofnumerous people with normal vision as determined by CIE. As a result,there are some differences from actual individuals, depending on theperson, race, age <strong>and</strong> whether a sample is viewed in a bright or darklocation.The Peak wavelength for brightness, y() is 555nm.8
8/18/2011<strong>Color</strong> Matching FunctionsThe “St<strong>and</strong>ard Observer”was adopted to represent howthe average person with normalcolor vision can see color.The color matching functionsx, y, z of the 1931 CIE st<strong>and</strong>ardobserver <strong>and</strong> x10, y10, z10 of the1964 CIE supplementary st<strong>and</strong>ardobserver are compared here(data from CIE 1974). Thesesets of Tristimulus valuesof the spectrum color, definingthe 1931 CIE st<strong>and</strong>ard observer<strong>and</strong> the 1964 CIE supplementaryst<strong>and</strong>ard observer, respectively,in terms of the same X, Y <strong>and</strong> Zprimaries are a little different.Most significantly, y10 is notthe same as y or V().CIE St<strong>and</strong>ard Luminosity FunctionDefined by CIE Publication 15.2,the spectral response curve ofthe average human eye undernormal daylight vision is called“Photopic Response Curve” orgenerally known as CIESt<strong>and</strong>ard Luminosity Function.It is represented as V().ScotopicPhotopic<strong>Color</strong> DifferenceJND, JPD <strong>and</strong> MPCDThe just-noticeable difference (JND) is used to denote theminimum perceptible difference between two closely spacedcolors. This difference may vary considerably betweendifferent regions on the 1931 CIE Chromaticity Chart.Plotting distances of 10 JNDS, forexample, at various points on achromaticity chart will result in aseries of different size ellipses knownas MacAdam ellipses.9
8/18/2011Tristimulus <strong>Color</strong>imetry1976 CIE-UCS Chromaticity Chart• The UCS (Uniform Chromaticity Scale) was developed tominimize the limitations of the 1931 system.• The 1976 CIE-UCS chart usesu’ <strong>and</strong> v’ coordinates. Thesymbols u’ <strong>and</strong> v’ were chosento differentiate from the u <strong>and</strong> vcoordinates of the similar butshort lived 1960 CIE-UCSsystem.CIE 1976 Uniform <strong>Color</strong> Space<strong>Color</strong> DifferenceJND, JPD <strong>and</strong> MPCDThe color differences vary to a much lesser degree on the 1976 CIE-UCS Chart. Typically, a difference in the distance between any twosets of color coordinates in either system will be 1 JND. Justnoticeable difference (JND), is defined as the smallestdetectable difference between two colors.The just-perceptible difference(JPD) <strong>and</strong>, earlier, the minimumperceptible color difference(MPCD) have also been used forthe same purpose.CIE 1976 Uniform <strong>Color</strong> SpaceA transformation of the xy color systemprovides color differences with thesame value appear to have the samedegree of color difference perceptually,regardless of the color. It is alsoreferred to as the "UniformChromaticity Scale" diagram.However, even with this system,numerical differences do not alwayscorrespond exactly with perceptualdifferences.u' = 4X/(X+15Y+3Z)v' = 9Y/(X+15Y+3Z)10
8/18/2011<strong>Color</strong> Difference<strong>Color</strong> differences <strong>and</strong> tolerances or u’v’ are expressed asa circle on the 1976 CIE UCS color diagram.u’v’ = [ (u’ S –u’ T ) 2 + (v’ S –v’ T ) 2 ] 1/2<strong>Color</strong> Differenceu’v’<strong>Color</strong> Tolerancex,yCIE St<strong>and</strong>ard IlluminantsNameCIE 1931 2° CIE 1964 10°x 2 y 2 x 10 y 10CCT(K)NoteA 0.44757 0.40745 0.45117 0.40594 2856 Inc<strong>and</strong>escent / TungstenB 0.34842 0.35161 0.34980 0.35270 4874 {obsolete} Direct sunlight at noonC 0.31006 0.31616 0.31039 0.31905 6774 {obsolete} Average / North sky DaylightD50 0.34567 0.35850 0.34773 0.35952 5003 Horizon Light. ICC profile PCSD55 0.33242 0.34743 0.33411 0.34877 5503 Mid-morning / Mid-afternoon DaylightD65 0.31271 0.32902 0.31382 0.33100 6504 Noon Daylight: Television sRGB color spaceD75 0.29902 0.31485 0.29968 0.31740 7504 North sky DaylightE 1/3 1/3 1/3 1/3 5454 Equal energyF1 0.31310 0.33727 0.31811 0.33559 6430 Daylight FluorescentF2 0.37208 0.37529 0.37925 0.36733 4230 Cool White FluorescentF3 0.40910 0.39430 0.41761 0.38324 3450 White FluorescentF4 0.44018 0.40329 0.44920 0.39074 2940 Warm White FluorescentF5 0.31379 0.34531 0.31975 0.34246 6350 Daylight FluorescentF6 0.37790 0.38835 0.38660 0.37847 4150 Lite White FluorescentF7 0.31292 0.32933 0.31569 0.32960 6500 D65simulator, Daylight simulatorF8 0.34588 0.35875 0.34902 0.35939 5000 D50 simulator, Sylvania F40 Design 50F9 0.37417 0.37281 0.37829 0.37045 4150 Cool White Deluxe FluorescentF10 0.34609 0.35986 0.35090 0.35444 5000 Philips TL85, Ultralume 50F11 0.38052 0.37713 0.38541 0.37123 4000 Philips TL84, Ultralume 40F12 0.43695 0.40441 0.44256 0.39717 3000 Philips TL83, Ultralume 30RadiometryRadiometry is the science <strong>and</strong> measurement of energy orelectromagnetic radiation. It is the measurement of thephysical properties of light energy <strong>and</strong> may include ultraviolet,infrared energy or specific wavelengths.11
8/18/2011PhotometryPhotometry involves the physical measurement of visible lightenergy <strong>and</strong> attempts to compensate for the psychophysicalattributes of the human response <strong>and</strong> physical units of power.Photometry is just like radiometry except that everything isweighted by the spectral response ( luminosity) of the humaneye as defined by the CIE.PhotometryThe photometric quantity, Luminance, is derived from thecorresponding radiometric quantity, Radiance, <strong>and</strong> the CIESt<strong>and</strong>ard Luminosity Function. We can think of the luminosityfunction as the transfer function of filters which approximatethe sensitivity of the human eye.Radiometric CIE St<strong>and</strong>ard Luminosity PhotometricQuantityFunction (V )QuantityExample:Illuminance: 500lxLuminance: 15cd/m 2Relationship between radiometric units <strong>and</strong> photometric unitsComing soon to a theater near youMany systems <strong>and</strong> methods have been devised to quantify light sources so thatcommunication of color would become easier <strong>and</strong> more accurate. Thesemethods attempt to provide a way of expressing a light sources color <strong>and</strong> energyoutput <strong>and</strong> tolerances numerically, in the same way we express length <strong>and</strong>weight. In some of our follow up presentations we will discuss some of thesemetrics in more detail. Some of these topics will include:• <strong>Color</strong> <strong>Science</strong>•<strong>Lighting</strong> Measurements <strong>and</strong> Metrics• <strong>Color</strong>imetry versus Spectroradiometry• Use of Instruments• Underst<strong>and</strong>ing <strong>Lighting</strong> Values Luminance / Illuminance• Spectral Power Distribution SPD• Comparing Light Sources• <strong>Color</strong> Rendering Index CRI <strong>and</strong> CQS•CIE Method for Assessment of Daylight• LM 79, LM80 <strong>and</strong> Energy Star RequirementsAnd much more!12
8/18/2011Thank You!<strong>Illuminating</strong> Engineering Society of North America120 Wall Street, 17th floorNew York, NY 10005212-248-5000www.ies.org13


