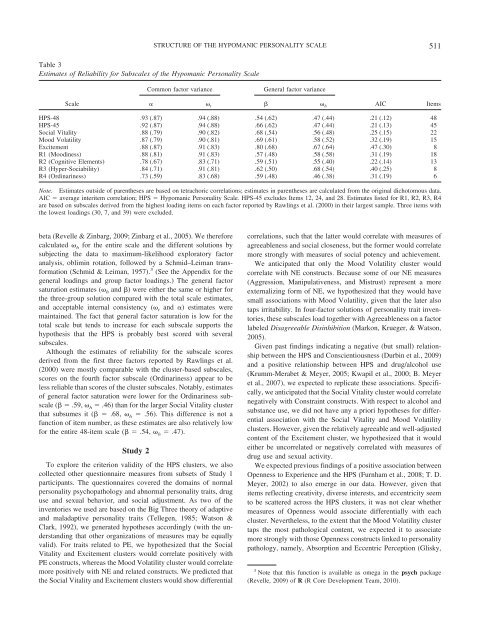
STRUCTURE OF THE HYPOMANIC PERSONALITY SCALE511Table 3Estimates <strong>of</strong> Reliability for Subscales <strong>of</strong> <strong>the</strong> <strong>Hypomanic</strong> <strong>Personality</strong> <strong>Scale</strong>Common factor varianceGeneral factor variance<strong>Scale</strong> t hAICItemsHPS-48 .93 (.87) .94 (.88) .54 (.62) .47 (.44) .21 (.12) 48HPS-45 .92 (.87) .94 (.88) .66 (.62) .47 (.44) .21 (.13) 45Social Vitality .88 (.79) .90 (.82) .68 (.54) .56 (.48) .25 (.15) 22Mood Volatility .87 (.79) .90 (.81) .69 (.61) .58 (.52) .32 (.19) 15Excitement .88 (.87) .91 (.83) .80 (.68) .67 (.64) .47 (.30) 8R1 (Moodiness) .88 (.81) .91 (.83) .57 (.48) .58 (.58) .31 (.19) 18R2 (Cognitive Elements) .78 (.67) .83 (.71) .59 (.51) .55 (.40) .22 (.14) 13R3 (Hyper-Sociability) .84 (.71) .91 (.81) .62 (.50) .68 (.54) .40 (.25) 8R4 (Ordinariness) .73 (.59) .83 (.68) .59 (.48) .46 (.38) .31 (.19) 6Note. Estimates outside <strong>of</strong> paren<strong>the</strong>ses are based on tetrachoric correlations; estimates in paren<strong>the</strong>ses are calculated from <strong>the</strong> original dichotomous data.AIC average interitem correlation; HPS <strong>Hypomanic</strong> <strong>Personality</strong> <strong>Scale</strong>. HPS-45 excludes Items 12, 24, and 28. Estimates listed for R1, R2, R3, R4are based on subscales derived from <strong>the</strong> highest loading items on each factor reported by Rawlings et al. (2000) in <strong>the</strong>ir largest sample. Three items with<strong>the</strong> lowest loadings (30, 7, and 39) were excluded.beta (Revelle & Zinbarg, 2009; Zinbarg et al., 2005). We <strong>the</strong>reforecalculated h for <strong>the</strong> entire scale and <strong>the</strong> different solutions bysubjecting <strong>the</strong> data to maximum-likelihood exploratory factoranalysis, oblimin rotation, followed by a Schmid–Leiman transformation(Schmid & Leiman, 1957). 3 (See <strong>the</strong> Appendix for <strong>the</strong>general loadings and group factor loadings.) The general factorsaturation estimates ( h and ) were ei<strong>the</strong>r <strong>the</strong> same or higher for<strong>the</strong> three-group solution compared with <strong>the</strong> total scale estimates,and acceptable internal consistency ( t and ) estimates weremaintained. The fact that general factor saturation is low for <strong>the</strong>total scale but tends to increase for each subscale supports <strong>the</strong>hypo<strong>the</strong>sis that <strong>the</strong> HPS is probably best scored with severalsubscales.Although <strong>the</strong> estimates <strong>of</strong> reliability for <strong>the</strong> subscale scoresderived from <strong>the</strong> first three factors reported by Rawlings et al.(2000) were mostly comparable with <strong>the</strong> cluster-based subscales,scores on <strong>the</strong> fourth factor subscale (Ordinariness) appear to beless reliable than scores <strong>of</strong> <strong>the</strong> cluster subscales. Notably, estimates<strong>of</strong> general factor saturation were lower for <strong>the</strong> Ordinariness subscale( .59, h .46) than for <strong>the</strong> larger Social Vitality clusterthat subsumes it ( .68, h .56). This difference is not afunction <strong>of</strong> item number, as <strong>the</strong>se estimates are also relatively lowfor <strong>the</strong> entire 48-item scale ( .54, h .47).Study 2To explore <strong>the</strong> criterion validity <strong>of</strong> <strong>the</strong> HPS clusters, we alsocollected o<strong>the</strong>r questionnaire measures from subsets <strong>of</strong> Study 1participants. The questionnaires covered <strong>the</strong> domains <strong>of</strong> normalpersonality psychopathology and abnormal personality traits, druguse and sexual behavior, and social adjustment. As two <strong>of</strong> <strong>the</strong>inventories we used are based on <strong>the</strong> Big Three <strong>the</strong>ory <strong>of</strong> adaptiveand maladaptive personality traits (Tellegen, 1985; Watson &Clark, 1992), we generated hypo<strong>the</strong>ses accordingly (with <strong>the</strong> understandingthat o<strong>the</strong>r organizations <strong>of</strong> measures may be equallyvalid). For traits related to PE, we hypo<strong>the</strong>sized that <strong>the</strong> SocialVitality and Excitement clusters would correlate positively withPE constructs, whereas <strong>the</strong> Mood Volatility cluster would correlatemore positively with NE and related constructs. We predicted that<strong>the</strong> Social Vitality and Excitement clusters would show differentialcorrelations, such that <strong>the</strong> latter would correlate with measures <strong>of</strong>agreeableness and social closeness, but <strong>the</strong> former would correlatemore strongly with measures <strong>of</strong> social potency and achievement.We anticipated that only <strong>the</strong> Mood Volatility cluster wouldcorrelate with NE constructs. Because some <strong>of</strong> our NE measures(Aggression, Manipulativeness, and Mistrust) represent a moreexternalizing form <strong>of</strong> NE, we hypo<strong>the</strong>sized that <strong>the</strong>y would havesmall associations with Mood Volatility, given that <strong>the</strong> later alsotaps irritability. In four-factor solutions <strong>of</strong> personality trait inventories,<strong>the</strong>se subscales load toge<strong>the</strong>r with Agreeableness on a factorlabeled Disagreeable Disinhibition (Markon, Krueger, & Watson,2005).Given past findings indicating a negative (but small) relationshipbetween <strong>the</strong> HPS and Conscientiousness (Durbin et al., 2009)and a positive relationship between HPS and drug/alcohol use(Krumm-Merabet & Meyer, 2005; Kwapil et al., 2000; B. Meyeret al., 2007), we expected to replicate <strong>the</strong>se associations. Specifically,we anticipated that <strong>the</strong> Social Vitality cluster would correlatenegatively with Constraint constructs. With respect to alcohol andsubstance use, we did not have any a priori hypo<strong>the</strong>ses for differentialassociation with <strong>the</strong> Social Vitality and Mood Volatilityclusters. However, given <strong>the</strong> relatively agreeable and well-adjustedcontent <strong>of</strong> <strong>the</strong> Excitement cluster, we hypo<strong>the</strong>sized that it wouldei<strong>the</strong>r be uncorrelated or negatively correlated with measures <strong>of</strong>drug use and sexual activity.We expected previous findings <strong>of</strong> a positive association betweenOpenness to Experience and <strong>the</strong> HPS (Furnham et al., 2008; T. D.Meyer, 2002) to also emerge in our data. However, given thatitems reflecting creativity, diverse interests, and eccentricity seemto be scattered across <strong>the</strong> HPS clusters, it was not clear whe<strong>the</strong>rmeasures <strong>of</strong> Openness would associate differentially with eachcluster. Never<strong>the</strong>less, to <strong>the</strong> extent that <strong>the</strong> Mood Volatility clustertaps <strong>the</strong> most pathological content, we expected it to associatemore strongly with those Openness constructs linked to personalitypathology, namely, Absorption and Eccentric Perception (Glisky,3 Note that this function is available as omega in <strong>the</strong> psych package(Revelle, 2009) <strong>of</strong> R (R Core Development Team, 2010).
512 SCHALET, DURBIN, AND REVELLETataryn, Tobias, Kihlstrom, & McConkey, 1991; Watson, Clark,& Chmielewski, 2008).As <strong>the</strong>re are findings that individuals scoring high on <strong>the</strong> HPShave more contentious relationships (Eckblad & Chapman, 1986),we expected that poorer social adjustment would be associatedwith one or more HPS clusters. Given <strong>the</strong> items on irritability andintensity <strong>of</strong> emotion in <strong>the</strong> Mood Volatility cluster, we hypo<strong>the</strong>sizedthat Mood Volatility would be positively associated withdifficulty in various social settings (such as school and work),whereas Excitement and Social Vitality would not. We suspectedthat Excitement and Social Vitality would likely be related t<strong>of</strong>ewer problems engaging in leisure activities.MethodParticipants. To explore <strong>the</strong> criterion validity <strong>of</strong> <strong>the</strong> HPSclusters, we also collected o<strong>the</strong>r questionnaire measures fromsubsets <strong>of</strong> Study 1 participants. To reduce burden, each participantcompleted only some <strong>of</strong> <strong>the</strong> measures, resulting in different samplesizes for each set <strong>of</strong> measures. These included normal personality(n 315), psychopathology and abnormal personality traits (n 178), drug use and sexual behavior (n 137), and social adjustment(n 203). Participant characteristics (gender, age, andethnicity) <strong>of</strong> <strong>the</strong> subsamples who completed each <strong>of</strong> <strong>the</strong>se batteriesmirrored those in <strong>the</strong> larger sample. None <strong>of</strong> <strong>the</strong> four subsamplesdiffered significantly from <strong>the</strong> larger sample (N 884) on totalHPS, Mood Volatility, or Excitement scores; however, <strong>the</strong> participantsin <strong>the</strong> subsample measuring psychopathology and abnormalpersonality traits (n 178) scored slightly lower on Social Vitality(Cohen’s d .21) compared with <strong>the</strong> larger sample.Measures.HPS. The HPS (Eckblad & Chapman, 1986) measures dispositionalhypomanic characteristics and consists <strong>of</strong> 48 true–falseitems (see Table 1).Normal personality measures. A subset <strong>of</strong> participants (n 315) also completed <strong>the</strong> Big Five Mini-Markers (Saucier, 1994)and <strong>the</strong> <strong>Multidimensional</strong> <strong>Personality</strong> Questionnaire–Brief Form(MPQ-BF; Patrick, Curtin, & Tellegen, 2002). The Mini-Markerstaps extraversion, neuroticism, openness to experience or intelligence,conscientiousness, and agreeableness. Each trait is measuredby eight adjectives that are rated on a 9-point Likert-typescale. Alphas for Mini-Markers scales in our study ranged from .80to .89 (omega total estimates ranged from .88 to .92). TheMPQ-BF is a 155-item true–false questionnaire that assesses threebroad personality dimensions that roughly correspond with extraversion,neuroticism, and conscientiousness: PE, NE, and Constraint.The higher order dimensions are marked by <strong>the</strong> followinglower order scales: Wellbeing, Social Potency, Achievement, andSocial Closeness (PE); Stress Reaction, Alienation, and Aggression(NE); and Control, Harm Avoidance, and Traditionalism(Constraint). The MPQ-BF also includes a subscale labeled Absorption,which taps <strong>the</strong> tendency for imaginative and selfinvolvedexperiences and is conceptually similar to <strong>the</strong> Big Five Odimension. (The Absorption subscale was administered to a largersubset, n 432.) Alphas for <strong>the</strong> MPQ-BF subscales ranged from.74 to .86 (Mdn .82), and omega total estimates ranged from .77to .88 (Mdn .85).Maladaptive personality. We asked 178 participants to complete<strong>the</strong> Schedule for Nonadaptive and Adaptive <strong>Personality</strong>Self-Description Rating Form (SNAP-SRF; Harlan & Clark,1999), a measure <strong>of</strong> normal and abnormal personality traits relevantto personality disorders. The SNAP-SRF includes 33 paragraphdescriptors describing individuals who are low versus highon <strong>the</strong> characteristic <strong>of</strong> interest; each item is rated on a 6-pointscale. It assesses three higher order dimensions, Negative Temperament,Positive Temperament, and Disinhibition, marked by 15subordinate scales. Each scale contains two or three items, with <strong>the</strong>exception <strong>of</strong> Eccentric Perceptions, which has only one item. Thescales are Mistrust ( .57), Manipulativeness ( .55), Aggression( .40), Self-Harm ( .21), Eccentric Perceptions,Dependency (.34), Exhibitionism (.81), Entitlement (.43), Detachment (.53), Impulsivity (.43), Propriety (.33), Workaholism ( .43), Negative Temperament ( .62),Positive Temperament ( .63), and Disinhibition ( .67).With <strong>the</strong> exception <strong>of</strong> Self-Harm and Dependency, alphas from oursample are similar to those reported by Harlan and Clark (1999).Psychopathology measures. We had 178 participants complete<strong>the</strong> Inventory to Diagnose Depression, a 25-item measure <strong>of</strong>current depression symptoms (Zimmerman, Coryell, Corenthal, &Wilson, 1986). We did not administer <strong>the</strong> suicide item and excludedItems 23 (timing <strong>of</strong> depression symptoms) and 25 (similarityto grief) from analyses. The remaining 22 items had an alpha<strong>of</strong> .79 ( t .82). We had 178 participants complete <strong>the</strong> BeckAnxiety Inventory (Beck, Epstein, Brown, & Steer, 1988), a 21-item measure <strong>of</strong> anxiety symptoms ( .82, t .85), and 100participants completed <strong>the</strong> Penn State Worry Questionnaire (T. J.Meyer, Miller, Metzger, & Borkevec, 1990), a 16-item measure <strong>of</strong>excessive worry ( .94, t .95). Both <strong>the</strong> Penn State WorryQuestionnaire and <strong>the</strong> Inventory to Diagnose Depression items (21out <strong>of</strong> 22) use a 5-point scale <strong>of</strong> severity. The Beck AnxietyInventory uses a 4-point scale for all items.Drug use and sexual activity. To assess behavioral indicators<strong>of</strong> externalizing psychopathology, we administered nine self-reportitems tapping drug use (five items) and risky sexual behavior (fouritems) to 137 participants. The drug questions included <strong>the</strong> following:(a) maximum number <strong>of</strong> drinks participant had consumedin a 24-hr period, (b) lifetime number <strong>of</strong> intoxications, (c) number<strong>of</strong> times <strong>the</strong>y had driven drunk or high, (d) lifetime number <strong>of</strong>times <strong>the</strong>y had used marijuana, and (e) total number <strong>of</strong> differentdrug classes used. Although we also assessed legal problemsinvolving drugs, we eliminated <strong>the</strong> variable from analysis because<strong>of</strong> a low endorsement rate. The sexual behavior questions included<strong>the</strong> following: (a) number <strong>of</strong> lifetime oral sexual partners, (b) totalnumber <strong>of</strong> lifetime vaginal/anal sexual partners, (c) number <strong>of</strong>times participant had unprotected sex, and (d) number <strong>of</strong> timesparticipant had sex while drunk or high. These items are commonmeasures <strong>of</strong> sexual risk taking that have been linked to <strong>the</strong> personalitytrait <strong>of</strong> Constraint (Hoyle, Fejfar, & Miller, 2000). Notsurprisingly, all <strong>of</strong> <strong>the</strong> variables were skewed. Because quantitativedifferences in <strong>the</strong>se answers can be misleading (i.e., <strong>the</strong>difference between 0 and 2 times having unprotected sex is moremeaningful than <strong>the</strong> difference between 40 and 42 times), wegrouped answers for <strong>the</strong> variables (with <strong>the</strong> exception <strong>of</strong> number <strong>of</strong>drug classes used) into four response categories (abstinent, a fewtimes, occasionally, more than occasionally). The resulting ninevariables were moderately intercorrelated (average r .54, range.25–.79, ps .05). The average interitem correlation was slightlyhigher within each content group (r .63 for drug use, r .62 for
- Page 1 and 2: Psychological Assessment© 2011 Ame
- Page 3 and 4: 506 SCHALET, DURBIN, AND REVELLETab
- Page 5 and 6: 508 SCHALET, DURBIN, AND REVELLEite
- Page 7: 510 SCHALET, DURBIN, AND REVELLETab
- Page 11 and 12: 514 SCHALET, DURBIN, AND REVELLETab
- Page 13 and 14: 516 SCHALET, DURBIN, AND REVELLEp
- Page 15 and 16: 518 SCHALET, DURBIN, AND REVELLESoc
- Page 17 and 18: 520 SCHALET, DURBIN, AND REVELLECli
- Page 19: 522 SCHALET, DURBIN, AND REVELLEApp