Vol 24, No 1, March 2011 - Enable
Vol 24, No 1, March 2011 - Enable
Vol 24, No 1, March 2011 - Enable

You also want an ePaper? Increase the reach of your titles
YUMPU automatically turns print PDFs into web optimized ePapers that Google loves.
‘La Niña – How AreAustralia’s RegionsFaring – From DroughtTo Flood’By Roger Stone,University of Southern QueenslandLa Niña – What Exactly Is It AndHow Does It Work?Who knew Australia has the highest year-to-year climatevariability on earth? <strong>No</strong> wonder much of Australia lurches fromdrought to flood – then back again. El Niño and La Niña aremostly to blame for this – but, then again, who has heard of LaNiña before? Many of us have heard of the opposite pattern –‘El Niño – mainly because the El Niño climate pattern has beenthe main underlying cause of Australia’s droughts over the past10 to 30 years and for many of our droughts in history.While ‘El Niño’ translates from the Spanish for ‘the boy-child’,La Niña translates from the Spanish for ‘the girl child’ – butwhy the Spanish names? It’s because these climate patterns tendto originate or were initially known to have a lot of their mainimpacts over in South American countries located on or nearthe Equator. However, these days we know these impacts canspread globally, including, of course, to Australia.What Does A La Niña ActuallyLook Like?A La Niña really is a massive cooling of the sea water in thecentral and eastern Pacific Ocean in equatorial regions fromjust west of the International Dateline, often right across tothe South American coast. You can look at satellite imagesof the sea-surface temperature patterns of La Niña on manyinternational web-sites (for example, STUDENT ACTIVITIES1. Describe the difference between the two maps showing seasurface temperatures.2. Describe the differences in temperature between the waters off theSouth American coastline and the seas surrounding Cape York.3. Estimate by how much temperatures were cooler than normal orwarmer than normal for the 7 days centred on December 29 2010at approximately 0˚, 170˚ W and 15˚ S, 165˚ E,At the same time, around the Australian and Indonesian coasts,sea temperatures can become much warmer than normal byabout two or more degrees Celsius. It is this contrast in seatemperature that interacts with the atmosphere above andthen results in the big shifts in rainfall (and temperature) overAustralia and in many other world regions – as we have indeedwitnessed during 2010/11.Interestingly, because of the strong easterly winds thataccompany these sea-surface temperatures during a La Niña, thesea level along the Australian coast may rise more than 20cmabove normal with associated increased concerns regardingbeach erosion, storm surges and coastal inundation, especiallywith the more frequent tropical cyclones that can then alsoaccompany La Niña.You can actually track the progress of a La Niña as it starts todevelop around May–June–July and then also often subsidesaround the following southern hemisphere autumn. Trackingthese patterns very carefully may give you some warningof the next La Niña or the break-down of this most recentdevastating La Niña.What About The SouthernOscillation Index (Soi) – How DoesThat Provide An Index Of La Niña?If you were to measure the air pressure just above the surfaceof the ocean (just using a simple barometer) and comparevalues in the eastern equatorial Pacific with those in the westernequatorial Pacific you would notice a see-saw in pressurevalues operating ‘hand-in-glove’ with changes in sea-surfacetemperatures and also with the strength and direction of thewinds just above the sea surface.This see-saw in pressure values is known as the SouthernOscillation. The Southern Oscillation Index or SOI gives us auseful measure of its strength so that a consistently stronglypositive value of the SOI (above about +8.0) generally coincideswith a La Niña pattern – and which occurred in 2010/11 – withsharply rising SOI values often occurring before-hand duringautumn or winter. Knowing this can form a useful forecastingtool if you want to track for yourself the beginning stages ofthese dramatic climate patterns. Table 1 gives you a completerecord of monthly SOI values since 1950.STUDENT ACTIVITIES4. Why would warmer sea temperatures result in wetter seasons?5. What is the basic physics behind sea temperatures and sea level rise?6. Why do strongly positive SOI readings in autumn and winterindicate a wetter austral summer in Queensland?7. Use two coloured highlighter pens to identify the La Nina and ElNino seasons, remembering that these temperature oscillations donot occur over the entire calendar year.8. Which years had the most marked El Nino and La Nina events?~ 2 ~
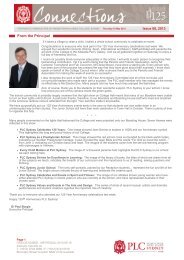
Figure 1: Recent sea-surface temperatures across the equatorial Pacific Ocean associated with the La Nina pattern. The toppicture shows the sea-surface temperatures while the lower picture shows the sea-surface temperature anomalies– how much the sea temperatures varied from normal. <strong>No</strong>te the warmer than normal temperatures off the northernand eastern Australian coast (shaded orange) contrasting with the cooler than normal temperatures off the SouthAmerican Coast and along the Equator (shaded blue).Source: Image courtesy CPC/NOAA~ 3 ~
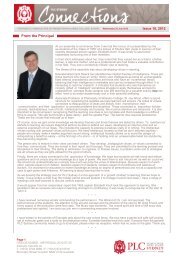
Table 1: Monthly Southern Oscillation Index (SOI) data since 1950.<strong>No</strong>te years such as 2010, 2008, 1998, 1988, 1973/74/75, 1954/55/56 – note the need to refer to months from Juneto May rather than the calendar year – there periods have been classified as La Niña periods. These years havemostly continuing strongly positive values of the SOI. Conversely, note years such as 1982/83, 1997/98, 2002/03,and 1977/78 that have been classified as El Nino years (there are many others – see if you can identify them) andassociated continuing strongly negative values of the SOI.Year Jan Feb Mar Apr May Jun Jul Aug Sep Oct <strong>No</strong>v Dec1950 5.1 17.6 17.6 16.8 7.6 26.9 21.1 12.3 6.9 17.1 12.5 23.01951 16.5 9.6 -1.4 -1.3 -6.6 5.0 -8.2 -0.5 -7.0 -8.0 -3.4 -3.01952 -9.2 -7.9 0.2 -8.8 6.0 7.4 3.5 -3.7 -3.4 1.8 -0.7 -12.61953 2.2 -6.0 -5.8 -0.5 -31.9 -2.3 -1.0 -17.2 -13.0 -0.1 -2.0 -4.01954 6.0 -3.6 -0.9 6.9 4.4 -1.5 4.2 10.4 4.5 1.8 3.9 12.81955 -5.4 15.2 2.9 -3.0 13.1 16.4 19.2 14.9 14.1 15.2 15.1 9.31956 11.3 12.4 9.4 11.1 17.9 12.3 12.6 11.0 0.2 18.3 1.9 10.31957 5.6 -2.2 -0.9 1.2 -12.2 -2.3 0.9 -9.5 -10.6 -1.3 -11.9 -3.51958 -16.8 -6.9 -1.4 1.2 -8.2 0.2 2.2 7.8 -3.4 -1.9 -4.7 -6.51959 -8.7 -14.0 8.4 3.6 2.8 -6.3 -5.0 -5.0 0.2 4.2 11.1 8.2Year Jan Feb Mar Apr May Jun Jul Aug Sep Oct <strong>No</strong>v Dec1960 0.3 -2.2 5.6 7.8 5.2 -2.3 4.8 6.6 6.9 -0.7 7.2 6.71961 -2.5 6.3 -20.9 9.4 1.3 -3.1 2.2 0.1 0.8 -5.0 7.2 13.81962 17.0 5.3 -1.4 1.2 12.3 5.0 -0.4 4.6 5.1 10.3 5.2 0.61963 9.4 3.0 7.3 6.1 2.8 -9.6 -1.0 -2.4 -5.2 -12.9 -9.3 -11.61964 -4.0 -0.3 8.4 13.5 2.8 7.4 6.8 14.3 14.1 12.8 2.6 -3.01965 -4.0 1.6 2.9 -12.9 -0.3 -12.8 -22.6 -11.4 -14.2 -11.1 -17.9 1.61966 -12.0 -4.1 -13.9 -7.1 -9.0 1.0 -1.0 4.0 -2.2 -2.5 -0.1 -4.01967 14.6 12.9 7.8 -3.0 -3.5 6.6 1.6 5.9 5.1 -0.1 -4.0 -5.51968 4.1 9.6 -3.0 -3.0 14.7 12.3 7.4 0.1 -2.8 -1.9 -3.4 2.11969 -13.5 -6.9 1.8 -8.8 -6.6 -0.6 -6.9 -4.4 -10.6 -11.7 -0.1 3.7Year Jan Feb Mar Apr May Jun Jul Aug Sep Oct <strong>No</strong>v Dec1970 -10.1 -10.7 1.8 -4.6 2.1 9.9 -5.6 4.0 12.9 10.3 19.7 17.41971 2.7 15.7 19.2 22.6 9.2 2.6 1.6 14.9 15.9 17.7 7.2 2.11972 3.7 8.2 2.4 -5.5 -16.1 -12.0 -18.6 -8.9 -14.8 -11.1 -3.4 -12.11973 -3.0 -13.5 0.8 -2.1 2.8 12.3 6.1 12.3 13.5 9.7 31.6 16.91974 20.8 16.2 20.3 11.1 10.7 2.6 12.0 6.6 12.3 8.5 -1.4 -0.91975 -4.9 5.3 11.6 14.4 6.0 15.5 21.1 20.7 22.5 17.7 13.8 19.51976 11.8 12.9 13.2 1.2 2.1 0.2 -12.8 -12.1 -13.0 3.0 9.8 -3.01977 -4.0 7.7 -9.5 -9.6 -11.4 -17.7 -14.7 -12.1 -9.4 -12.9 -14.6 -10.61978 -3.0 -<strong>24</strong>.4 -5.8 -7.9 16.3 5.8 6.1 1.4 0.8 -6.2 -2.0 -0.91979 -4.0 6.7 -3.0 -5.5 3.6 5.8 -8.2 -5.0 1.4 -2.5 -4.7 -7.5Year Jan Feb Mar Apr May Jun Jul Aug Sep Oct <strong>No</strong>v Dec1980 3.2 1.1 -8.5 -12.9 -3.5 -4.7 -1.7 1.4 -5.2 -1.9 -3.4 -0.91981 2.7 -3.2 -16.6 -5.5 7.6 11.5 9.4 5.9 7.5 -5.0 2.6 4.71982 9.4 0.6 2.4 -3.8 -8.2 -20.1 -19.3 -23.6 -21.4 -20.2 -31.1 -21.31983 -30.6 -33.3 -28.0 -17.0 6.0 -3.1 -7.6 0.1 9.9 4.2 -0.7 0.11984 1.3 5.8 -5.8 2.0 -0.3 -8.7 2.2 2.7 2.0 -5.0 3.9 -1.41985 -3.5 6.7 -2.0 14.4 2.8 -9.6 -2.3 8.5 0.2 -5.6 -1.4 2.11986 8.0 -10.7 0.8 1.2 -6.6 10.7 2.2 -7.6 -5.2 6.1 -13.9 -13.61987 -6.3 -12.6 -16.6 -<strong>24</strong>.4 -21.6 -20.1 -18.6 -14.0 -11.2 -5.6 -1.4 -4.51988 -1.1 -5.0 2.4 -1.3 10.0 -3.9 11.3 14.9 20.1 14.6 21.0 10.81989 13.2 9.1 6.7 21.0 14.7 7.4 9.4 -6.3 5.7 7.3 -2.0 -5.0Year Jan Feb Mar Apr May Jun Jul Aug Sep Oct <strong>No</strong>v Dec1990 -1.1 -17.3 -8.5 -0.5 13.1 1.0 5.5 -5.0 -7.6 1.8 -5.3 -2.41991 5.1 0.6 -10.6 -12.9 -19.3 -5.5 -1.7 -7.6 -16.6 -12.9 -7.3 -16.71992 -25.4 -9.3 -<strong>24</strong>.2 -18.7 0.5 -12.8 -6.9 1.4 0.8 -17.2 -7.3 -5.51993 -8.2 -7.9 -8.5 -21.1 -8.2 -16.0 -10.8 -14.0 -7.6 -13.5 0.6 1.61994 -1.6 0.6 -10.6 -22.8 -13.0 -10.4 -18.0 -17.2 -17.2 -14.1 -7.3 -11.61995 -4.0 -2.7 3.5 -16.2 -9.0 -1.5 4.2 0.8 3.2 -1.3 1.3 -5.51996 8.4 1.1 6.2 7.8 1.3 13.9 6.8 4.6 6.9 4.2 -0.1 7.21997 4.1 13.3 -8.5 -16.2 -22.4 -<strong>24</strong>.1 -9.5 -19.8 -14.8 -17.8 -15.2 -9.11998 -23.5 -19.2 -28.5 -<strong>24</strong>.4 0.5 9.9 14.6 9.8 11.1 10.9 12.5 13.31999 15.6 8.6 8.9 18.5 1.3 1.0 4.8 2.1 -0.4 9.1 13.1 12.8Year Jan Feb Mar Apr May Jun Jul Aug Sep Oct <strong>No</strong>v Dec2000 5.1 12.9 9.4 16.8 3.6 -5.5 -3.7 5.3 9.9 9.7 22.4 7.72001 8.9 11.9 6.7 0.3 -9.0 1.8 -3.0 -8.9 1.4 -1.9 7.2 -9.12002 2.7 7.7 -5.2 -3.8 -14.5 -6.3 -7.6 -14.6 -7.6 -7.4 -6.0 -10.62003 -2.0 -7.4 -6.8 -5.5 -7.4 -12.0 2.9 -1.8 -2.2 -1.9 -3.4 9.82004 -11.6 8.6 0.2 -15.4 13.1 -14.4 -6.9 -7.6 -2.8 -3.7 -9.3 -8.02005 1.8 -29.1 0.2 -11.2 -14.5 2.6 0.9 -6.9 3.9 10.9 -2.7 0.62006 12.7 0.1 13.8 15.2 -9.8 -5.5 -8.9 -15.9 -5.1 -15.3 -1.4 -3.02007 -7.3 -2.7 -1.4 -3.0 -2.7 5.0 -4.3 2.7 1.5 5.4 9.8 14.42008 14.1 21.3 12.2 4.5 -4.3 5.0 2.2 9.1 14.1 13.4 17.1 13.32009 9.4 14.8 0.2 8.6 -5.1 -2.3 1.6 -5.0 3.9 -14.7 -6.7 -7.02010 -10.1 -14.5 -10.6 15.2 10.0 1.8 20.5 18.8 25.0 18.3 16.4 27.1Year Jan Feb Mar Apr May Jun Jul Aug Sep Oct <strong>No</strong>v Dec~ 4 ~
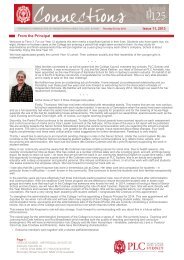
Figure 2: Schematic diagram showing a La Niña pattern in the Pacific Ocean. The Equatorial Thermocline forms theboundary between the warm upper layers of the Pacific Ocean and the cool denser layers of the ocean. <strong>No</strong>tethe enhanced easterly wind flow along the Equator that, after rising above northern Australia, then returns asa westerly flow aloft to descend over the far eastern Pacific. The areas shaded red in the western Pacific showwarmer than normal sea-surface temperatures, while the areas shaded dark blue show regions where sea-surfacetemperatures are cooler than normal – all depicting a La NiñaSource: (courtesy: Climate Prediction Center, US National Oceanic and Atmospheric Administration (NOAA)).How Does This La Niña SystemAffect Our Rainfall And Give Us AllThese Terrible Floods?During a La Niña (Figure 2), the circulation in the atmosphereacross the Pacific Ocean becomes stronger with a lot ofevaporation occurring over Australia and with lots of air risingabove Australia, in what is called the Walker Circulation.STUDENT ACTIVITIES9. What is the name given for the clockwise circulation of air shownin the diagram?10. What is meant by the Equatorial thermocline?11. Predict the effects on sailing ships crossing the equator northof Australia and fishing fleets operating off the coasts of Chileand Peru.To produce cloud and rain air has to rise! Therefore, with allthis very warm water (for example, over 31˚C in some places)plus warm air rising over Australia, all helped by the WalkerCirculation, then patterns known as upper troughs as well as astrong monsoon and increased tropical cyclone activity all worktogether to greatly increase rainfall over much of Australia,especially eastern Australia, to the point of often producingmajor floods in many areas. So, it is not really so surprising thatmany regions of Australia had such devastating floods duringthe La Niña event of 2010/<strong>2011</strong>.Farmers in Australia often quip that ‘average rain on theirproperty is drought plus flood divided by two’! There is sometruth to this as many La Niña (flood) events are precededby an El Niño (drought) event and vice versa. Therefore, asfarmers in Australia will also tell you, it may well be the casethat ‘droughts often finish and start with a flood’. This meansthat our rainfall and climate patterns form, a continuum whereAustralia swings from drought to flood and back to droughtagain, rather than really having so-called ‘average seasons’ thatare interrupted by drought and floods in some sort of one-offevent. So, unfortunately, we should expect severe droughts andsevere flood events to affect our country in the future on anongoing basis.For this most recent La Niña, how are our regions coping? TheNational Climate Centre of our Bureau of Meteorology providedsome useful information on the 2010/<strong>2011</strong> La Niña as follows:‘The rains of late 2010 have taken place during a very strongLa Niña event in the Pacific Ocean. The December SouthernOscillation Index (SOI) was +27.1, the highest December valueon record and the highest monthly value since 1973, whilstother indicators of La Niña also indicate the strongest eventsince at least the mid-1970s’.‘Previous strong La Niña events, such as those of 1974 and1955, have also been associated with widespread and severeflooding in eastern Australia. Sea surface temperatures off~ 5 ~
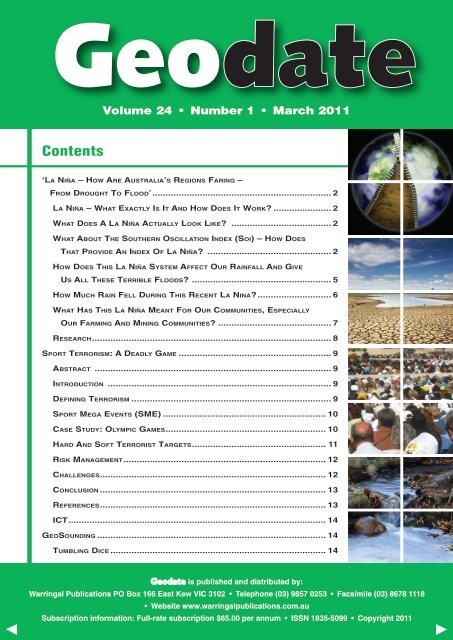
the Queensland coast in recent months have also beenat or near record levels’ (courtesy B. Trewin, Bureau ofMeteorology, <strong>2011</strong>).Figure 3: Queensland Floods, December, 2010. Courtesy,The Toowoomba Chronicle.STUDENT ACTIVITIES12. What is the direction of air movement when one arm of theWalker Circulation is positioned over Australia in a La Niñaevent?13. Define upper atmospheric troughs’, ‘monsoon circulation andtropical cyclones. Demonstrate how each event contributes toheavy summer rainfall.14. Why do Australian seasons lurch from drought to flooding rains?How Much Rain Fell During ThisRecent La Nina?During this recent La Niña, total rainfall exceeded 300 mmover most of the eastern half of Queensland during earlysummer alone. ‘Totals right up in the 400 to 600 mm rangewere widespread along most of the Queensland east coast,extending inland to cover many areas in the Central Highlandsand adjacent areas of Queensland, as well as most of CapeYork Peninsula’ (BoM, <strong>2011</strong>). Additionally as is well known,in a short period extremely intense rainfall occurred overToowoomba and the area between Toowoomba and Brisbane(the Lockyer Valley) producing very quickly occurring andterribly devastating ‘flash floods’ followed by longer-termgeneral flooding.Rainfall amounts for late 2010 are shown in Figure 4.Contrast this recent situation associated with an intense La Niñacompared to the El Niño period such as 2002/2003 (Figure 5).Figure 4: Rainfall deciles for the period July to December, 2010 (Courtesy Bureau of Meteorology).~ 6 ~
Figure 5: Rainfall deciles for the period July to December, 2002 (Courtesy Bureau of Meteorology).STUDENT ACTIVITIES15. Is this photograph Figure 3 typical of a riverine or flash flood?Why?16. Look up the Department of Agriculture Farmnote ‘What aredeciles’ Retrieved February <strong>2011</strong> from 17. Describe the differences in rainfall decile ranges for the followingareas, in July to December 2002 and July to December 2010: southwesternWestern Australia; central Queensland, and central Victoria.For the equivalent six-month period, from July to December,2002, most of eastern Australia recorded between only 50mm and100mm.That’s the total rainfall for the entire period with onlythe eastern Darling Downs in Queensland and some coastal areas(plus western Tasmania) receiving higher falls closer to 100mmfor this entire 6-month period. Compare the El Niño situation in2002/03 with the more recent La Niña pattern in 2010/11!The flood rains in Victoria and southern New South Walesduring winter/spring of 2010 were also associated with the sameLa Niña.However, while still being the dominant system, it should alsobe pointed out that La Niña and El Niño are not the only climatesystems that drive our extreme weather in Australia. Patternssuch as the Southern Annular Mode in the Southern Ocean(which is likely responsible for South-West Western Australia’sdrought in 2010), the sub-tropical ridge (likely additionallyresponsible for the drought conditions in southern Australia)and the Indian Ocean Dipole (which is also linked back to theEl Niño/Southern Oscillation) can all also play a part – there aremany other climate systems as well!What Has This La Niña Meant ForOur Communities, Especially OurFarming And Mining Communities?During the years of the Millennium Drought (2000–2009)farmers were forced to de-stock to reduce cattle and sheepnumbers, reduce the use of irrigation water for manyhorticulture, viticulture, rice and cotton crops – all in order topreserve vital water in the Murray Darling Basin. Many cropswere not sown at all or if they were they often withered anddied due to moisture stress. Many farming communities andtownships suffered severely as a consequence of less farmincome and less money coming into the towns.On the other hand, during the drought years, many miningcommunities grew rapidly due to the high demand for mineralexports and many mining towns grew dramatically, partlybecause of the lack of intensely wet weather that wouldotherwise disrupt operations in open-cut coal mines and oil andgas drilling operations.With the onset of the La Niña in winter, 2010, everythingchanged. While floods caused big problems for miners, in otherareas good soil moisture meant crops and pastures could begrown and sown for the first time in many years.On the other hand too much rain meant the waterlogging ofmany wheat and barley crops in parts of Victoria, NSW, andQueensland, together with increased infestation of many pests(including plague locusts) and diseases. Many winter cropscould not even be harvested as it was just too wet to movemachinery onto the paddocks. The increased and ongoing wet~ 7 ~
weather meant, for some, that it was too wet to plant a summercrop, so again cutting farm and town income for so manyregions of Australia.For Australia’s regions that depend so much on sugarcane for anincome, increased very wet weather meant less sugar yield andless sugar content as well as badly interrupting mill operationsand all the shipping and transport of whatever sugar could beretrieved.During La Niña, sugarcane fields in Queensland also sufferfrom disease (‘orange rust’) together with many rats and snakesinvading the cane fields. What happens next is that there is a bigdownturn for this industry that helps Australia’s exports.For regions such as the Gascoyne/Murchison in WesternAustralia and in similar small crop-growing regions in the east,all this excess rainfall caused massive damage and limitedgrowth and quality of important small vegetable crops.For those regions producing cattle and sheep, disease andpest outbreaks are common during a La Niña, especiallywith blowflies, buffalo flies, cattle ticks, and worm and otherinfestations (see Figure 6). The massively increased numbers ofmosquitoes, sandflies and midges (all because of the same highrainfall and flooding) caused so much misery for wildlife andstock animals through the incessant attacks by these pests ontothe eyes and other regions of these poor animals.Figure 6: Buffalo fly on cattleLa Niña can also cause big losses for the mining industry,especially in regions such as central Queensland and WesternAustralia. The pits in open-cut coal mines can fill with water.Major damage can occur to drag-lines, coal trucks and trains,meaning that very valuable export coal cannot be shipped out ofthe mining region to the ports.In the meantime, our coastal ports can be severely impacted bythe same La Niña, often due to tropical cyclone damage causedby the cyclones very strong winds and storm surges – that area little like being hit by a tsunami. Billions of dollars in lossof our exports can be expected if the management of theseoperations is not really aware of the potential for such damagedue to La Niña.STUDENT ACTIVITIES18. Explain the effects of the Southern Annular Mode in the SouthernOcean and the Indian Ocean Dipole of Australia’s weatherpatterns.19. Describe the beneficial and detrimental effects of the MillenniumDrought on Australian rural industries.20. Explain the effect of the onset of the 2010 La Niña event onfarmer’s prospects. What were the later problems that emerged?21. How are pastoralists, miners and coastal communities affected bysuch prolonged heavy rainfall episodes?ResearchComplete the webquest ‘El Nino or El <strong>No</strong>-no RetrievedFebruary <strong>2011</strong> from Construct a photographic display in PowerPoint, or similarpresentation software, to illustrate the most powerful El Ninoand La Nina years from 1950 to the present in an Australiancontext.~ 8 ~
Sport Terrorism:A Deadly GameDr. Susan Bliss Director Global Education NSW 2001–2010,University Lecturer and Textbook AuthorAbstractSport attracts the attention of billions of people, making it adesirable target for terrorists who wish to publicise their causeto the largest and widest audience. Today, sport mega events(SME) such as the Olympic Games, viewed on the internationalstage, provide a potential target for terrorist activities. Thetargeting of sporting events has resulted in the need toimplement pro-active expensive security strategies that aresupported by governments’ defensive anti-terrorism legislationand offensive counter-terrorism tactics.IntroductionThe scene is set. The international media are broadcasting.Billions of fans are watching the 2012 London Olympic Games.Elite sportspeople are performing. A terrorist walks into thestadium with a hidden bomb. While the excited crowd cheers,the bomb explodes. Chaos follows. The Games are cancelled.This horrendous occurrence is possible.Since 1972, there have been over 170 sport-related terroristattacks (Figure 1). Even cricket, the so called ‘gentleman’sgame’, has been affected by terrorist activities in India, Pakistanand Sri Lanka (Figure 2). These attacks resulted not only indeath and damaged infrastructure but strained internationalrelationships, had a devastating ripple effect on economies and ademoralising impact on sportspeople and their fans.Defining TerrorismBoaz Ganor proposed that an analytically useful definition ofterrorism is ‘the intentional use of, or threat to use violenceagainst civilian targets, in order to attain political aims’.An internationally agreed definition has been difficult, asit is influenced by interpretation, personal perception andexploitation. (Ganor, 2005).Over the past decade, the changing global political landscapehas forced sport event managers to develop pro-active plans toreduce the risk of a terrorist attack.Figure 1: Global overview of sport related terrorism1997Sweden: OlympicsOlympic stadium inStockholm damagedby terrorist bomb,planted by groupopposed to Swedishbid for 2004 OlympicGames1974Munich: OlympicsBlack Septembergroup crept into theOlympic Village inMunich and grabbednine Israeli teammembers as hostages.All killed2002Madrid: Football/SoccerChampion semi-final day at BernabeuStadium in Madrid between RealMadrid and Barcelona FC.Car bomb targeted by members ofthe Basque separatist group ETA.17 people injured2006Iraq: Taekwondo, Tennis, AthletesMay 17: 15 Taekwondo teammembers kidnapped. 13 found dead.May 26: Tennis coach and twoplayers shot dead allegedly forwearing shorts.July 16: Kidnapped 30 athletes andofficials at sports conference inBaghdad.1997UK: Horse RacingGrand National horse racein U.K abandoned after twobomb threats from IRA.60,000 spectators (includingPrincess Anne), evacuated1987South Korea: OlympicsDestruction of KoreanAirlines jet by terrorist bomb.Perpetrators intended todisrupt the lead up to 1988South Korea Olympics1996USA: OlympicsBomb detonatedin Atlanta GamesOlympic Park. I killedover 100 injured2010Pakistan: <strong>Vol</strong>leyballPakistan suicide bomb killsover 88 people at volleyballcourt in NW Pakistan1994Colombia: World CupColombian teamlost 2-1 to US, withEscobar scoring in hisown goal, leading totheir elimination. Uponreturning home he waskilled. Murder believedto be a punishmentor linked to gamblinglosses by drug lordswho bet on team.2008Senegal:Dakar Car RallyThe threat of al Qaedacancelled the Rallyfor first time in its30-year history. TheRally from Paris, toDakar, Senegal, wascancelled due tothreats in Mauritania2010Togo/Angola:Soccer teamTogo national football team’s busattacked travelling through Angolaon way to 2010 Africa Cup of Nationstournament. 3 killed several injured.The Front for the Liberation of theEnclave of Cabinda (FLEC) claimedresponsibility for the attack2010South Africa:World Cup<strong>No</strong>rth African Al-Qaedaterrorists issued athreat to cause ‘dozensand hundreds’ ofdeaths by attackingEngland’s openinggame in the footballWorld Cup in SouthAfrica.2008Sri Lanka: MarathonTamil Tiger suicidebomber detonateda device at start ofmarathon celebratingSri Lanka’s New Year.12 killed 100 injured.Highways ministerand former Olympicmarathon runneramong the dead.Source: Dr. Susan Bliss, Director, Global Education NSW~ 9 ~
Figure 2: Terrorist links with cricketCricket World Cup 1996 was hosted by India, Pakistan and Sri Lanka. It was the first timein the history of World Cup three countries jointly hosted the tournament at various venues.India<strong>No</strong>vember 2008Terrorist attacks in Mumbai,led to cancellation ofEngland-India One Dayseries.PakistanMay 1992Bomb blast outside Sheraton HotelKarachi, where cricket teams stayed, led tocancellation of NZ cricket team.1992–2002Cricket teams, especially Australia, reluctantto visit Pakistan to fulfil cricket commitmentsApril 2008Australia refused to tour Pakistan citingfear of terrorist attacks. The ICC postponedChampions Trophy to be held in Pakistan<strong>March</strong> 2009Bus of cricketers outside stadium in Lahore,were attacked. Laskar-e-taiba or LTTE wasresponsible.Eight killed and six Sri Lankan cricketplayers wounded.Sri LankaFebruary 1996Australia and WestIndies refused to travel toColombo during CricketWorld Cup. Sri Lankagripped in civil war againstTamil Tigers.July 2006Tri-series between SriLanka, South Africa andIndia cancelled due to aseries of Liberation Tigersof Tamil Eelam (LTTE)attacks in Sri Lanka.Source: Dr. Susan Bliss, Director, Global Education NSWDespite the disagreements over definition, it is generallyacknowledged that the key elements of terrorism are violence,fear and intimidation. The effectiveness of a terrorist act lies notin the act itself but in the public’s or government’s reaction tothe act.Unfortunately no terrorist target is off-limits and the probabilityof using weapons of mass destruction (e.g. chemical, biological,radiological and nuclear) has increased over the past decade.Sport Mega Events (SME)High profile sport mega events (SME) such as World Cups,Olympic Games and Commonwealth Games make temptingtargets for terrorists. These events become more enticing whenthey are sponsored by international corporations (e.g. CocaCola, Nike and General Motors) and are attended by worldpolitical leaders. The 2008 Beijing Olympic Games OpeningCeremony involved 10,000 athletes from 204 countries, 91,000spectators and four billion TV viewers. Effective, proactivesecurity management procedures ensured the ceremony was notmarred by terrorist attacks.In a post 9/11 world, SME have become attractive terrorist targetsas they represent an opportunity for terrorists to make a symbolicstatement coupled with a potential for mass casualties. The attackitself is secondary to its effects. Fear is the terrorist’s primaryweapon and bombs the method chosen to achieve their end.manifested themselves in demonstrations rather than terrorism.For example, before the 2000 Sydney Olympic Games,demonstrators expressed their concerns over the treatment ofminorities (Aboriginal people).The first major terrorist attack in sport history took place atthe Olympic Games in Munich in 1972. A Palestinian group,took nine Israeli team members as hostages. They demandedthe release of Palestinian prisoners held in Israeli jails. A failedrescue attempt led to the death of all Israeli hostages.The International Olympic Committee (IOC) ordered thatcompetition be resumed after a pause of 34 hours (Figure 3).The attack offered global exposure for the Palestinian causeand set off a wave of diplomatic, political and militaryconsequences.Figure 3: Getty Images: The Olympic flag flies at halfmastduring the memorial service at Munich’sOlympic Stadium the day after terrorists killed 11members of Israel’s national team. Case Study: Olympic GamesHistorically the Olympic Games, the largest and most popularmultisport event in the world, have served as ‘a vehicle toembarrass host governments, draw attention to injustices,apply political blackmail and raise serious ethical concerns’(Milton-Smith, 2002, p. 132). Generally these concerns~ 10 ~
Figure 4: Cost of security for Olympic Games Adapted: . During the 2002 Olympic Games, security costs were partly covered, by allocating aportion on each spectator ticket sold. This user-pay model has become a significant source of event securityfinancing.1984 1988 1992 1996 2000 2004City Los Angeles Seoul Barcelona Atlanta Sydney AthensCost $79.4million$111.7Million$66.2million$108.2million$179.6million$1.5billionSecurity cost per athlete $11,527 $13,312 $7,072 $10,485 $15,052 $142,857Security cost per ticket $14 $34 $22 $13 $34 $283Figure 5: Debatable distinction between anti-terrorism and counter-terrorismAnti-terrorismDefensive operations intended to reduce the chance of an attacktaken at specific points e.g. borders, ports and airports to detectand stop terroristsSource: Dr. Susan Bliss, Director, Global Education NSWWhile strengthened pro-active security may have preventedsubsequent attacks, it is argued that it resulted in draconiansecurity methods. For example, the athletes’ village at the1976 Games was referred to as a ‘prison camp’. Despitesuch comment, the security framework developed for the1976 Games, provided the paradigm for ensuing Olympicoperations. By 2004, the organisers of the Athens Games,requested assistance from the international community. This setthe precedent of including foreign agencies in future securitymodels. To ensure the safety of the Australian team at the 2012London Games, the Australian Olympic Committee (AOC)appointed its own security chief for London.Questions to be considered are:1. Will the increase in security result in the fortification offuture Olympics?2. Will future Games will be prohibitively expensive, assecurity budgets run into billions of dollars.The 2004 Greek Games deployed 70,000 troops, installed 1000high-tech cameras, a sensor-festooned blimp, and the <strong>No</strong>rthAmerican Treaty Organisation’s Mediterranean fleet was onpatrol. The total security cost was $1.5 billion or $142,857 perathlete (Figure 4). A current estimate for security at the 2012London Olympics is one billion dollars.The IOC stipulates that security is the sole responsibility of thehost city as it is unwilling and unable to cover every possiblecontingency.Given the cultural appeal and global media coverage of theGames, a successful terrorist attack can not be ignored in thefuture. A prepared populace, makes a less inviting target forpotential terrorists especially in the post 9/11 era.In the world of terrorism and counter terrorism, the media is aneffective tool. Those dealing with anti-terrorism and counterterrorismactivities (Figure 5) aim to demonstrate their ability tocontrol, detect and prevent terrorists, thereby sending a messageto terrorists – they ‘have not’ and ‘will not’ succeed. Anti-terroristmanagers must ensure a media balance, otherwise they can createfear rather than assurance among those requiring protection.Counter-terrorismActive or offensive operations intended to prevent, pre-empt,neutralise or destroy terrorists and their organisations.Strategies governments, militaries, police and corporations adoptin response to terrorist threats and/or actsSTUDENT ACTIVITIES1. Explain what is meant by SME, IOC and 9/11.2. Debate the term ‘terrorism’ and construct a concise definition.3. Examine Figure 1. Describe the geographical distribution ofcountries affected by sport terrorism.4. Refer to Figure 2. Cricket, the so called ‘gentleman’s game’, hasbeen affected by terrorist activities. Discuss the impacts on thepopulation, economy, international relationships and cricket.5. Refer to Figure 4. Draw the table as three line graphs. Discuss thereasons for the changes over time.6. Create a flow diagram illustrating the local, national and globalimpacts of a terrorist attack at a sporting event.7. Discuss why sport events sponsored by international corporations,symbolising American capitalism and culture, are popular terroristtargets.8. Analyse the reasons for the popularity of a SME as a terroristtarget and the changing security since 1972.Hard And Soft Terrorist TargetsHaving determined a potential target, the terrorist analyses therisks involved. This entails balancing the benefits of attacking atarget and the likelihood of success as opposed to the cost of theproposed attack. The cost-benefit analysis influences whetherthe terrorist selects a hard or soft target:• hard targets are highly protected from external threats,(such as the Olympics), and pose greater challenges inexecuting them successfully.• soft targets require little security such as small leisurefacilities (for example, football grounds). They are attractiveto terrorists because they allow surprise and as a result canincrease public fear.Although future SME may be surrounded by rings of steel,thousands of smaller unprotected sport events across the world,represent softer targets. The psychological effect of an attackon a soft target such as a community sporting stadium would bedisastrous, even if the casualty toll was low.~ 11 ~
STUDENT ACTIVITIES9. Explain the phrase ‘terrorism is more than violence’.Distinguish between anti-terrorism and counter-terrorismmeasures and the problems of effective security managementas sport events.10. Discuss the reasons why terrorists move from hard to soft sportevent targets and the implications for future security.Risk ManagementIn the months leading up to a sport event, athletes train andspectators finalise travel plans, while behind the scenes sportvenue managers pursue a risk management approach byconducting ‘threat, vulnerability and criticality assessments’(Decker, 2001, p. 1) to prevent a terrorist attack:• threat: generally large sport events, supported by globalmedia coverage, are more vulnerable to a terrorist threat thansmall events.• vulnerability: spectators, sponsors, participants,infrastructure (embassies, transport, communicationnetworks) and security teams are all vulnerable to (Figure 6).• risk or criticality assessment ‘evaluates the threat potential,the likelihood of adversary success, and the severity of theconsequences of an attack.ChallengesThe Olympic Games provides the most spectacular theatre forthe disaffected to draw attention to their cause. This can lead tothe deliberate disruption of the Gamesa) Managing multiple, complex challengesThe development of effective anti-terrorism protectionsystems is a daunting challenge – long borders, vastareas, large number of overseas tourists with high trafficvolumes in cities and at sporting venues. Other managementchallenges include:• threat from a lone attacker using an Improvised ExplosiveDevice. This poses the biggest security threat.• fear of attack by an international organisation such asal-Qaeda• threat to information communication technology. The2008 Beijing Games received 12 million cyber attacks perday. Cyber attack is seen as an emerging threat to the 2012London Games. Ticketing, transport, hotel bookings andsecurity are among potential targets.• poor communication, limited coordination and conflictbetween multiple agencies and stakeholders. The 2002Salt Lake City Games involved the coordination of morethan 100 agencies with different agenda.Figure 6: Dimensions of Olympic security Adapted: Johnson C (2007, p.13)Malicious (e.g. directed terrorist action)1996 Atlanta: Central Park bomb attack –spectator killed and others hurt2004 Athens: Horan marathon race attack – long distancerunning, cycling and skiing as well as thetorch procession creates logistical problems2006 Turin: Computer hacking claims2000 Sydney: Man in possession of explosivesafter making threats to Olympic organisers – describedas a racist.1972 Munich: Black September attack –11 participants killed2004 Athens: ‘Revolutionary Struggle’ bombingof police station before Games1998 Seoul: <strong>No</strong>rth Korea two fatal bombings aimedto disrupt Olympics2000 Sydney: Planned Lucas Heights nuclear plant bombattack2006 Turin: Protests along torch procession overplanned high-speed rail tunnel between France and Italy.Protestors threatened to disrupt the gamesunless the project was halted.IndividualGroup2000 Sydney: Jenny Munro’s Airport protest – AustralianAborigines2004 Athens: Journalist leaves fake bombs at Olympicvenues indicating gaps in security1968 Mexico City: 10,000 Olympic protestorsdemonstrated on money spent in the name of sport ratherthan spending money on housing and welfare2004 Athens: Anti-commercial and anti-capitalistprotests. Athens Olympic Shop damaged2008 Beijing: Protests over persecuting Falun Gongpractitioners in Malaysia, London and New York2000 Sydney: Aboriginal protests on torch route and attent embassy ACT – media attention. Also attacks on thesponsors of the torch processionBenign (e.g. publicity event)~ 12 ~
Toohey, K. 2008, ‘Terrorism, sport and public policy in the risk society’, Sportin Society: Cultures, Commerce, Media, Politics, 1743–0445, vol. 11, no. 4,pp. 429–442 Toohey, K. 2008, ‘Olympic Games Management and Legacy’, GriffithUniversity, Queensland, pp. 1–18. Zekulin, M. 2009, ‘Olympic Security: Assessing the Risk of Terrorism at the2010 Vancouver Winter Olympics’, Journal of Military and StrategicStudies, vol. 12, no. 1 Fall, pp. 1–25ICTPlanet Sport Time ‘Top 10 Worst Sport Terrorism Attacks’ article/0,28804,1882967_1882966_1882948,00.html>Movie: Free Movie Download 21 Hours in MunichMovie: Munich (2005) GeoSoundingby Nick HutchinsonGeography Educator and WriterMacquarie UniversityTumbling DiceOn January 12, <strong>2011</strong>, a two metre high wall of water sweptthough the CBD of the Darling Downs city of Toowoomba.The flash flood, poetically called an ‘inland tsunami’ lastedten minutes. There are records going back to the 19thcentury that indicate that the amount of rainfall that fell inthe Toowoomba catchment before the flash flood was notunusual and had been exceeded on several past occasions, butwithout such dramatic results. Dr Jerry Maroulis, a fluvialgeomorphologist, who witnessed the flash flood explained,‘Before the Toowoomba area was settled it was largely achain of ponds, so there were a lot of reed beds and all therest of it.’ The wetlands have been replaced by concreteand bitumen; gutters and stormwater drains. These are veryeffective conduits for flash flood flows: a disaster if thereare heavy rainfall events in the Great Dividing Ranges. Thisdisaster was made more calamitous by the saturated soilswithin the catchment. 2010 had been Queensland’s wettestyear since records began in 1900. The average annual rainfallacross the state was 1109.73 millimetres in 2010, exceedingthe previous record of 1103.77 millimetres in 1950. The longterm average, taken from 1961–1990, is 623.34 millimetres.A local geography teacher remarked recently that the wetsummer in Brisbane reminded him of the weather patterns ofhis youth in the 1950s.Figure 1: Toowoomba, 12 January <strong>2011</strong> – Flood devastationSource: http://community.klipsch.com/forums/storage/9/1472299/161088-toowoomba-flash-flood.jpg~ 14 ~
The Toowoomba flash flood was a disaster, a calamity thathappened to people and their buildings, livelihoods andbelongings. A disaster can also devastate the biophysicalenvironment of a place as a result of a hazardous event. Ataround the same time as the flash flood, muddy floodwaterswere choking Moreton Bay from the Brisbane Riverfloods, bushfires were spreading through Perth suburbsand cyclones were cutting swathes through reefs, forestsand farmlands in Far <strong>No</strong>rth Queensland and north-westWestern Australia. A hazard is different to a disaster. Ahazard is some event or object that is a potential sourceof harm to human life, health, income or possessions.Environmental events such as river floods, earthquakes andmass movements are natural events and only consideredhazardous when human beings or built structures or aspectsof the biophysical environment are affected.It is the idea of ‘potential source of harm’ that introduces thegeography of risk: the tumbling dice, the potential negativeimpact of some future or present event on human activities.Environmental hazards are often seen in terms of risk, orthe probability of the hazard recurring multiplied by theexpected losses. Probability is normally determined fromhistorical trends and records so that we speak of a hundredyear flood referring to the likelihood of a flood, of a specifiedmagnitude, taking place in a certain place, in a given year.This idea may express technical risk but, for the geographer,it is important to expand this idea to include other importantconsiderations. The formulaRisk = f ( probability of occurrence of the event, populationexposed, vulnerability, coping strategies) is a useful one.Obviously such a formula involves a lot of uncertaintybecause each element varies over time and across space andbecause, despite the most sophisticated GIS science, ourknowledge of the components of risk is always incomplete.Concentrating on the time part of the equation if there havebeen 40 cyclones, floods or blizzards in a hundred yearrecord the event is said to have a recurrence interval ofonce every 2.5 years on average (100/40 = 2.5); that is theenvironmental hazard has a 0.4 probability (40/100 = 0.4) ora 0.4 chance of occurring in any given year. The magnitudeof the event is also important, as measured on the Richterscale for the energy released by an earthquake, the windspeeds of a cyclone or the discharge of a river.The floods that affected Brisbane in January, <strong>2011</strong> wereonly a one-in-twenty-five-year event and only the sixthhighest on record, and yet they inflicted much damage,hurt and anger. They could also occur again this year, nextyear, or, the year after. It is a matter of probability. GIShave been developed in Australia that can determine naturalhazard risk ratings at the resolution of individual streetaddresses for bushfire and floods, and, census districts,postcodes or coastal districts for hail storms, earthquakesand tropical cyclones. However, they have to be interpretedwith care. A sound knowledge of mapping techniques andan acquaintance with statistics helps greatly. As does anappreciation of the nature of the environmental hazardbecause sophisticated data that refers to the probability ofexperiencing a flood expressed on a scale from very highrisk (< 1 in 20 average recurrence interval) to negligiblerisk (> 1 in 10 000 years) does not take into account flashflooding; it only relates to river flooding.The geographical models that are used by insurancecompanies are very sophisticated indeed. They use weatherprediction models together with databases of insured valuesand the vulnerability of properties to predict the probabilityof a financial loss. They are so complex because they have toinclude several components: First of all a weather model thatpredicts where how much rain falls. Then you need a floodmodel that distributes the water across the land surface andinto the rivers depending on the level of soil saturation. Then,to calculate the final extent of the flood, you need a modelthat takes into account the existing flood defences, such aslevees, sandbags and weirs, and, the probability that thesedefences will fail.In spite of all this data, even accepting that people understandthe laws of probability, people faced by environmentalhazards do not always pay attention nor do they understandthe predicted event. Even if they are frequently exposed tosound information on environmental hazards they need tobelieve that the hazard really exists and that protection isneeded. All too often, the main problem for people to start totake action about a hazard is that they do not believe it reallyexists. One reason to explain this is that people rely on pastexperience. People simply make rational decisions based onpast experience rather than potential risks.However, the resulting behaviour nearly always follows thesame pattern. They are shocked – often the disaster mayseem unreal, like a dream. They are afraid – about the safetyof family and friends. They are angry – ‘who caused it’ or‘allowed it to happen’. They feel helpless – such crises showus how powerless we are at times, as well as our strengths.They are sad – for the loss of the belief that our world is safeand predictable. And, they are full of shame – for havingbeen exposed as helpless, emotional and needing others.An understanding of the geography of risk can help us makerational decisions based on the probability of environmentalhazards occurring but it can do little to redress the very realhuman emotions that follow from such tragedies.Warringal Publications are producers of excellent resources for teachers and students. For further information on study guides forsenior secondary students in New South Wales and Victoria call (03) 9857 0253 or log on to www.warringalpublications.com.auGeneral Editor: Jo Mawbey, Former Teacher of Geography, Melbourne Girls Grammar SchoolStudent Activities Writer: Nick Hutchinson, Geography Educator and Writer, Macquarie UniversityManaging Editor: Denise Michie