Chapter-1 / Physiological Foundations - WHNLive Public Library
Chapter-1 / Physiological Foundations - WHNLive Public Library
Chapter-1 / Physiological Foundations - WHNLive Public Library

You also want an ePaper? Increase the reach of your titles
YUMPU automatically turns print PDFs into web optimized ePapers that Google loves.
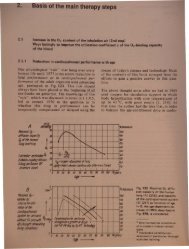
he cylindr'cal area upplied by the'1 ry, which only gives a rough approximafn can b en on th left of Table 10. Whenth dep nd nce of the consumption rate on theof r i considered, this area is very significantlytended. The solution of the diffusion fieldqu tion for the substrate concentration in theun aturated area is presented in detail on theright of Table 10. The symbols are summarizedin Fig. 90. The diffusion field equation presentedsatisfies our premises, whereby the consumptionin area I is assumed to be constant,and in area II to be linearly depenCJ4~ntconcentration. The co ideraf0 0tionary case simplifies the problem,a Bernoulli differential equationand in area II a Bessel differential eqwltl(]lnboundary conditions which lead to t e 101111ticmin both areas are also given in Tab etwo-dimensional diffusion field eqUiltionrelevant for the P0 2 topography in sup,plythe vessel walls from the lumen, giveanalysed in Fig. 243.1.3.4 Selection of the equation parameters for oxygen and normally or deficiently sulJPIiied ....1-a) The oxygen partial pressure at the capillarywall in normal supply lies between 50 (venousend) and 90 mmHg (arterial end). In normalsupply P0 2 = 45 mmHg (6 kPa) can be seen asa representative level for the middle of thecapillary, and P0 2= 30 mmHg (4 kPa) indeficient supply.For a more accurate consideration of theeffects of an increase in the P0 2 of the inhalationair, as envisaged by the second main stepof the 02MT, it must be remembered that thedrop in P0 2 occurs predominantly in roughly25 % of the capillary length, calculated fromthe arterial end [166], cf. also Fig. 3.b) For the oxygen partial pressure in the transitionzone from saturated to unsaturated 02metabolism of cells, P0 2 _ t= 10 mmHg mustbe used, in accordance with the characteristicin Fig. 91.c) For the diffusion coefficient of 02 .healthy tissue, values between Do'], = 3 ·10-6and 9·10-6 cm 2 /s are used, since the valgiven in the literature vary greatly. For comp .son, D02 = 3· 10-6 cm 2 /s is given for' laccancer tissue, which is used as a basis in [163 .Because other papers [166, 167)D0 2 IllS 9· 10-6 cm 2 /s, we have also incl dthis value in our consideration. Since we 0need principles here, and not absolute vatuthe calculations have been extended overwhole range of variation of the D0 2 values.d) The oxygen consumption in saturation isaccording to the respiration characteristic (cf.Fig. 91), P0 2 = 10 ml/100 g·min and is in acordance with [164]. Depending on the demandson the functional capacity of the heartother P0 2 values were also included in thecalculation.e) In accordance with [166] R c = 4 /lm wasused for the outer capillary wall radius.1.3.5 Calculation of the P02 distribution in the intercapillary space of normally supplied tissueFigure 92 shows the calculation of the O2 cuncentrationdependent on the distance r of thecapillary axis for normal tissue with the equationparameters named in Paragraph 1.3.4. Thecourse of the curve for constant substrate consumption(area I, simplified calculation) isgiven, as is that for the dimini~hing substrateconsumption below the saturation concentration(area II, accurate calculation as in [168]).With reference to the supply, the level Po 2 =3.5 mmHg (0.47 kPa) should be seen as thecritical oxygen partial pressure, at which, accordingto [146, 164] the respiration of thecell changes to fermentation. An approximatelynormal supply thu exi t ~ alon~ a t~econdition P0 2> 3.5 mmHg remams fulfilled mthe largest distances r occurring in the m 0cardium. The variation of r which we u e abasis for healthy tissue, in accordance with [166, 168, 169], is given in Fig. 92. It canseen from the courses of the curves under haconditions the P0 2 reaches criticall 10 1 Iin the tissue. The calculation given h represent the most unfavorable bord rIinbecause of th und dying model with a inglcapillary. In reality th contribution of nihboringcapillaries to the 02 suppl i alto be added. Thi additional ontribu i n iesp cially promin nt in th my rdium duth r lativ ly r gular arr ng m nt f thlarie th r. i ur 9 h n idch m f th pill riz i n h