- Page 1 and 2:
Social Sector Metrics Inc. & Health
- Page 4 and 5:
Physician Resource PlanningAn Envir
- Page 6 and 7:
Physician Resource PlanningAn Envir
- Page 8 and 9:
Physician Resource PlanningAn Envir
- Page 10:
3 KEY OBSERVATIONS3.1 IntroductionP
- Page 13 and 14:
KEY OBSERVATIONSPhysician Resource
- Page 15 and 16:
Physician Resource PlanningAn Envir
- Page 17 and 18:
Physician Resource PlanningAn Envir
- Page 19 and 20:
Physician Resource PlanningAn Envir
- Page 21 and 22:
Physician Resource PlanningAn Envir
- Page 23 and 24:
Physician Resource PlanningAn Envir
- Page 25 and 26:
Physician Resource PlanningAn Envir
- Page 27 and 28:
Physician Resource PlanningAn Envir
- Page 29 and 30:
Physician Resource PlanningAn Envir
- Page 31 and 32:
4.4 ConsultantPhysician Resource Pl
- Page 33 and 34:
4.8 Methodology Guiding PrinciplesP
- Page 35 and 36:
ContextooPhysician Resource Plannin
- Page 37 and 38:
Physician Resource PlanningAn Envir
- Page 39 and 40:
Physician Resource PlanningAn Envir
- Page 41 and 42:
Physician Resource PlanningAn Envir
- Page 43 and 44:
7 CONCEPTUAL MODELS7.1 Methodologie
- Page 45 and 46:
7.4 BenchmarkingPhysician Resource
- Page 47 and 48:
Figure 23 Population per Physician
- Page 49 and 50:
Physician Resource PlanningAn Envir
- Page 51 and 52:
8 NATIONAL ENVIRONMENT8.1 Quality o
- Page 53 and 54:
All communities in all LHAs:oo−
- Page 55 and 56:
Physician Resource PlanningAn Envir
- Page 57 and 58:
Physician Resource PlanningAn Envir
- Page 59 and 60:
Physician Resource PlanningAn Envir
- Page 61 and 62:
8.4.3 NationalPhysician Resource Pl
- Page 63 and 64:
Physician Resource PlanningAn Envir
- Page 65 and 66:
Physician Resource PlanningAn Envir
- Page 67 and 68:
Physician Resource PlanningAn Envir
- Page 69 and 70:
Physician Resource PlanningAn Envir
- Page 71 and 72:
Physician Resource PlanningAn Envir
- Page 73 and 74:
Physician Resource PlanningAn Envir
- Page 75 and 76:
Physician Resource PlanningAn Envir
- Page 77 and 78:
Physician Resource PlanningAn Envir
- Page 79 and 80:
9.5 Canadians Studying AbroadPhysic
- Page 81 and 82:
Figure 53 Net in/(out) migration by
- Page 83 and 84:
9.7 Worked HoursPhysician Resource
- Page 85 and 86:
Physician Resource PlanningAn Envir
- Page 87 and 88:
Physician Resource PlanningAn Envir
- Page 89 and 90:
11 POPULATIONPhysician Resource Pla
- Page 91 and 92:
Physician Resource PlanningAn Envir
- Page 93 and 94:
Physician Resource PlanningAn Envir
- Page 95 and 96:
Physician Resource PlanningAn Envir
- Page 97 and 98:
INCIDENCEPhysician Resource Plannin
- Page 99 and 100:
PHYSICIAN SERVICESPhysician Resourc
- Page 101 and 102:
12.5 Renal DiseasePhysician Resourc
- Page 103 and 104:
Physician Resource PlanningAn Envir
- Page 105 and 106:
Physician Resource PlanningAn Envir
- Page 107 and 108:
Physician Resource PlanningAn Envir
- Page 109 and 110:
Physician Resource PlanningAn Envir
- Page 111 and 112:
Physician Resource PlanningAn Envir
- Page 113 and 114:
Physician Resource PlanningAn Envir
- Page 115 and 116:
Physician Resource PlanningAn Envir
- Page 117 and 118:
Physician Resource PlanningAn Envir
- Page 119 and 120:
Physician Resource PlanningAn Envir
- Page 121 and 122:
Physician Resource PlanningAn Envir
- Page 123 and 124:
Physician Resource PlanningAn Envir
- Page 125 and 126:
Physician Resource PlanningAn Envir
- Page 127 and 128:
Physician Resource PlanningAn Envir
- Page 129 and 130:
Physician Resource PlanningAn Envir
- Page 131 and 132:
Physician Resource PlanningAn Envir
- Page 133 and 134:
Physician Resource PlanningAn Envir
- Page 135 and 136:
Physician Resource PlanningAn Envir
- Page 137 and 138:
Physician Resource PlanningAn Envir
- Page 139 and 140:
Physician Resource PlanningAn Envir
- Page 141 and 142:
−−Physician Resource PlanningAn
- Page 143 and 144:
Physician Resource PlanningAn Envir
- Page 145 and 146:
Physician Resource PlanningAn Envir
- Page 147 and 148:
Physician Resource PlanningAn Envir
- Page 149 and 150:
−−−−−−−Physician Reso
- Page 151 and 152:
POPULATION NEEDPhysician Resource P
- Page 153 and 154:
• Specific Disciplines−−−
- Page 155 and 156:
Background DataPhysician Resource P
- Page 157 and 158:
Key (selected) ChallengesooooooPhys
- Page 159 and 160:
Physician Resource PlanningAn Envir
- Page 161 and 162:
Background DataPhysician Resource P
- Page 163 and 164:
Physician Resource PlanningAn Envir
- Page 165 and 166:
• Social-economic−Physician Sup
- Page 167 and 168:
−Physician Resource PlanningAn En
- Page 169 and 170:
Physician Resource PlanningAn Envir
- Page 171 and 172:
−−−−−−Physician Resourc
- Page 173 and 174:
Physician Resource PlanningAn Envir
- Page 175 and 176: Physician Resource PlanningAn Envir
- Page 177 and 178: 19.1.2 GenderPhysician Resource Pla
- Page 179 and 180: Physician Resource PlanningAn Envir
- Page 181 and 182: 19.1.4 Language - FrenchPhysician R
- Page 183 and 184: Physician Resource PlanningAn Envir
- Page 185 and 186: Physician Resource PlanningAn Envir
- Page 187 and 188: Physician Resource PlanningAn Envir
- Page 189 and 190: 22 FAMILY MEDICINE22.1.1 NationalPh
- Page 191 and 192: PRIMARY CARE NETWORK - COORDINATED
- Page 193 and 194: Physician Resource PlanningAn Envir
- Page 195 and 196: Physician Resource PlanningAn Envir
- Page 197 and 198: 23 MEDICAL DISCIPLINES23.1 National
- Page 199 and 200: Physician Resource PlanningAn Envir
- Page 201 and 202: Physician Resource PlanningAn Envir
- Page 203 and 204: Physician Resource PlanningAn Envir
- Page 205 and 206: Physician Resource PlanningAn Envir
- Page 207 and 208: • Benchmark(s):Physician Resource
- Page 209 and 210: Physician Resource PlanningAn Envir
- Page 211 and 212: Physician Resource PlanningAn Envir
- Page 213 and 214: Physician Resource PlanningAn Envir
- Page 215 and 216: Physician Resource PlanningAn Envir
- Page 217 and 218: • Benchmark(s)Physician Resource
- Page 219 and 220: 23.3.3 Paediatrics - PsychiatryPhys
- Page 221 and 222: Physician Resource PlanningAn Envir
- Page 223 and 224: Physician Resource PlanningAn Envir
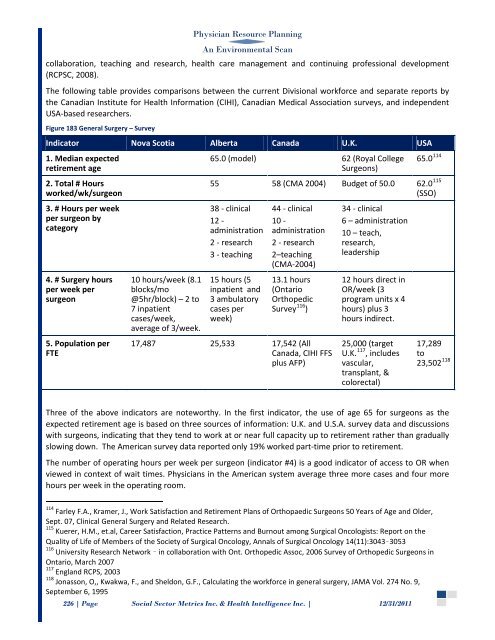
- Page 225: Physician Resource PlanningAn Envir
- Page 229 and 230: Physician Resource PlanningAn Envir
- Page 231 and 232: Physician Resource PlanningAn Envir
- Page 233 and 234: 24.3.9 Orthopaedic SurgeryCurrently
- Page 235 and 236: Physician Resource PlanningAn Envir
- Page 237 and 238: Physician Resource PlanningAn Envir
- Page 239 and 240: Physician Resource PlanningAn Envir
- Page 241 and 242: Physician Resource PlanningAn Envir
- Page 243 and 244: Physician Resource PlanningAn Envir
- Page 245 and 246: Residency ProgramsPhysician Resourc
- Page 247 and 248: Physician Resource PlanningAn Envir
- Page 249 and 250: Medical BiochemistryPhysician Resou
- Page 251 and 252: Physician Resource PlanningAn Envir
- Page 253 and 254: −Physician Resource PlanningAn En
- Page 255 and 256: −−−Physician Resource Plannin
- Page 257 and 258: Physician Resource PlanningAn Envir
- Page 259 and 260: −−−Physician Resource Plannin
- Page 261 and 262: Physician Resource PlanningAn Envir
- Page 263 and 264: PHYSICIAN SUPPLY• Critical mass
- Page 265 and 266: Physician Resource PlanningAn Envir
- Page 267 and 268: Physician Resource PlanningAn Envir
- Page 269 and 270: −Physician Resource PlanningAn En
- Page 271 and 272: −−−−−Physician Resource P
- Page 273 and 274: • Social-economic−−PHYSICIAN
- Page 275 and 276: 26.5.3 OphthalmologyPhysician Resou
- Page 277 and 278:
Physician Resource PlanningAn Envir
- Page 279 and 280:
Physician Resource PlanningAn Envir
- Page 281 and 282:
Physician Resource PlanningAn Envir
- Page 283 and 284:
Physician Resource PlanningAn Envir
- Page 285 and 286:
Physician Resource PlanningAn Envir
- Page 287 and 288:
Physician Resource PlanningAn Envir
- Page 289 and 290:
Physician Resource PlanningAn Envir
- Page 291 and 292:
Physician Resource PlanningAn Envir
- Page 293 and 294:
27.3.3 General - Not Cited - Papers
- Page 295 and 296:
Physician Resource PlanningAn Envir
- Page 297 and 298:
28 Interview 16-Aug Department ofHe
- Page 299 and 300:
information18 Preliminarymeeting fo
- Page 301 and 302:
20 Preliminarymeeting forinformatio
- Page 303 and 304:
Physician Resource PlanningAn Envir
- Page 305 and 306:
Physician Resource PlanningAn Envir
- Page 307 and 308:
Physician Resource PlanningAn Envir
- Page 309 and 310:
Physician Resource PlanningAn Envir
- Page 311 and 312:
Physician Resource PlanningAn Envir
- Page 313 and 314:
Physician Resource PlanningAn Envir
- Page 315 and 316:
Physician Resource PlanningAn Envir
- Page 317 and 318:
Physician Resource PlanningAn Envir
- Page 319 and 320:
Physician Resource PlanningAn Envir
- Page 321 and 322:
Physician Resource PlanningAn Envir
- Page 323 and 324:
Physician Resource PlanningAn Envir
- Page 325 and 326:
Physician Resource PlanningAn Envir
- Page 327:
Physician Resource PlanningAn Envir


