Modelling of hysteresis influence on mass transfer in building ...
Modelling of hysteresis influence on mass transfer in building ...
Modelling of hysteresis influence on mass transfer in building ...

You also want an ePaper? Increase the reach of your titles
YUMPU automatically turns print PDFs into web optimized ePapers that Google loves.
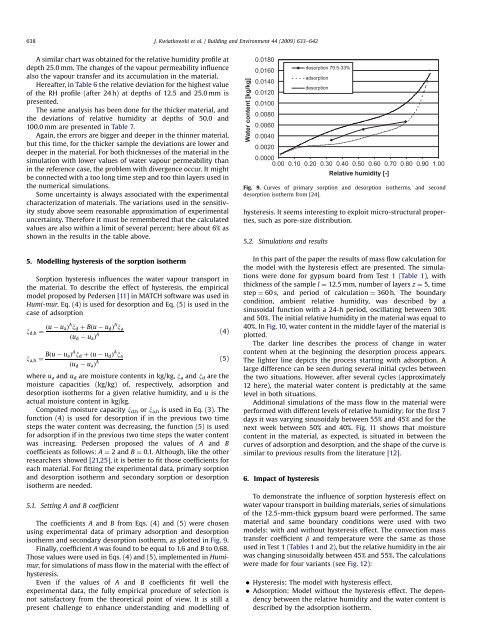
ARTICLE IN PRESS638J. Kwiatkowski et al. / Build<strong>in</strong>g and Envir<strong>on</strong>ment 44 (2009) 633–642A similar chart was obta<strong>in</strong>ed for the relative humidity pr<str<strong>on</strong>g>of</str<strong>on</strong>g>ile atdepth 25.0 mm. The changes <str<strong>on</strong>g>of</str<strong>on</strong>g> the vapour permeability <str<strong>on</strong>g><strong>in</strong>fluence</str<strong>on</strong>g>also the vapour <strong>transfer</strong> and its accumulati<strong>on</strong> <strong>in</strong> the material.Hereafter, <strong>in</strong> Table 6 the relative deviati<strong>on</strong> for the highest value<str<strong>on</strong>g>of</str<strong>on</strong>g> the RH pr<str<strong>on</strong>g>of</str<strong>on</strong>g>ile (after 24 h) at depths <str<strong>on</strong>g>of</str<strong>on</strong>g> 12.5 and 25.0 mm ispresented.The same analysis has been d<strong>on</strong>e for the thicker material, andthe deviati<strong>on</strong>s <str<strong>on</strong>g>of</str<strong>on</strong>g> relative humidity at depths <str<strong>on</strong>g>of</str<strong>on</strong>g> 50.0 and100.0 mm are presented <strong>in</strong> Table 7.Aga<strong>in</strong>, the errors are bigger and deeper <strong>in</strong> the th<strong>in</strong>ner material,but this time, for the thicker sample the deviati<strong>on</strong>s are lower anddeeper <strong>in</strong> the material. For both thicknesses <str<strong>on</strong>g>of</str<strong>on</strong>g> the material <strong>in</strong> thesimulati<strong>on</strong> with lower values <str<strong>on</strong>g>of</str<strong>on</strong>g> water vapour permeability than<strong>in</strong> the reference case, the problem with divergence occur. It mightbe c<strong>on</strong>nected with a too l<strong>on</strong>g time step and too th<strong>in</strong> layers used <strong>in</strong>the numerical simulati<strong>on</strong>s.Some uncerta<strong>in</strong>ty is always associated with the experimentalcharacterizati<strong>on</strong> <str<strong>on</strong>g>of</str<strong>on</strong>g> materials. The variati<strong>on</strong>s used <strong>in</strong> the sensitivitystudy above seem reas<strong>on</strong>able approximati<strong>on</strong> <str<strong>on</strong>g>of</str<strong>on</strong>g> experimentaluncerta<strong>in</strong>ty. Therefore it must be remembered that the calculatedvalues are also with<strong>in</strong> a limit <str<strong>on</strong>g>of</str<strong>on</strong>g> several percent; here about 6% asshown <strong>in</strong> the results <strong>in</strong> the table above.5. <str<strong>on</strong>g>Modell<strong>in</strong>g</str<strong>on</strong>g> <str<strong>on</strong>g>hysteresis</str<strong>on</strong>g> <str<strong>on</strong>g>of</str<strong>on</strong>g> the sorpti<strong>on</strong> isothermSorpti<strong>on</strong> <str<strong>on</strong>g>hysteresis</str<strong>on</strong>g> <str<strong>on</strong>g><strong>in</strong>fluence</str<strong>on</strong>g>s the water vapour transport <strong>in</strong>the material. To describe the effect <str<strong>on</strong>g>of</str<strong>on</strong>g> <str<strong>on</strong>g>hysteresis</str<strong>on</strong>g>, the empiricalmodel proposed by Pedersen [11] <strong>in</strong> MATCH s<str<strong>on</strong>g>of</str<strong>on</strong>g>tware was used <strong>in</strong>Humi-mur. Eq. (4) is used for desorpti<strong>on</strong> and Eq. (5) is used <strong>in</strong> thecase <str<strong>on</strong>g>of</str<strong>on</strong>g> adsorpti<strong>on</strong>x d;h ¼ ðu u aÞ A x d þ Bðu u d Þ A x aðu d u a Þ A (4)x a;h ¼ Bðu u aÞ A x d þðu u d Þ A x a(5)ðu d u a Þ Awhere u a and u d are moisture c<strong>on</strong>tents <strong>in</strong> kg/kg, x a and x d are themoisture capacities (kg/kg) <str<strong>on</strong>g>of</str<strong>on</strong>g>, respectively, adsorpti<strong>on</strong> anddesorpti<strong>on</strong> isotherms for a given relative humidity, and u is theactual moisture c<strong>on</strong>tent <strong>in</strong> kg/kg.Computed moisture capacity x d,h or x a,h is used <strong>in</strong> Eq. (3). Thefuncti<strong>on</strong> (4) is used for desorpti<strong>on</strong> if <strong>in</strong> the previous two timesteps the water c<strong>on</strong>tent was decreas<strong>in</strong>g, the functi<strong>on</strong> (5) is usedfor adsorpti<strong>on</strong> if <strong>in</strong> the previous two time steps the water c<strong>on</strong>tentwas <strong>in</strong>creas<strong>in</strong>g. Pedersen proposed the values <str<strong>on</strong>g>of</str<strong>on</strong>g> A and Bcoefficients as follows: A ¼ 2 and B ¼ 0.1. Although, like the otherresearchers showed [21,25], it is better to fit those coefficients foreach material. For fitt<strong>in</strong>g the experimental data, primary sorpti<strong>on</strong>and desorpti<strong>on</strong> isotherm and sec<strong>on</strong>dary sorpti<strong>on</strong> or desorpti<strong>on</strong>isotherm are needed.5.1. Sett<strong>in</strong>g A and B coefficientThe coefficients A and B from Eqs. (4) and (5) were chosenus<strong>in</strong>g experimental data <str<strong>on</strong>g>of</str<strong>on</strong>g> primary adsorpti<strong>on</strong> and desorpti<strong>on</strong>isotherm and sec<strong>on</strong>dary desorpti<strong>on</strong> isotherm, as plotted <strong>in</strong> Fig. 9.F<strong>in</strong>ally, coefficient A was found to be equal to 1.6 and B to 0.68.Those values were used <strong>in</strong> Eqs. (4) and (5), implemented <strong>in</strong> Humimur,for simulati<strong>on</strong>s <str<strong>on</strong>g>of</str<strong>on</strong>g> <strong>mass</strong> flow <strong>in</strong> the material with the effect <str<strong>on</strong>g>of</str<strong>on</strong>g><str<strong>on</strong>g>hysteresis</str<strong>on</strong>g>.Even if the values <str<strong>on</strong>g>of</str<strong>on</strong>g> A and B coefficients fit well theexperimental data, the fully empirical procedure <str<strong>on</strong>g>of</str<strong>on</strong>g> selecti<strong>on</strong> isnot satisfactory from the theoretical po<strong>in</strong>t <str<strong>on</strong>g>of</str<strong>on</strong>g> view. It is still apresent challenge to enhance understand<strong>in</strong>g and modell<strong>in</strong>g <str<strong>on</strong>g>of</str<strong>on</strong>g>Water c<strong>on</strong>tent [kg/kg]0.0180desorpti<strong>on</strong> 79.5-33%0.0160adsorpti<strong>on</strong>0.0140desorpti<strong>on</strong>0.01200.01000.00800.00600.00400.00200.00000.00 0.10 0.20 0.30 0.40 0.50 0.60 0.70 0.80<str<strong>on</strong>g>hysteresis</str<strong>on</strong>g>. It seems <strong>in</strong>terest<strong>in</strong>g to exploit micro-structural properties,such as pore-size distributi<strong>on</strong>.5.2. Simulati<strong>on</strong>s and resultsIn this part <str<strong>on</strong>g>of</str<strong>on</strong>g> the paper the results <str<strong>on</strong>g>of</str<strong>on</strong>g> <strong>mass</strong> flow calculati<strong>on</strong> forthe model with the <str<strong>on</strong>g>hysteresis</str<strong>on</strong>g> effect are presented. The simulati<strong>on</strong>swere d<strong>on</strong>e for gypsum board from Test 1 (Table 1), withthickness <str<strong>on</strong>g>of</str<strong>on</strong>g> the sample l ¼ 12.5 mm, number <str<strong>on</strong>g>of</str<strong>on</strong>g> layers z ¼ 5, timestep ¼ 60 s, and period <str<strong>on</strong>g>of</str<strong>on</strong>g> calculati<strong>on</strong> ¼ 360 h. The boundaryc<strong>on</strong>diti<strong>on</strong>, ambient relative humidity, was described by as<strong>in</strong>usoidal functi<strong>on</strong> with a 24-h period, oscillat<strong>in</strong>g between 30%and 50%. The <strong>in</strong>itial relative humidity <strong>in</strong> the material was equal to40%. In Fig. 10, water c<strong>on</strong>tent <strong>in</strong> the middle layer <str<strong>on</strong>g>of</str<strong>on</strong>g> the material isplotted.The darker l<strong>in</strong>e describes the process <str<strong>on</strong>g>of</str<strong>on</strong>g> change <strong>in</strong> waterc<strong>on</strong>tent when at the beg<strong>in</strong>n<strong>in</strong>g the desorpti<strong>on</strong> process appears.The lighter l<strong>in</strong>e depicts the process start<strong>in</strong>g with adsorpti<strong>on</strong>. Alarge difference can be seen dur<strong>in</strong>g several <strong>in</strong>itial cycles betweenthe two situati<strong>on</strong>s. However, after several cycles (approximately12 here), the material water c<strong>on</strong>tent is predictably at the samelevel <strong>in</strong> both situati<strong>on</strong>s.Additi<strong>on</strong>al simulati<strong>on</strong>s <str<strong>on</strong>g>of</str<strong>on</strong>g> the <strong>mass</strong> flow <strong>in</strong> the material wereperformed with different levels <str<strong>on</strong>g>of</str<strong>on</strong>g> relative humidity: for the first 7days it was vary<strong>in</strong>g s<strong>in</strong>usoidaly between 55% and 45% and for thenext week between 50% and 40%. Fig. 11 shows that moisturec<strong>on</strong>tent <strong>in</strong> the material, as expected, is situated <strong>in</strong> between thecurves <str<strong>on</strong>g>of</str<strong>on</strong>g> adsorpti<strong>on</strong> and desorpti<strong>on</strong>, and the shape <str<strong>on</strong>g>of</str<strong>on</strong>g> the curve issimilar to previous results from the literature [12].6. Impact <str<strong>on</strong>g>of</str<strong>on</strong>g> <str<strong>on</strong>g>hysteresis</str<strong>on</strong>g>Relative humidity [-]0.901.00Fig. 9. Curves <str<strong>on</strong>g>of</str<strong>on</strong>g> primary sorpti<strong>on</strong> and desorpti<strong>on</strong> isotherms, and sec<strong>on</strong>ddesorpti<strong>on</strong> isotherm from [24].To dem<strong>on</strong>strate the <str<strong>on</strong>g><strong>in</strong>fluence</str<strong>on</strong>g> <str<strong>on</strong>g>of</str<strong>on</strong>g> sorpti<strong>on</strong> <str<strong>on</strong>g>hysteresis</str<strong>on</strong>g> effect <strong>on</strong>water vapour transport <strong>in</strong> build<strong>in</strong>g materials, series <str<strong>on</strong>g>of</str<strong>on</strong>g> simulati<strong>on</strong>s<str<strong>on</strong>g>of</str<strong>on</strong>g> the 12.5-mm-thick gypsum board were performed. The samematerial and same boundary c<strong>on</strong>diti<strong>on</strong>s were used with twomodels: with and without <str<strong>on</strong>g>hysteresis</str<strong>on</strong>g> effect. The c<strong>on</strong>vecti<strong>on</strong> <strong>mass</strong><strong>transfer</strong> coefficient b and temperature were the same as thoseused <strong>in</strong> Test 1 (Tables 1 and 2), but the relative humidity <strong>in</strong> the airwas chang<strong>in</strong>g s<strong>in</strong>usoidally between 45% and 55%. The calculati<strong>on</strong>swere made for four variants (see Fig. 12): Hysteresis: The model with <str<strong>on</strong>g>hysteresis</str<strong>on</strong>g> effect. Adsorpti<strong>on</strong>: Model without the <str<strong>on</strong>g>hysteresis</str<strong>on</strong>g> effect. The dependencybetween the relative humidity and the water c<strong>on</strong>tent isdescribed by the adsorpti<strong>on</strong> isotherm.