Hyperspectral Vegetation Indices and Their Relationships with ...
Hyperspectral Vegetation Indices and Their Relationships with ...
Hyperspectral Vegetation Indices and Their Relationships with ...
- No tags were found...
You also want an ePaper? Increase the reach of your titles
YUMPU automatically turns print PDFs into web optimized ePapers that Google loves.
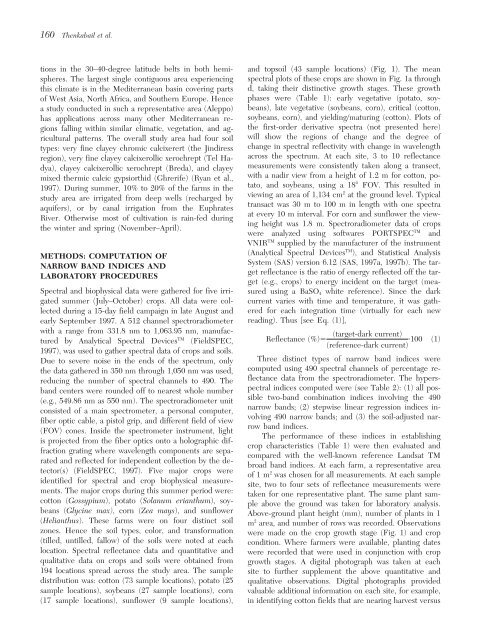
160 Thenkabail et al.tions in the 30–40-degree latitude belts in both hemi- <strong>and</strong> topsoil (43 sample locations) (Fig. 1). The meanspheres. The largest single contiguous area experiencing spectral plots of these crops are shown in Fig. 1a throughthis climate is in the Mediterranean basin covering parts d, taking their distinctive growth stages. These growthof West Asia, North Africa, <strong>and</strong> Southern Europe. Hence phases were (Table 1): early vegetative (potato, soy-a study conducted in such a representative area (Aleppo) beans), late vegetative (soybeans, corn), critical (cotton,has applications across many other Mediterranean rethesoybeans, corn), <strong>and</strong> yielding/maturing (cotton). Plots ofgions falling <strong>with</strong>in similar climatic, vegetation, <strong>and</strong> agwillfirst-order derivative spectra (not presented here)ricultural patterns. The overall study area had four soilshow the regions of change <strong>and</strong> the degree oftypes: very fine clayey chromic calcixerert (the Jindiress change in spectral reflectivity <strong>with</strong> change in wavelengthregion), very fine clayey calcixerollic xerochrept (Tel Hameasurementsacross the spectrum. At each site, 3 to 10 reflectancewere consistently taken along a transect,dya), clayey calcixerollic xerochrept (Breda), <strong>and</strong> clayeymixed thermic calcic gypsiorthid (Ghrerife) (Ryan et al., <strong>with</strong> a nadir view from a height of 1.2 m for cotton, po-1997). During summer, 10% to 20% of the farms in the tato, <strong>and</strong> soybeans, using a 18 FOV. This resulted instudy area are irrigated from deep wells (recharged byviewing an area of 1,134 cm 2 at the ground level. Typicalaquifers), or by canal irrigation from the Euphratestransact was 30 m to 100 m in length <strong>with</strong> one spectraat every 10 m interval. For corn <strong>and</strong> sunflower the view-River. Otherwise most of cultivation is rain-fed duringing height was 1.8 m. Spectroradiometer data of cropsthe winter <strong>and</strong> spring (November–April).were analyzed using softwares PORTSPEC TM <strong>and</strong>VNIR TM supplied by the manufacturer of the instrumentMETHODS: COMPUTATION OF(Analytical Spectral Devices TM ), <strong>and</strong> Statistical AnalysisNARROW BAND INDICES ANDSystem (SAS) version 6.12 (SAS, 1997a, 1997b). The targetreflectance is the ratio of energy reflected off the tar-LABORATORY PROCEDURESget (e.g., crops) to energy incident on the target (mea-Spectral <strong>and</strong> biophysical data were gathered for five irri- sured using a BaSO 4 white reference). Since the darkgated summer (July–October) crops. All data were coleredcurrent varies <strong>with</strong> time <strong>and</strong> temperature, it was gath-lected during a 15-day field campaign in late August <strong>and</strong>for each integration time (virtually for each newearly September 1997. A 512 channel spectroradiometer reading). Thus [see Eq. (1)],<strong>with</strong> a range from 331.8 nm to 1,063.95 nm, manufac-(target-dark tured by Analytical Spectral Devices TM (FieldSPEC, Reflectance (%)(1)(reference-dark current)·1001997), was used to gather spectral data of crops <strong>and</strong> soils.Due to severe noise in the ends of the spectrum, only Three distinct types of narrow b<strong>and</strong> indices werethe data gathered in 350 nm through 1,050 nm was used, computed using 490 spectral channels of percentage rereducingthe number of spectral channels to 490. The flectance data from the spectroradiometer. The hypersb<strong>and</strong>centers were rounded off to nearest whole number pectral indices computed were (see Table 2): (1) all pos-(e.g., 549.86 nm as 550 nm). The spectroradiometer unitsible two-b<strong>and</strong> combination indices involving the 490consisted of a main spectrometer, a personal computer,narrow b<strong>and</strong>s; (2) stepwise linear regression indices in-volving 490 narrow b<strong>and</strong>s; <strong>and</strong> (3) the soil-adjusted narfiberoptic cable, a pistol grip, <strong>and</strong> different field of viewrow b<strong>and</strong> indices.(FOV) cones. Inside the spectrometer instrument, lightThe performance of these indices in establishingis projected from the fiber optics onto a holographic difcropcharacteristics (Table 1) were then evaluated <strong>and</strong>fraction grating where wavelength components are sepacompared<strong>with</strong> the well-known reference L<strong>and</strong>sat TMrated <strong>and</strong> reflected for independent collection by the debroadb<strong>and</strong> indices. At each farm, a representative areatector(s) (FieldSPEC, 1997). Five major crops wereof 1 m 2 was chosen for all measurements. At each sampleidentified for spectral <strong>and</strong> crop biophysical measuresite,two to four sets of reflectance measurements werements. The major crops during this summer period were:taken for one representative plant. The same plant samcotton(Gossypium), potato (Solanum erianthum), soy- ple above the ground was taken for laboratory analysis.beans (Glycine max), corn (Zea mays), <strong>and</strong> sunflower Above-ground plant height (mm), number of plants in 1(Helianthus). These farms were on four distinct soil m 2 area, <strong>and</strong> number of rows was recorded. Observationszones. Hence the soil types, color, <strong>and</strong> transformation were made on the crop growth stage (Fig. 1) <strong>and</strong> crop(tilled, untilled, fallow) of the soils were noted at each condition. Where farmers were available, planting dateslocation. Spectral reflectance data <strong>and</strong> quantitative <strong>and</strong> were recorded that were used in conjunction <strong>with</strong> cropqualitative data on crops <strong>and</strong> soils were obtained from growth stages. A digital photograph was taken at each194 locations spread across the study area. The sample site to further supplement the above quantitative <strong>and</strong>distribution was: cotton (73 sample locations), potato (25 qualitative observations. Digital photographs providedsample locations), soybeans (27 sample locations), corn valuable additional information on each site, for example,(17 sample locations), sunflower (9 sample locations), in identifying cotton fields that are nearing harvest versus


