QSAR and ADME - INCT-Inofar
QSAR and ADME - INCT-Inofar
QSAR and ADME - INCT-Inofar
- No tags were found...
You also want an ePaper? Increase the reach of your titles
YUMPU automatically turns print PDFs into web optimized ePapers that Google loves.
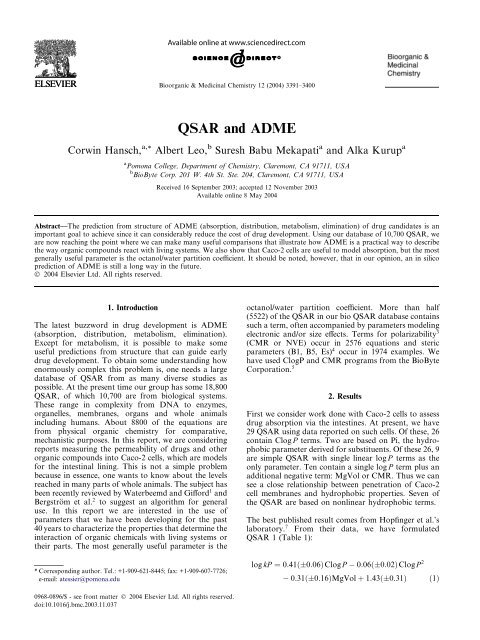
Bioorganic & Medicinal Chemistry 12 (2004) 3391–3400<strong>QSAR</strong> <strong>and</strong> <strong>ADME</strong>Corwin Hansch, a, *Albert Leo, b Suresh Babu Mekapati a <strong>and</strong> Alka Kurup aa Pomona College, Department of Chemistry, Claremont, CA 91711, USAb BioByte Corp. 201 W. 4th St. Ste. 204, Claremont, CA 91711, USAReceived 16 September 2003; accepted 12 November 2003Available online 8 May 2004Abstract—The prediction from structure of <strong>ADME</strong> (absorption, distribution, metabolism, elimination) of drug c<strong>and</strong>idates is animportant goal to achieve since it can considerably reduce the cost of drug development. Using our database of 10,700 <strong>QSAR</strong>, weare now reaching the point where we can make many useful comparisons that illustrate how <strong>ADME</strong> is a practical way to describethe way organic compounds react with living systems. We also show that Caco-2 cells are useful to model absorption, but the mostgenerally useful parameter is the octanol/water partition coefficient. It should be noted, however, that in our opinion, an in silicoprediction of <strong>ADME</strong> is still a long way in the future.Ó 2004 Elsevier Ltd. All rights reserved.1. IntroductionThe latest buzzword in drug development is <strong>ADME</strong>(absorption, distribution, metabolism, elimination).Except for metabolism, it is possible to make someuseful predictions from structure that can guide earlydrug development. To obtain some underst<strong>and</strong>ing howenormously complex this problem is, one needs a largedatabase of <strong>QSAR</strong> from as many diverse studies aspossible. At the present time our group has some 18,800<strong>QSAR</strong>, of which 10,700 are from biological systems.These range in complexity from DNA to enzymes,organelles, membranes, organs <strong>and</strong> whole animalsincluding humans. About 8800 of the equations arefrom physical organic chemistry for comparative,mechanistic purposes. In this report, we are consideringreports measuring the permeability of drugs <strong>and</strong> otherorganic compounds into Caco-2 cells, which are modelsfor the intestinal lining. This is not a simple problembecause in essence, one wants to know about the levelsreached in many parts of whole animals. The subject hasbeen recently reviewed by Waterbeemd <strong>and</strong> Gifford 1 <strong>and</strong>Bergstr€om et al. 2 to suggest an algorithm for generaluse. In this report we are interested in the use ofparameters that we have been developing for the past40 years to characterize the properties that determine theinteraction of organic chemicals with living systems ortheir parts. The most generally useful parameter is theoctanol/water partition coefficient. More than half(5522) of the <strong>QSAR</strong> in our bio <strong>QSAR</strong> database containssuch a term, often accompanied by parameters modelingelectronic <strong>and</strong>/or size effects. Terms for polarizability 3(CMR or NVE) occur in 2576 equations <strong>and</strong> stericparameters (B1, B5, Es) 4 occur in 1974 examples. Wehave used ClogP <strong>and</strong> CMR programs from the BioByteCorporation. 52. ResultsFirst we consider work done with Caco-2 cells to assessdrug absorption via the intestines. At present, we have29 <strong>QSAR</strong> using data reported on such cells. Of these, 26contain Clog P terms. Two are based on Pi, the hydrophobicparameter derived for substituents. Of these 26, 9are simple <strong>QSAR</strong> with single linear log P terms as theonly parameter. Ten contain a single log P term plus anadditional negative term: MgVol or CMR. Thus we cansee a close relationship between penetration of Caco-2cell membranes <strong>and</strong> hydrophobic properties. Seven ofthe <strong>QSAR</strong> are based on nonlinear hydrophobic terms.The best published result comes from Hopfinger et al.’slaboratory. 7 From their data, we have formulated<strong>QSAR</strong> 1 (Table 1):* Corresponding author. Tel.: +1-909-621-8445; fax: +1-909-607-7726;e-mail: atessier@pomona.edulog kP ¼ 0:41ð0:06ÞClog P 0:06ð0:02ÞClogP 20:31ð0:16ÞMgVol þ 1:43ð0:31Þð1Þ0968-0896/$ - see front matter Ó 2004 Elsevier Ltd. All rights reserved.doi:10.1016/j.bmc.2003.11.037
3392 C. Hansch et al. / Bioorg. Med. Chem. 12 (2004) 3391–3400Table 1. Results with <strong>QSAR</strong> 1log kP Y Pred Dev Clog P MgVol1 Diazepam 1.52 1.45 0.07 2.96 2.072 Caffeine 1.49 0.98 0.51 )0.04 1.363 Phenytoin 1.43 1.43 0.00 2.09 1.874 Alprenolol 1.40 1.41 0.00 2.65 2.165 Testosterone 1.40 1.37 0.03 3.41 2.386 Phencyclidine 1.39 1.25 0.14 5.10 2.157 Desipramine 1.38 1.33 0.06 4.47 2.268 Metoprolol 1.37 1.19 0.18 1.49 2.269 Progesterone 1.37 1.27 0.11 3.97 2.6210 Salicyclic acid 1.34 1.72 )0.38 2.19 0.9911 Clonidine 1.39 1.41 )0.02 1.43 1.5312 Corticosterone 1.33 1.21 0.11 2.51 2.7413 Indomethacin 1.31 1.28 0.03 4.18 2.5314 Chlorpromazine 1.30 1.13 0.17 5.30 2.4115 Nicotine 1.29 1.31 )0.02 0.88 1.3716 Estradiol 1.23 1.41 )0.18 3.78 2.2017 Pindolol 1.22 1.31 )0.09 1.67 2.0118 Hydrocortisone 1.15 1.11 0.04 1.89 2.8019 Timolol 1.11 1.09 0.02 1.21 2.3820 Dexamethasone 1.09 1.05 0.04 1.79 2.9121 Scopolamine 1.07 0.84 0.23 0.29 2.2322 Dopamine 0.97 1.11 )0.14 0.17 1.2223 Labetalol 0.97 1.24 )0.27 2.50 2.6424 Bremazocine 0.90 1.29 )0.39 3.82 2.5825 Nadolol 0.59 0.79 )0.20 0.38 2.4926 Atenolol )0.28 0.70 )0.98 )0.11 2.1827 Terbutaline )0.33 1.03 )1.36 0.48 1.8428 Ganciclovir )0.42 )0.54 0.12 )2.54 1.7229 Sulfasalazine )0.52 1.25 )1.77 3.88 2.7030 Acyclovir )0.60 )0.40 )0.21 )2.42 1.5231 Aminopyrine 1.56 1.20 0.36 1.04 1.8732 Propranolol 1.34 1.42 )0.08 2.75 2.1533 Warfarin 1.32 1.38 )0.05 2.90 2.3134 Meloxicam 1.29 1.32 )0.03 2.29 2.3235 Zidovudine 0.84 0.87 )0.03 0.04 1.8236 Urea 0.66 0.44 0.22 )1.66 0.4637 Sucrose 0.23 )1.11 1.34 )3.09 2.2338 Mannitol )0.42 )0.07 )0.35 )2.05 1.31 Outliers.n ¼ 34, r 2 ¼ 0:870, s ¼ 0:205, q 2 ¼ 0:820, optimumClog P ¼ 3:35, outliers: atenolol terbutaline, sulfasalazine,sucrose.In the above <strong>QSAR</strong>, kP is the rate of permeability <strong>and</strong>MgVol is the molecular volume of the molecule. Itsnegative coefficient shows that size of the molecule canhave a role to play in penetration. Hopfinger’s groupobtained a <strong>QSAR</strong> of similar quality using differentparameters that do not allow us to make comparisonswith our studies on membrane penetration.Turning now to other examples from the literaturewhere it was possible to establish optimum values forlog P for penetration is Caco2 cells, we find four examples.<strong>QSAR</strong> 2 was derived from data of Bravi <strong>and</strong>Wikel 8 for miscellaneous drugs (Table 2):logPerm ¼ 1:35ð0:36ÞClogP2:90ð0:82Þbilin ClogP0:62ð0:58ÞI-COOH þ 6:73ð0:55Þð2Þn ¼ 15, r 2 ¼ 0:905, s ¼ 0:376, q 2 ¼ 0:782, optimumClog P ¼ 2:40.Perm ¼ permeability factor. The indicator variable I-COOH is assigned the value of 1 for compounds containinga carboxylic acid moiety. Clog P calculates theneutral value for such acids. The bilinear term 8 in <strong>QSAR</strong>indicates that activity first increases linearly up to aninflection point <strong>and</strong> then decreases linearly, in contrastto the symmetrical curve of where log P 2 describes aparabola.Data from Tantishaiyakul 9 for miscellaneous drugs(Table 3):logPerm ¼ 0:54ð0:08ÞClogP0:55ð0:11Þbilin ClogP 5:09 ð3Þn ¼ 39, r 2 ¼ 0:880, s ¼ 0:200, q 2 ¼ 0:859, optimumClog P ¼ 2:35, outliers: sucrose, urea, sulfastalazine,chlorothiazole, pirenzepine, terbutaline, ranitidine,Table 2. Results with <strong>QSAR</strong> 2logPerm Y Pred Perm Dev Clog P I-COOH1 Corticosterone )4.26 )4.27 0.01 2.32 0.002 Testosterone )4.29 )4.77 0.48 3.22 0.003 Propanol )4.38 )4.36 0.01 2.75 0.004 Alprenolol )4.39 )4.31 )0.08 2.65 0.005 Warfarin )4.42 )4.46 0.05 2.90 0.006 Metoprolol )4.57 )5.00 0.43 1.35 0.007 Felodipine )4.64 )15.34 10.69 5.58 0.008 Hydrocortisone )4.67 )4.63 )0.04 1.70 0.009 Dexamethasone )4.90 )4.55 )0.35 1.79 0.0010 Salicylic acid )4.92 )4.92 )0.01 2.19 1.0011 Acetylsalicylic acid )5.62 )6.00 0.38 1.02 1.0012 Practolol )6.05 )5.73 )0.32 0.75 0.0013 Terbutaline )6.42 )6.09 )0.33 0.48 0.0014 Atenolol )6.70 )6.88 0.18 )0.11 0.0015 Mannitol )6.75 )15.42 8.68 )2.05 0.0016 Sulfasalazine )6.89 )6.25 )0.64 3.88 1.0017 Olsalazine )6.96 )7.22 0.26 4.54 1.00 Outliers.
C. Hansch et al. / Bioorg. Med. Chem. 12 (2004) 3391–3400 3393Table 3. Results with <strong>QSAR</strong> 3logPermLogPermPredDevC log P1 Acebutalol )6.29 )5.11 )1.18 1.712 Acetylsalicylic acid )5.04 )4.77 )0.27 1.023 Acylovir )6.60 )6.39 )0.21 )2.424 Alprenolol )4.60 )4.68 0.08 2.655 Aminopyrine )4.44 )4.89 0.45 0.576 Atenolol )6.28 )5.20 )1.08 )0.117 Bremazocine )5.10 )4.70 )0.40 3.828 Caffeine )4.51 )5.13 0.62 )0.049 Chlorothiazole )6.72 )5.40 )1.32 )0.2910 Chlorpromazine )4.70 )4.73 0.03 )5.8011 Cimetidine )5.86 )5.09 )0.77 0.3512 Clonidine )4.66 )4.71 0.05 1.4313 Corticosterone )4.67 )4.68 0.01 2.3214 Desipramine )4.61 )4.71 0.10 4.4715 Dexamethasone )4.91 )4.69 )0.22 1.7916 Diazepam )4.48 )4.69 0.21 3.1717 Dopamine )5.03 )5.04 0.01 0.1718 Estradiol )4.77 )4.70 )0.07 3.7819 Ganciclovir )6.42 )6.45 0.03 )2.5420 Griseofulvin )4.44 )4.69 0.25 1.9121 Hydrochlorthiazide )6.29 )5.48 )0.81 )0.3622 Hydrocortisone )4.85 )4.69 )0.16 1.7023 Indomethacin )4.69 )4.70 0.01 4.1824 Labetalol )5.03 )4.68 )0.35 2.5025 Mannitol )6.42 )6.18 )0.24 )2.0526 Meloxicam )4.71 )4.68 )0.03 2.2927 Methyl scopolamine )6.16 )6.41 0.25 )2.4728 Metoprolol )4.63 )4.71 0.08 1.4929 Nadolol )5.41 )4.96 )0.45 0.3830 Nevirapine )4.52 )4.68 0.16 2.4231 Nicotine )4.71 )4.80 0.09 0.8832 Phenycylidine )4.61 )4.72 )0.11 5.1033 Phenytoin )4.57 )4.68 0.24 2.0934 Pindolol )4.78 )4.69 0.07 1.6735 Pirenzepine )6.36 )5.09 0.02 0.1636 Piroxicam )4.45 )4.69 )1.22 1.8937 Progesterone )4.63 )4.70 0.02 3.7838 Propranolol )4.66 )4.68 0.06 2.7539 Ranitidine )6.31 )5.09 2.68 0.6340 Salicylic acid )4.66 )4.68 )1.38 2.1941 Scopolamine )4.93 )4.99 )0.07 0.2942 Sucrose )5.77 )8.45 )1.24 )3.0943 Sulfasalazine )6.52 )5.14 0.09 3.8844 Telmisartan )4.82 )4.75 )0.19 7.4645 Terbutaline )6.33 )5.09 )0.28 0.4846 Testosterone )4.60 )4.69 1.55 3.2247 Timolol )4.89 )4.70 0.00 1.5848 Uracil )5.37 )5.65 )1.06 )1.0649 Urea )5.34 )6.89 )1.66 )1.6650 Warfarin )4.68 )4.68 2.90 2.9051 Zidovudine )5.16 )5.10 0.04 0.04 Outliers.acebutalol, hydrochlorothiazide, cimetidine, caffeine,atenolol.This is not a very good correlation because of thenumber of outliers. However, optimum Clog P isessentially the same as for <strong>QSAR</strong> 3.Data from Bergstrom et al. 10 for miscellaneous drugs(Table 4):log k ¼ 0:57ð0:11ÞC logP1:01ð0:58Þbilin ClogP0:11ð0:06ÞCMR þ 1:53ð0:64Þð4Þn ¼ 19, r 2 ¼ 0:931, s ¼ 0:368, q 2 ¼ 0:871, optimumClog P ¼ 3:80, outliers: amiloride, methotrexate,tamoxifen, theophylline.Perm ¼ permeability rate. The optimum Clog P for<strong>QSAR</strong> 4 is significantly higher than for <strong>QSAR</strong> 3, <strong>and</strong> inthis respect it is more like <strong>QSAR</strong> 1.Data from Yamashita et al. 11 for miscellaneous chemicals<strong>and</strong> drugs (Table 5):log kPerm ¼ 0:65ð0:19ÞC logP0:85ð0:37Þbilin ClogP0:12ð0:04ÞCMR 4:75ð0:41Þ ð5Þn ¼ 21, r 2 ¼ 0:837, s ¼ 0:329, q 2 ¼ 0:620, optimumClog P ¼ 2:83, outliers: acyclovir, caffeine, fluconazole,naloxone, trovafloxacin.Perm ¼ apparent permeability rate. The CMR (calculatedpolarizability) term can be ambivalent in that itdoes contain volume <strong>and</strong> polarizability componentspresent in the Lorentz–Lorenz equation: MR ¼ n 2 1=n 2 þ 2ðMW=dÞ; where n ¼ refractive index, d ¼ density<strong>and</strong> MW ¼ molecular weight.It is of interest that <strong>QSAR</strong> 2-5 are all bilinear equations.That is, activity first increases linearly <strong>and</strong> thendecreases linearly. This is in contrast to <strong>QSAR</strong> where wefind a parabolic relationship. The optimum valuesare 3.35, 2.40, 2.35, 3.80 <strong>and</strong> 2.80––giving an averagevalue at 2.94. Thus, we see that log P is a most significantparameter in describing Caco-2 absorption ofdrugs. In fact, since it can be calculated rapidly, it isa time-saving approach to study absorption comparedto measurements of penetration rate using Caco-2cells.2.1. Intestinal adsorptionFor a drug administered orally, the first step is intestinalabsorption. This process can be compared with the<strong>QSAR</strong> for the penetration of Caco-2 cells (<strong>QSAR</strong> 1-5).Data from Bermjo et al. 12 Rate of absorption by smallintestine of male wister rat (Table 6):log k ¼ 0:44ð0:04Þ log Pþ 0:30ð0:03Þ0:47ð0:08Þbilin logPð6Þn ¼ 16, r 2 ¼ 0:988, s ¼ 0:045, q 2 ¼ 0:984, optimumlog P ¼ 2:44. log P values were experimentally determined.
3394 C. Hansch et al. / Bioorg. Med. Chem. 12 (2004) 3391–3400Table 4. Results with <strong>QSAR</strong> 4log k Y Pred Dev Clog P CMR1 Acyclovir )0.92 )0.45 )0.47 )2.42 5.452 Amiloride )0.49 0.89 )1.39 0.11 5.393 Amitryptyline 2.10 2.09 0.01 4.85 9.154 Amoxacillin )0.74 )0.56 )0.18 )1.87 9.35 Atropine 1.29 1.38 )0.09 1.30 8.156 Chlorpromazine 1.86 1.88 )0.02 5.30 9.387 Ciprofloxacin 0.88 0.16 0.73 )0.73 8.728 Desipramine 2.01 2.28 )0.28 4.47 8.549 Doxycyline 0.35 0.02 0.33 )0.50 11.2910 Ergonovine 0.83 1.20 )0.36 1.23 9.3711 Erythromycin 0.05 0.35 )0.30 1.61 18.9312 Ethinyl estradiol 2.58 2.39 0.19 3.86 8.6513 Folinic acid )1.52 )1.61 0.09 )3.22 11.8614 Indomethacine 2.04 2.25 )0.21 4.18 9.5115 Methothrexate )1.52 )0.59 )0.93 )0.53 11.6416 Phenazopyridine 2.45 1.95 0.51 2.05 6.7417 Primaquine 2.25 2.11 0.13 2.60 7.8418 Promethazine 2.22 2.26 )0.04 4.40 8.8919 Tamoxifen –– )2.79 –– 6.82 12.0720 Theophylline 1.83 0.98 0.84 )0.03 4.5321 Verapamil 2.19 1.77 0.42 4.47 13.1522 Warfarin 1.77 2.16 )0.39 2.9 8.7223 Zidovudine 0.79 0.86 )0.07 0.04 6.36 Outliers.Table 5. Results with <strong>QSAR</strong> 5log kP Y Pred Dev CMR Clog P1 Acetylsalicylic acid )4.51 )4.61 0.10 4.46 1.022 Acyclovir )5.70 )9.01 3.31 5.45 )2.423 Azithromycin )5.98 )5.72 )0.26 19.73 2.644 Caffeine )4.30 )5.38 1.08 4.99 )0.045 Chloramphenicol )4.69 )4.78 0.09 7..31 1.286 Cimetidine )5.51 )5.30 )0.21 6.90 0.387 Clonidine )4.52 )4.53 0.01 5.81 1.438 Desipramine )4.67 )4.66 )0.01 8.54 4.479 Dexamethasone )4.63 )4.84 0.21 10.07 1.7910 Diazepam )4.15 )4.38 0.23 8.12 2.9611 Doxorubicin )6.80 )6.08 )0.72 13.33 0.3212 Erythromycin )5.43 )5.94 0.51 18.93 1.6113 Fluconazole )4.53 )6.25 1.72 7.30 )0.4414 Ibuprofen )4.28 )4.23 )0.05 6.12 3.6815 Imipramine )4.85 )4.82 )0.03 9.01 5.0416 Mannitol )6.19 )6.52 0.33 3.88 )2.0517 Naloxone )4.55 )5.78 1.23 8.68 0.1618 Prazocin )4.36 )4.75 0.39 10.20 2.0319 Propranolol )4.56 )4.34 )0.22 7.83 2.7520 Quinidine )4.69 )4.53 )0.16 9.48 2.7921 Sumatriptan )5.52 )5.21 )0.31 8.20 0.7422 Tenidap )4.29 )4.45 0.16 8.27 2.3023 Testosterone )4.14 )4.44 0.30 8.27 3.4124 Trovafloxacin )4.52 )6.17 1.65 10.04 )0.1825 Valproic acid )4.32 )3.91 )0.41 4.08 2.7626 Ziprasidone )4.91 )4.94 0.03 11.47 4.21 Outliers.Intestinal absorption of miscellaneous drugs by humanintestine. Data from Norinder <strong>and</strong> Osterberg 13 (Table 7):n ¼ 18, r 2 ¼ 0:876, s ¼ 0:707, q 2 ¼ 0:752, optimumlog P ¼ 2:00, outliers: metolazone, sulpride.log A ¼ 0:79ð0:18ÞC logP2:86ð0:70Þbilin ClogP þ 1:12ð0:41Þð7ÞThe agreement in optimum log P is good between <strong>QSAR</strong>6 <strong>and</strong> 7 <strong>and</strong> they are in line with some of the results withCaco-2 cells. There is no reason to expect quantitative
C. Hansch et al. / Bioorg. Med. Chem. 12 (2004) 3391–3400 3395Table 6. Results with <strong>QSAR</strong> 6X Y log k Y Pred Dev Mlog P1 C 2 H 5 H )0.38 )0.38 0.00 )1.552 C 2 H 5 n-Methyl 0.28 0.40 )0.12 0.273 C 2 H 5 n-Ethyl 0.44 0.43 0.01 0.374 C 2 H 5 n-Propyl 0.61 0.65 )0.04 1.055 C 2 H 5 n-Butyl 0.75 0.74 0.01 1.486 C 2 H 5 n-Pentyl 0.76 0.78 )0.02 2.117 C 2 H 5 n-Hexyl 0.78 0.78 0.00 2.718 C 2 H 5 n-Heptyl 0.78 0.77 0.01 3.229 Cy-C 3 H 5 H )0.20 )0.20 0.00 )1.1210 Cy-C 3 H 5 n-Methyl 0.41 0.35 0.06 0.1511 Cy-C 3 H 5 n-Ethyl 0.55 0.49 0.06 0.5312 Cy-C 3 H 5 n-Propyl 0.68 0.66 0.02 1.0713 Cy-C 3 H 5 n-Butyl 0.76 0.74 0.02 1.5514 Cy-C 3 H 5 n-Pentyl 0.78 0.78 0.00 2.0615 Cy-C 3 H 5 n-Hexyl 0.78 0.78 0.00 2.5616 Cy-C 3 H 5 n-Heptyl 0.78 0.78 0.00 3.02Table 7. Results with <strong>QSAR</strong> 7log A Y Pred Dev Clog P1 Atenolol 0.13 1.03 )0.90 )0.112 Ciprofloxacin 0.66 0.54 0.12 )0.733 Foscarnet )1.24 )0.60 )0.64 )2.174 Mannitol )0.85 )0.50 )0.35 )2.055 Nordiazepam 2.29 1.51 0.78 3.026 Olsalazine )2.17 )2.65 0.48 5.177 Oxazepam 2.11 2.23 )0.12 2.318 Oxprenolol 2.11 2.29 )0.18 2.099 Phenazone 2.11 1.27 0.84 0.2010 Practolol 1.95 1.69 0.26 0.7511 Raffinose )2.37 )3.09 0.72 )5.3212 Sulfasalazine )1.49 )0.03 )1.46 3.8813 Tranexamic acid 0.17 )0.31 0.48 )1.8014 Alprenolol 2.02 1.97 0.05 2.6515 Diazepam 2.11 1.59 0.52 2.9616 Lactulose )2.33 )1.72 )0.61 )3.5917 Metolazone 0.48 )3.13 3.61 2.0618 Metoprolol 2.64 2.15 0.49 1.4919 Pindolol 1.73 2.23 )0.50 1.6720 Sulpride )0.48 )1.18 0.70 1.11 Outliers.Table 8. Results with <strong>QSAR</strong> 8log k Y Pred Dev Mlog P Bilin1 Aniline 0.75 0.73 0.02 0.90 0.002 2-Methylaniline 0.78 0.79 )0.01 1.32 0.013 4-Methylaniline 0.81 0.80 0.01 1.39 0.014 2,4-Dimethylaniline 0.80 0.84 )0.04 1.68 0.025 4-Ethylaniline 0.87 0.87 0.00 1.96 0.046 4-Isopropylaniline 0.81 )0.07 0.88 2.23 2.237 1-Naphthylamine 0.92 0.89 0.02 2.25 0.088 2-Naphthylamine 0.92 0.90 0.02 2.28 0.089 4-Propylaniline 0.90 0.90 0.00 2.40 0.1010 4-Aminobiphenol 0.89 0.90 )0.01 2.86 0.2511 4-Terbutylaniline 0.83 )0.21 1.04 2.70 2.7012 4-Betylaniline 0.82 )0.32 1.13 3.05 3.0513 4-Cyclohexylaniline 0.79 0.79 0.00 3.65 0.77 Outliers.agreement. Qualitative agreement is all one can reasonablyexpect.Absorption of miscellaneous aromatic amines by rat smallintestine. Data from Martin–Willadre 14 (Table 8):
3396 C. Hansch et al. / Bioorg. Med. Chem. 12 (2004) 3391–3400log k ¼ 0:14ð0:05Þ log P 0:45ð0:16Þbilin logPþ 0:61ð0:07Þð8Þn ¼ 10, r 2 ¼ 0:910, s ¼ 0:023, q 2 ¼ 0:815, optimumlog P ¼ 2:6, outliers: 4-isopropylamine, 4-tertbutylaniline,4-betylaniline.k is the absorption rate. Thus, we find rather goodagreement in three examples for the dominant role ofhydrophobicity in determining the rate of intestinalabsorption. All have similar optimum values, despitebeing compounds of quite varied structure. While penetrationrates into Caco-2 cells can still be used to modelthe absorption process, it would be much more economicalin time <strong>and</strong> money to use Clog P values.2.2. Drug distributionDrug distribution is a more difficult process to characterize.There are many different compartments in thebody so that it is hard to generalize from the analysis ofa single site. Some time ago, we elected to consider drugsacting on the central nervous system, since a widevariety of compounds have been studied for CNS effects.A considerable number of <strong>QSAR</strong> studies indicate thatthere is an optimal hydrophobicity for CNS agents. Inthese studies, it was generally assumed that the measuredCNS depression is directly proportional to theconcentration in the brain. A very important conclusionfrom these studies is that the optimum log P was 2 ± 0.05for 114 drugs of very widely different structures. 6 Therange of optimal value is influenced by permutation <strong>and</strong>by receptor affinity. The best study we have on distributionis that from Nestorov et al. 13 These authorsshowed by a plot of their data against log P that a goodrelationship could be found for 5-N-alkyl-5-ethyl-barbitucacids interacting in rats after intravenous injection.log K is the tissue/plasma ratio.Rat lung tissue 13 (Table 9):log K ¼ 0:63ð0:17ÞC logP 0:55ð0:45Þ ð9Þn ¼ 9, r 2 ¼ 0:914, s ¼ 0:298, q 2 ¼ 0:843.Rat liver tissue 13 (Table 10):log K ¼ 0:44ð0:15ÞC logP þ 0:11ð0:40Þð10ÞTable 10. Rat liverlog K Y Pred Dev Clog P1 Me 0.44 0.17 0.27 0.132 C 2 H 5 0.59 0.40 0.19 0.663 C 3 H 7 0.53 0.64 )0.10 1.184 C 4 H 9 0.69 0.87 )0.18 1.715 C 5 H 11 0.82 1.11 )0.29 2.246 C 6 H 13 1.18 1.34 )0.16 2.777 C 7 H 15 1.31 1.57 )0.27 3.308 C 8 H 17 1.97 1.81 0.16 3.839 C 9 H 19 2.41 2.04 0.37 4.36n ¼ 9, r 2 ¼ 0:871, s ¼ 0:265, q 2 ¼ 0:749.Rat kidney tissue 13 (Table 11):log K ¼ 0:50ð0:10ÞC logP 0:03ð0:27Þ ð11Þn ¼ 8, r 2 ¼ 0:961, s ¼ 0:170, q 2 ¼ 0:933, outlier: C 5 H 11 .Rat stomach tissue 13 (Table 12):log K ¼ 0:74ð0:09ÞC logP 0:92ð0:24Þ ð12Þn ¼ 9, r 2 ¼ 0:982, s ¼ 0:157, q 2 ¼ 0:965.Rat pancreas tissue (Table 13): 13log K ¼ 0:72ð0:13ÞC logP 0:93ð0:34Þ ð13Þn ¼ 9, r 2 ¼ 0:961, s ¼ 0:226, q 2 ¼ 0:921.Rat spleen tissue 13 (Table 14):log K ¼ 0:61ð0:17ÞC logP 0:59ð0:44Þ ð14Þn ¼ 9, r 2 ¼ 0:914, s ¼ 0:288, q 2 ¼ 0:830.Table 11. Rat kidneylog K Y Pred Dev Clog P1 Me 0.10 0.03 0.07 0.132 C 2 H 5 0.27 0.30 )0.03 0.663 C 3 H 7 0.66 0.56 0.10 1.184 C 4 H 9 0.87 0.83 0.04 1.715 C 5 H 11 0.78 1.10 )0.32 2.246 C 6 H 13 1.06 1.36 )0.30 2.777 C 7 H 15 1.47 1.63 )0.16 3.308 C 8 H 17 2.00 1.90 0.11 3.839 C 9 H 19 2.34 2.16 0.18 4.36 Outlier.Table 9. Rat lunglog K Y Pred Dev Clog P1 Me )0.21 )0.47 0.25 0.132 C 2 H 5 0.02 )0.14 0.15 0.663 C 3 H 7 0.23 0.20 0.03 1.184 C 4 H 9 0.41 0.53 )0.12 1.715 C 5 H 11 0.53 0.86 )0.33 2.246 C 6 H 13 0.83 1.19 )0.37 2.777 C 7 H 15 1.28 1.53 )0.25 3.308 C 8 H 17 2.10 1.86 0.24 3.839 C 9 H 19 2.59 2.19 0.39 4.36Table 12. Rat stomachlog K Y Pred Dev Clog P1 Me )0.59 )0.83 0.24 0.132 C 2 H 5 )0.52 )0.43 )0.09 0.663 C 3 H 7 )0.14 )0.04 )0.10 1.184 C 4 H 9 0.34 0.35 )0.02 1.715 C 5 H 11 0.51 0.75 )0.24 2.246 C 6 H 13 1.21 1.14 0.07 2.777 C 7 H 15 1.65 1.53 0.12 3.308 C 8 H 17 1.83 1.93 )0.09 3.839 C 9 H 19 2.42 2.32 0.11 4.36
C. Hansch et al. / Bioorg. Med. Chem. 12 (2004) 3391–3400 3397Table 13. Rat pancreaslog K Y Pred Dev Clog P1 Me )0.49 )0.84 0.34 0.132 C 2 H 5 )0.42 )0.45 0.03 0.663 C 3 H 7 )0.16 )0.07 )0.09 1.184 C 4 H 9 0.16 0.31 )0.15 1.715 C 5 H 11 0.40 0.70 )0.29 2.246 C 6 H 13 0.96 1.08 )0.12 2.777 C 7 H 15 1.33 1.46 )0.13 3.308 C 8 H 17 1.98 1.85 0.14 3.839 C 9 H 19 2.50 2.23 0.27 4.36Table 17. Rat adipose tissuelog K Y Pred Dev Clog P1 Me )0.46 )0.61 0.15 0.132 C 2 H 5 )0.12 )0.18 0.05 0.663 C 3 H 7 0.19 0.26 )0.07 1.184 C 4 H 9 0.47 0.69 )0.21 1.715 C 5 H 11 0.86 1.12 )0.26 2.246 C 6 H 13 1.82 1.55 0.27 2.777 C 7 H 15 2.09 1.98 0.11 3.308 C 8 H 17 2.33 2.41 )0.08 3.839 C 9 H 19 2.89 2.85 0.04 4.36Table 14. Rat spleenlog K Y Pred Dev Clog P1 Me )0.24 )0.51 0.27 0.132 C 2 H 5 )0.06 )0.19 0.13 0.663 C 3 H 7 0.12 0.13 )0.01 1.184 C 4 H 9 0.34 0.45 )0.11 1.715 C 5 H 11 0.46 0.77 )0.31 2.246 C 6 H 13 0.81 1.09 )0.28 2.777 C 7 H 15 1.14 1.41 )0.28 3.308 C 8 H 17 1.86 1.73 0.13 3.839 C 9 H 19 2.51 2.05 0.45 4.36Rat adipose tissue 13 (Table 17):log K ¼ 0:82ð0:11ÞC logP 0:71ð0:28Þ ð17Þn ¼ 9, r 2 ¼ 0:979, s ¼ 0:185, q 2 ¼ 0:969.Rat skin tissue 13 (Table 18):log K ¼ 0:59ð0:18ÞC logP 0:35ð0:48Þ ð18Þn ¼ 8, r 2 ¼ 0:914, s ¼ 0:303, q 2 ¼ 0:825, outlier: C 5 H 11 .Rat heart tissue 13 (Table 19):Table 15. Rat gutlog K Y Pred Dev Clog P1 Me )0.22 )0.44 0.22 0.132 C 2 H 5 )0.14 )0.13 )0.01 0.663 C 3 H 7 0.08 0.18 )0.10 1.184 C 4 H 9 0.49 0.49 0.00 1.715 C 5 H 11 0.60 0.80 )0.20 2.246 C 6 H 13 1.09 1.11 )0.02 2.777 C 7 H 15 1.30 1.42 )0.11 3.308 C 8 H 17 1.68 1.73 )0.05 3.839 C 9 H 19 2.31 2.04 0.27 4.36Rat gut tissue 13 (Table 15):log K ¼ 0:59ð0:10ÞC logP 0:52ð0:25Þ ð15Þn ¼ 9, r 2 ¼ 0:969, s ¼ 0:164, q 2 ¼ 0:932.Rat muscle tissue 13 (Table 16):log K ¼ 0:55ð0:07ÞC logP 0:46ð0:19Þ ð16Þn ¼ 9, r 2 ¼ 0:980, s ¼ 0:124, q 2 ¼ 0:961.log K ¼ 0:58ð0:05ÞC logP 0:50ð0:14Þ ð19Þn ¼ 9, r 2 ¼ 0:989, s ¼ 0:093, q 2 ¼ 0:978.Rat brain tissue 13 (Table 20):log K ¼ 0:61ð0:13ÞC logP 0:52ð0:34Þ ð20Þn ¼ 8, r 2 ¼ 0:959, s ¼ 0:211, q 2 ¼ 0:914, outlier: C 5 H 11 .Table 18. Rat skinlog K Y Pred Dev Clog P1 Me 0.05 )0.28 0.33 0.132 C 2 H 5 0.10 0.03 0.06 0.663 C 3 H 7 0.26 0.35 )0.09 1.184 C 4 H 9 0.36 0.66 )0.30 1.715 C 5 H 11 0.36 0.97 )0.61 2.246 C 6 H 13 1.17 1.29 )0.12 2.777 C 7 H 15 1.19 1.60 )0.41 3.308 C 8 H 17 2.07 1.91 0.16 3.839 C 9 H 19 2.60 2.23 0.37 4.36 Outlier.Table 16. Rat musclelog K Y Pred Dev Clog P1 Me )0.22 )0.39 0.17 0.132 C 2 H 5 )0.07 )0.10 0.02 0.663 C 3 H 7 0.21 0.20 0.01 1.184 C 4 H 9 0.34 0.49 )0.15 1.715 C 5 H 11 0.61 0.78 )0.18 2.246 C 6 H 13 1.05 1.07 )0.02 2.777 C 7 H 15 1.32 1.37 )0.05 3.308 C 8 H 17 1.71 1.66 0.05 3.839 C 9 H 19 2.10 1.95 0.15 4.36Table 19. Rat heartlog K Y Pred Dev Clog P1 Me )0.26 )0.42 0.16 0.132 C 2 H 5 )0.14 )0.12 )0.03 0.663 C 3 H 7 0.09 0.19 )0.10 1.184 C 4 H 9 0.49 0.49 )0.01 1.715 C 5 H 11 0.68 0.80 )0.12 2.246 C 6 H 13 1.10 1.11 0.00 2.777 C 7 H 15 1.37 1.41 )0.04 3.308 C 8 H 17 1.75 1.72 0.03 3.839 C 9 H 19 2.11 2.02 0.09 4.36
3398 C. Hansch et al. / Bioorg. Med. Chem. 12 (2004) 3391–3400Table 20. Rat brainlog K Y Pred Dev Clog P1 Me )0.22 )0.44 0.22 0.132 C 2 H 5 )0.12 )0.12 0.00 0.663 C 3 H 7 0.15 0.21 )0.05 1.184 C 4 H 9 0.41 0.53 )0.12 1.715 C 5 H 11 0.40 0.86 )0.46 2.246 C 6 H 13 1.11 1.18 )0.07 2.777 C 7 H 15 1.17 1.50 )0.33 3.308 C 8 H 17 1.90 1.83 0.07 3.839 C 9 H 19 2.44 2.15 0.29 4.36 Outlier.Table 21. Rat testislog K Y Pred Dev Clog P1 Me )0.16 )0.36 0.20 0.132 C 2 H 5 )0.10 )0.08 )0.02 0.663 C 3 H 7 0.21 0.20 0.01 1.184 C 4 H 9 0.41 0.49 )0.07 1.715 C 5 H 11 0.60 0.77 )0.17 2.246 C 6 H 13 0.91 1.05 )0.14 2.777 C 7 H 15 1.32 1.34 )0.02 3.308 C 8 H 17 1.63 1.62 0.01 3.839 C 9 H 19 2.11 1.90 0.21 4.36Rat testis tissue 13 (Table 21):log K ¼ 0:54ð0:08ÞC logP 0:43ð0:21Þ ð21Þn ¼ 9, r 2 ¼ 0:972, s ¼ 0:141, q 2 ¼ 0:942.Rat plasma. Ratio of bound to unbound chemical 13 (Table22):log K ¼ 0:90ð0:08ÞC logP 1:88ð0:21Þ ð22Þn ¼ 8, r 2 ¼ 0:993, s ¼ 0:105, q 2 ¼ 0:987, outlier: CH 3 .Rat red blood cells. Ratio of cell concentration to thatunbound in plasma 13 (Table 23):log K ¼ 0:48ð0:12ÞC logP 0:37ð0:31Þ ð23Þn ¼ 9, r 2 ¼ 0:930, s ¼ 0:206, q 2 ¼ 0:861.From this excellent study we see that the calculatedoctanol water partition does an excellent job, withoutthe trouble of measuring the penetration of Caco-2 cellTable 23. Rat red blood cellslog K Y Pred Dev Clog P1 Me 0.00 )0.31 0.31 0.132 C 2 H 5 0.02 )0.05 0.07 0.663 C 3 H 7 0.06 0.20 )0.14 1.184 C 4 H 9 0.23 0.46 )0.23 1.715 C 5 H 11 0.64 0.71 )0.08 2.246 C 6 H 13 0.75 0.97 )0.22 2.777 C 7 H 15 1.18 1.23 )0.05 3.308 C 8 H 17 0.60 1.48 0.12 3.839 C 9 H 19 1.96 1.74 0.22 4.36layers. Of interest is the fact that except for <strong>QSAR</strong> 22.The other <strong>QSAR</strong> have similar slopes <strong>and</strong> intercepts.2.3. MetabolismThe importance of metabolism in drug design was recognizedeven before the appellation ‘rational’ could beapplied. In many cases, metabolism was utilized toconvert a pro-drug to its active form (e.g., action ofesterases on the ester of a drug), but more commonly,one wants to avoid drug c<strong>and</strong>idates that will quickly loseactivity through metabolism or worse, made toxicthereby. In an earlier examination of the <strong>QSAR</strong>approach to underst<strong>and</strong>ing metabolic processes, 4 wefocused on equations dealing with both phase I <strong>and</strong>phase II metabolism. The most important enzyme inmetabolism is the Cytochrome P-450 class. It is noteworthythat out of 90 <strong>QSAR</strong> on P-450, both simplebinding <strong>and</strong> oxidation reactions, 55 contain a positivelog P term. We also have three <strong>QSAR</strong> with positive log Pterms that correlate the induction of P-450 by variouscompounds, indicating that hydrophobic drugs mightinduce their own destruction. The <strong>QSAR</strong> of P450 hasrecently been reviewed. 142.4. EliminationIn considering excretion of organic compounds, we shallfocus on examples where metabolism is not involved;that is, excretion of the unchanged drug. Compoundsthat are rather strongly ionized (e.g., sulfonamidesrequire an electronic term in addition to log P to accountfor rate of elimination).Excretion of phenols from Daphnia magna. Data fromGerritsen et al. 15 (Table 24):Table 22. Rat plasmalog K Y Pred Dev Clog P1 Me –– )1.77 –– 0.132 C 2 H 5 )1.40 )1.29 )0.11 0.663 C 3 H 7 )0.80 )0.81 0.02 1.184 C 4 H 9 )0.17 )0.34 0.16 1.715 C 5 H 11 0.03 0.14 )0.11 2.246 C 6 H 13 0.66 0.61 0.04 2.777 C 7 H 15 1.15 1.09 0.06 3.308 C 8 H 17 1.59 1.57 0.02 3.839 C 9 H 19 1.95 2.04 )0.09 4.36Table 24. Excretions of X-C6H4OH from Daphnia magnalog K Y Pred Dev Clog P1 4-CHMeC 2 H 5 0.83 0.78 0.05 3.432 4-CMe 3 0.87 0.84 0.03 3.303 4-C(Me) 2 C 2 H 5 )0.09 0.6 )0.68 3.834 2,4-CMe 3 0.01 0.1 )0.09 4.935 4-C(C 2 H 5 ) 2 C 3 H 7 )0.28 )0.12 )0.15 5.426 4-Nonyl )0.33 )0.48 0.16 6.21 Outlier.
C. Hansch et al. / Bioorg. Med. Chem. 12 (2004) 3391–3400 3399log K ¼ 0:45ð0:18ÞC logP þ 2:34ð0:84Þ ð24Þn ¼ 5, r 2 ¼ 0:957, s ¼ 0:140, q 2 ¼ 0:850, outlier: 4-t-butylphenol(not excreted as fast as predicted).Fraction of miscellaneous anti-hypertensive drug excretedunchanged after IV injection in humans. Hinderlinget al. 16 (Table 25):log K ¼ 0:54ð0:15ÞC logP þ 0:04ð0:29Þ ð25Þn ¼ 11, r 2 ¼ 0:886, s ¼ 0:228, q 2 ¼ 0:848, outliers:penbutolol, pindolol, practolol.Excretion of miscellaneous pesticides from catfish. Datafrom Ellgehausen et al. 17 (Table 26):log K ¼ 0:67ð0:13Þ log P þ 2:95ð0:44Þ ð26Þn ¼ 7, r 2 ¼ 0:973, s ¼ 0:193, q 2 ¼ 0:926, outlier: 2,4-dichlorophenoxyaceticacid.K is related to the half-life of the chemical in the fish.Thus, we see from three quite different types of studies,that the coefficients with the log P term are quite similar<strong>and</strong> negative.Parameters other than log P may be required if significantionization is involved. This can be illustrated withdata on the excretion of miscellaneous compounds fromratsTable 25. Excretion of hypertensive drugs from humanlog K Y Pred Dev Clog P1 Penbutolol –– )2.14 –– 4.042 Bufuralol )1.70 )1.80 0.10 3.403 Tolamolol )1.30 )1.09 )0.21 2.104 Propranolol )1.40 )1.44 0.05 2.755 Alprenolol )1.70 )1.39 )0.31 2.656 Oxprenolol )0.96 )1.09 0.13 2.097 Acebutolol )0.39 )0.88 0.49 1.718 Timolol )0.92 )0.81 )0.11 1.589 Metoprolol )0.82 )0.69 )0.14 1.3510 Pindolol )0.30 )0.86 0.56 1.6711 Atenolol )0.03 0.10 )0.13 )0.1112 Nadolol )0.12 )0.16 0.04 0.3813 Sotalol 0.00 )0.08 0.08 0.23 Outliers.Table 26. Excretion of miscellaneous pesticides from catfishlog K Y Pred Dev Clog P1 P,P 0 -DDP )1.28 )1.19 )0.10 6.192 Terbutryn 0.47 0.45 0.02 3.743 Metolachlor 0.96 0.86 0.10 3.134 Atrazine 1.43 1.11 0.32 2.755 Monuron 1.32 1.56 )0.24 2.086 Thiazafluron 1.65 1.71 )0.06 1.857 CGA-48-988 1.80 1.85 )0.05 1.658 2,4-D 2.18 1.07 1.11 2.81 Outliers.Table 27. Excretion of miscellaneous sulfonamides from ratlog K Y Pred Dev DpK a Mlog P1 Sulfamine )1.18 )2.14 0.96 0.00 )0.622 Acetoxulfamine )0.19 )0.29 0.10 5.05 )0.963 Sulfathiazole )0.63 )1.37 0.74 3.35 0.054 Diazine )1.14 )0.99 )0.15 4.30 )0.095 Merazine )1.17 )1.36 0.19 3.52 0.146 Isoxazole )0.61 )1.04 0.43 5.83 1.017 Phenazole )1.55 )1.73 0.18 4.54 1.528 Methoxypyridazine)1.55 )1.49 )0.06 3.40 0.329 Dimethoxine )1.92 )1.83 )0.09 4.40 1.6310 Isomezole )1.34 )1.37 0.03 4.64 0.8911 Monomethoxine )1.41 )1.20 )0.21 4.42 0.41 Outliers.Data from Yamazaki et al. 18 (Table 27):log k ¼0:51ð0:20Þ log P þ 0:33ð0:31ÞpK a2:45ð1:35Þð27Þn ¼ 8, r 2 ¼ 0:912, s ¼ 0:178, q 2 ¼ 0:712, outliers: sulfamine,sulfathiazole, isoxazole.After correction for ionization, (pK a ¼ ionization constant)the log P term is similar to those in the otherexamples.3. DiscussionThere has been a recent tendency to refer to <strong>ADME</strong>Twhere T st<strong>and</strong>s for toxicology. It is wishful thinking tobelieve that toxicology can be treated adequately viacomparative <strong>QSAR</strong>. One must force the fact that at thepresent time, no one knows how to deal with metabolism.Cytochrome P-450 enzymes play the major role inmetabolism. We have 96 <strong>QSAR</strong> for the activity of thisvaried class of enzymes. We plan to attempt to relatethese <strong>QSAR</strong> to <strong>ADME</strong> but it is too complex for thecurrent report. While <strong>ADME</strong> is clearly a most importantsubject to elucidate <strong>and</strong> there has been much discussionof the subject, to our knowledge, this is the firstattempt to develop a general approach to analyze thesubject via <strong>QSAR</strong>. It is not possible to make sense of<strong>ADME</strong> in terms of a single compound. For drawinghelpful conclusions for drug design one must have theperspective provided by <strong>QSAR</strong>.Clearly Clog P from the octanol/water system is a crucialparameter for developing our underst<strong>and</strong>ing of <strong>ADME</strong>.The program from BioByte Corporation developed overthe years is of enormous help. Its quality can be seenfrom the following equation:log P ¼ 0:96C logP þ 0:071n ¼ 12; 500, r 2 ¼ 0:973, s ¼ 0:30.The above equation holds only for neutral compounds.Useful values are obtained for a set of compounds thatcontain a common acid function (e.g., COOH), for
3400 C. Hansch et al. / Bioorg. Med. Chem. 12 (2004) 3391–3400example, at a pH of 7.4 where all would be off the valuefor the partially ionized compound. Of course, if thefunction is not involved in the crucial step, ionizationmay not be important or the situation can be dealt withas in the example of <strong>QSAR</strong> 27.References <strong>and</strong> notes1. van de Waterbeemd, H.; Gifford, E. Nat. Rev. 2003, 2,192.2. Bergstrom, C. R. S.; Strafford, M.; Lazorova, L.; Avdee,F. A.; Luthmann, K. J. Med. Chem. 2003, 46, 558.3. Hansch, C.; Steinmetz, W. E.; Leo, A. J.; Mekapati, S. B.;Kurup, A.; Hoekman, D. J. Chem. Inf. Comp. Sci. 2003,43, 120.4. Hansch, C.; Leo, A. Exploring <strong>QSAR</strong>. Fundamentals <strong>and</strong>Application in Chemistry <strong>and</strong> Biology; American ChemicalSociety: Washington, DC, 1995; pp 311–324.5. BioByte Corporation, 201 West 4th Street, Claremont, CA91711 USA.6. Hansch, C.; Bj€orkroth, J. P.; Leo, A. J. Pharm. Sci. 1987,76, 663.7. Kulkarni, A.; Han, Y.; Hopfinger, A. J. Chem. Inf.Comput. Sci. 2002, 42, 331.8. Bravi, G.; Wikel, J. H. Quant. Struct.-Act. Relat. 2000, 19,39.9. Tantishaiyakul, V. Pharmazie 2001, 56, 407–411.10. Bergstrom, C. A. S.; Strafford, M.; Lazorova, L.; Audeef,L.; Luthman, K.; Artursson, P. J. Med. Chem. 2003, 46,558.11. Yamashita, F.; Fujwara, S.-I.; Hashida, M. J. Chem. Inf.Comput. Sci. 2002, 42, 408.12. Bermjo, M.; Merino, V.; Garrigues, T. M.; Delfina, J. M.P.; Muler, A.; Vizet, P.; Trouiller, G.; Mercier, C.J. Pharm. Sci. 1999, 88, 398.13. Nestorov, Z.; Aarons, L.; Rowl<strong>and</strong>, M. J. Pharmacokinet.Biopharm. 1998, 26, 521.14. Hansch, C.; Mekapati, S. B.; Kurup, A.; Verma, R. P.Drug Metab. Rev. 2004, 36, 105.15. Gerritsen, A.; van der Hoeven, N.; Pielaat, A. Ecotoxicol.Environ. Saf. 1998, 39, 227.16. Hinderling, P. H.; Schmidlin, O.; Seydel, J. E. J. Pharmacokinet.Biopharm. 1984, 12, 263.17. Ellgehausen, H.; Guth, J. A.; Esser, H. D. Ecotoxicol.Environ. Saf. 1980, 4, 134.18. Yamazaki, M.; Aoki, M.; Kamada, A. Chem. Pharm. Bull.1968, 16, 721.


