Name of the Module PIE CHARTS & LINE GRAPHS - Sreenivasa ...
Name of the Module PIE CHARTS & LINE GRAPHS - Sreenivasa ...
Name of the Module PIE CHARTS & LINE GRAPHS - Sreenivasa ...
- No tags were found...

You also want an ePaper? Increase the reach of your titles
YUMPU automatically turns print PDFs into web optimized ePapers that Google loves.
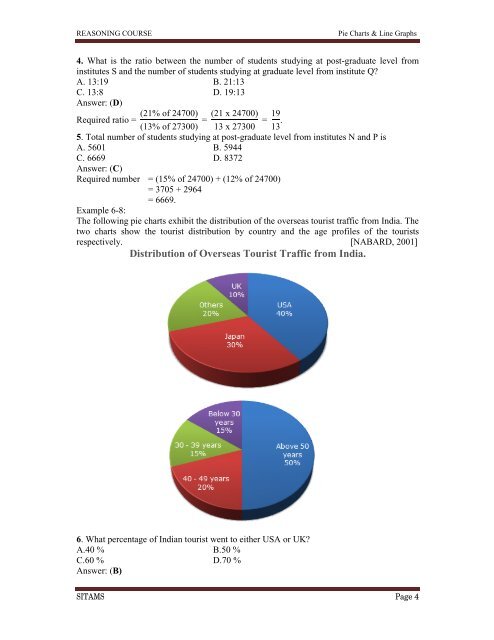
REASONING COURSEPie Charts & Line Graphs4. What is <strong>the</strong> ratio between <strong>the</strong> number <strong>of</strong> students studying at post-graduate level frominstitutes S and <strong>the</strong> number <strong>of</strong> students studying at graduate level from institute Q?A. 13:19 B. 21:13C. 13:8 D. 19:13Answer: (D)Required ratio = (21% <strong>of</strong> 24700) = (21 x 24700) = 19 .(13% <strong>of</strong> 27300) 13 x 27300 135. Total number <strong>of</strong> students studying at post-graduate level from institutes N and P isA. 5601 B. 5944C. 6669 D. 8372Answer: (C)Required number = (15% <strong>of</strong> 24700) + (12% <strong>of</strong> 24700)= 3705 + 2964= 6669.Example 6-8:The following pie charts exhibit <strong>the</strong> distribution <strong>of</strong> <strong>the</strong> overseas tourist traffic from India. Thetwo charts show <strong>the</strong> tourist distribution by country and <strong>the</strong> age pr<strong>of</strong>iles <strong>of</strong> <strong>the</strong> touristsrespectively. [NABARD, 2001]Distribution <strong>of</strong> Overseas Tourist Traffic from India.6. What percentage <strong>of</strong> Indian tourist went to ei<strong>the</strong>r USA or UK?A.40 % B.50 %C.60 % D.70 %Answer: (B)SITAMS Page 4