Download the full report (PDF, 734 KB) - Reconnecting America
Download the full report (PDF, 734 KB) - Reconnecting America
Download the full report (PDF, 734 KB) - Reconnecting America
- No tags were found...

Create successful ePaper yourself
Turn your PDF publications into a flip-book with our unique Google optimized e-Paper software.
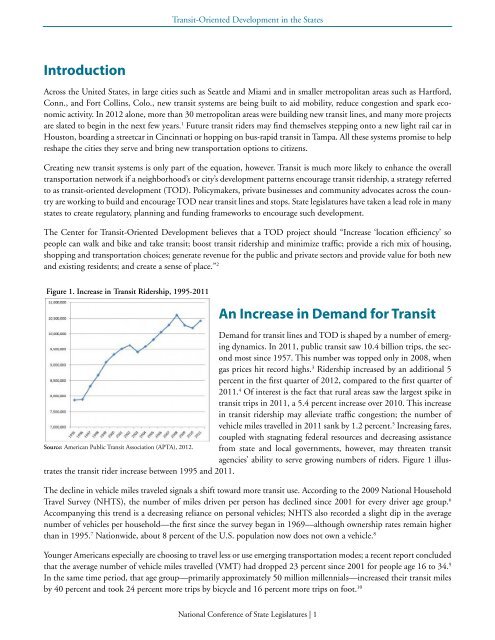
Transit-Oriented Development in <strong>the</strong> StatesIntroductionAcross <strong>the</strong> United States, in large cities such as Seattle and Miami and in smaller metropolitan areas such as Hartford,Conn., and Fort Collins, Colo., new transit systems are being built to aid mobility, reduce congestion and spark economicactivity. In 2012 alone, more than 30 metropolitan areas were building new transit lines, and many more projectsare slated to begin in <strong>the</strong> next few years. 1 Future transit riders may find <strong>the</strong>mselves stepping onto a new light rail car inHouston, boarding a streetcar in Cincinnati or hopping on bus-rapid transit in Tampa. All <strong>the</strong>se systems promise to helpreshape <strong>the</strong> cities <strong>the</strong>y serve and bring new transportation options to citizens.Creating new transit systems is only part of <strong>the</strong> equation, however. Transit is much more likely to enhance <strong>the</strong> overalltransportation network if a neighborhood’s or city’s development patterns encourage transit ridership, a strategy referredto as transit-oriented development (TOD). Policymakers, private businesses and community advocates across <strong>the</strong> countryare working to build and encourage TOD near transit lines and stops. State legislatures have taken a lead role in manystates to create regulatory, planning and funding frameworks to encourage such development.The Center for Transit-Oriented Development believes that a TOD project should “Increase ‘location efficiency’ sopeople can walk and bike and take transit; boost transit ridership and minimize traffic; provide a rich mix of housing,shopping and transportation choices; generate revenue for <strong>the</strong> public and private sectors and provide value for both newand existing residents; and create a sense of place.” 2Figure 1. Increase in Transit Ridership, 1995-2011An Increase in Demand for TransitDemand for transit lines and TOD is shaped by a number of emergingdynamics. In 2011, public transit saw 10.4 billion trips, <strong>the</strong> secondmost since 1957. This number was topped only in 2008, whengas prices hit record highs. 3 Ridership increased by an additional 5percent in <strong>the</strong> first quarter of 2012, compared to <strong>the</strong> first quarter of2011. 4 Of interest is <strong>the</strong> fact that rural areas saw <strong>the</strong> largest spike intransit trips in 2011, a 5.4 percent increase over 2010. This increasein transit ridership may alleviate traffic congestion; <strong>the</strong> number ofvehicle miles travelled in 2011 sank by 1.2 percent. 5 Increasing fares,coupled with stagnating federal resources and decreasing assistanceSource: <strong>America</strong>n Public Transit Association (APTA), 2012. from state and local governments, however, may threaten transitagencies’ ability to serve growing numbers of riders. Figure 1 illustrates<strong>the</strong> transit rider increase between 1995 and 2011.The decline in vehicle miles traveled signals a shift toward more transit use. According to <strong>the</strong> 2009 National HouseholdTravel Survey (NHTS), <strong>the</strong> number of miles driven per person has declined since 2001 for every driver age group. 6Accompanying this trend is a decreasing reliance on personal vehicles; NHTS also recorded a slight dip in <strong>the</strong> averagenumber of vehicles per household—<strong>the</strong> first since <strong>the</strong> survey began in 1969—although ownership rates remain higherthan in 1995. 7 Nationwide, about 8 percent of <strong>the</strong> U.S. population now does not own a vehicle. 8Younger <strong>America</strong>ns especially are choosing to travel less or use emerging transportation modes; a recent <strong>report</strong> concludedthat <strong>the</strong> average number of vehicle miles travelled (VMT) had dropped 23 percent since 2001 for people age 16 to 34. 9In <strong>the</strong> same time period, that age group—primarily approximately 50 million millennials—increased <strong>the</strong>ir transit milesby 40 percent and took 24 percent more trips by bicycle and 16 percent more trips on foot. 10National Conference of State Legislatures | 1