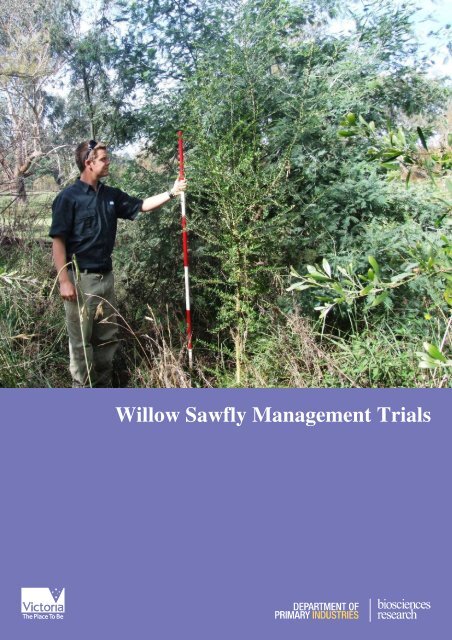
Willow Sawfly Management Trials - Weeds Australia
Willow Sawfly Management Trials - Weeds Australia
Willow Sawfly Management Trials - Weeds Australia

You also want an ePaper? Increase the reach of your titles
YUMPU automatically turns print PDFs into web optimized ePapers that Google loves.
Table of ContentsSection 1: <strong>Management</strong> <strong>Trials</strong>.......................................................................................................11.1 Introduction .............................................................................................................................11.1.1 <strong>Willow</strong>s as <strong>Weeds</strong> and <strong>Willow</strong> <strong>Management</strong> ..................................................................11.1.2 Impacts of <strong>Willow</strong> <strong>Sawfly</strong> on <strong>Willow</strong>s............................................................................11.1.3 Interactions Between <strong>Willow</strong> <strong>Sawfly</strong> and <strong>Willow</strong> <strong>Management</strong> .....................................21.1.4 Exploiting the Opportunity Presented by <strong>Willow</strong> <strong>Sawfly</strong>................................................21.2 Methods...................................................................................................................................41.2.1 Design of <strong>Trials</strong>................................................................................................................41.2.2 Site Selection....................................................................................................................41.2.3 Allocation of Experimental Treatments ...........................................................................41.2.4 <strong>Willow</strong> Tree Treatment ....................................................................................................51.2.5 Re-establishment of Native Species.................................................................................61.2.6 Monitoring........................................................................................................................71.2.7 Data Analysis ...................................................................................................................71.3 Results .....................................................................................................................................91.3.1 <strong>Willow</strong> <strong>Sawfly</strong> Population Levels and Tree Defoliation .................................................91.3.2 Plant Survival (Tube-Stock).............................................................................................91.3.3 Plant Growth (Tube-stock).............................................................................................101.3.3.1 Happy Valley Site ...................................................................................................101.3.3.2 Kiewa River Site .....................................................................................................111.3.3.3 Campaspe River Site ...............................................................................................121.3.4 Effect of <strong>Willow</strong> Tree Treatment on Heights and Relative Growth Rates ....................131.3.5 Light Environment for Tube-stock.................................................................................131.3.6 Direct Seeding................................................................................................................161.3.6.1 Happy Valley Site ...................................................................................................161.3.6.2 Campaspe River Site ...............................................................................................171.3.7 Light Levels in Direct-Seeded Plots...............................................................................171.3.8 Stem Injection <strong>Trials</strong> ......................................................................................................171.4 Discussion .............................................................................................................................191.4.1 Establishment of Native Species ....................................................................................191.4.1.1 Restoring Native Riparian Communities ................................................................191.4.1.2 Barriers to Establishment of Tube-Stock ................................................................191.4.1.3 Barriers to Establishment from Direct Seeding.......................................................211.4.2 Impacts of <strong>Willow</strong>s and <strong>Willow</strong> <strong>Sawfly</strong> on Light Levels..............................................211.5 <strong>Willow</strong> <strong>Sawfly</strong> Impacts on <strong>Willow</strong> <strong>Management</strong>.................................................................231.5.1 Impacts of <strong>Willow</strong> <strong>Sawfly</strong> on <strong>Willow</strong>s..........................................................................231.5.2 Impacts of <strong>Willow</strong> <strong>Sawfly</strong> on <strong>Willow</strong> <strong>Management</strong>......................................................23Section 2: Monitoring <strong>Willow</strong> <strong>Sawfly</strong> Populations and Defoliation ..........................................242.1 Introduction ...........................................................................................................................242.2 Methods.................................................................................................................................242.3 Results ...................................................................................................................................262.3.1 <strong>Willow</strong> <strong>Sawfly</strong> Population Levels..................................................................................262.3.2 <strong>Willow</strong> Tree Defoliation ................................................................................................272.3.3 Grey Sallow Defoliation at Happy Valley .....................................................................282.3.4 Extent of Tree Death ......................................................................................................282.4 Synthesis of Monitoring Program .........................................................................................31Section 3: <strong>Willow</strong> <strong>Sawfly</strong> Across <strong>Australia</strong>................................................................................323.1 South Eastern <strong>Australia</strong>.........................................................................................................323.2 Western <strong>Australia</strong>..................................................................................................................34Section 4: Bibliography...............................................................................................................35Appendix 1: Details of Statistical Analyses................................................................................36
List of TablesTable 1: Site Details for Revegetation Field Trial ........................................................................5Table 2: Survival of Tube-Stock Planted at Three Trial Sites in Winter 2008 ...........................10Table 3: Average Height of Seedlings at Planting (Winter/Spring 2008), in December 2009 andin April 2010 and Change in Plant Height over Time..................................................12Table 4: Average Heights in April 2010 of Additional Tube-stock Planted Outside Trial Plots inSpring 2008 at Campaspe River...................................................................................13Table 5: Average Relative Light Levels at Tube-stock Planting Positions in Plots Under Steminjected<strong>Willow</strong>s and Untreated <strong>Willow</strong>s.....................................................................14Table 6: Height of Seedlings Established in the Direct Sowing Plots at the Happy Valley Site,Assessed in April 2010.................................................................................................16Table 7: Site Locations, <strong>Willow</strong> Taxa Present and <strong>Willow</strong> <strong>Sawfly</strong> Population Levels inPrevious Seasons for Sites Monitored in 2009/10 Season ...........................................25Table 8: <strong>Willow</strong> <strong>Sawfly</strong> Populations Assessed Throughout the 2009/10 Season on Various<strong>Willow</strong> Taxa at Monitoring Sites.................................................................................26Table 9: <strong>Willow</strong> Tree Defoliation at Monitoring Sites in 2009/10 Season.................................28Table 10: Change in Ratio of Live: Dead Material on Trees Between October 2007 and October2009..............................................................................................................................29Table i: Results of One Way ANOVA to Test Effect of <strong>Willow</strong> Tree Treatment on Survival ofTube-Stock over Two Seasons……………………………………………………….36Table ii: Results of Two Way ANOVA of Seedling Heights of the Different Native Specieswith <strong>Willow</strong> Tree Treatment as a Factor……………………………………………..36Table iii: Results of Two Way ANOVA of Relative Growth Rate (RGR) of Different NativeSpecies at Kiewa River Site with <strong>Willow</strong> Tree Treatment as a Factor……………....36Table iv: Results of One Way ANOVA to Test Effect of <strong>Willow</strong> Tree Treatment on Number ofSeedlings Establishing in Direct Seeded Plots at Happy Valley Site………………..37Table v: Results of One Way ANOVA to Test Effect of <strong>Willow</strong> Tree Treatment on Height ofSilver Wattle Seedlings Establishing in Direct Seeded Plots at Happy Valley Site....37List of FiguresFigure 1: Nested design of treatment allocations to test establishment of native riparian speciesunder stem-injected and non-injected willows trees at sites with either high or lowpopulations of willow sawfly. ........................................................................................5Figure 2: Known distribution of willow sawfly across <strong>Australia</strong> as at April 2010.....................33Figure 3: Known distribution of willow sawfly across south eastern <strong>Australia</strong> as at April2010..............................................................................................................................33
1Section 1: <strong>Management</strong> <strong>Trials</strong>1.1 Introduction1.1.1 <strong>Willow</strong>s as <strong>Weeds</strong> and <strong>Willow</strong> <strong>Management</strong>In many parts of Victoria and south eastern <strong>Australia</strong>, willows are serious weeds of waterwaysand wetlands. <strong>Willow</strong>s are highly invasive, spreading both by seed and by vegetative means(such as stem fragments) and have significant impacts on the structure and functioning ofwaterways. <strong>Willow</strong> infestations can alter the hydrology and geomorphology of waterways,out-compete native riparian vegetation, and affect the habitat and food-webs of terrestrial and instreamfauna (ARMCANZ 2001). For these reasons, considerable resources are invested annuallyin willow control and management.A number of techniques are employed to manage willows and a full analysis of the mostappropriate method to use at any particular site is given in the <strong>Willow</strong> National <strong>Management</strong>Guide (Holland-Clift and Davies 2007). The most commonly employed technique for controllinglarge stands of willows is “cut and paint” which involves cutting down and removing willowsfrom the site using machinery, and painting the remaining stumps with herbicide solution toprevent resprouting.Stem injection techniques are more appropriate for some sites. These methods include “drill andfill” where holes are drilled in the base of the stem and herbicide is poured into the hole, and“frill and fill” where an axe, chisel or saw is used to cut the bark away from the cambial layerwhich is then painted with herbicide. This method is most effective at killing trees when theherbicide is translocated down into the roots via the phloem. As plants treated this way are left todie in situ, this method is only practical where plant debris are unlikely to cause any problemsover time, either on site or off site.At some sites, lopping part or all of the willow is recommended, particularly where willow rootsare providing a degree of bank stability and their immediate removal would cause erosionproblems. The aim of lopping may be to slow willow growth in which case the willows are left inplace to regrow, while in other situations it is intended that the willows will be eventually beremoved. At these sites, native species are planted under the willows which allows for the stagedreplacement of willows with natives.The majority of willow management programs seek to control willows as part of the process ofrestoring native riparian vegetation communities, so replanting of native species usually followswillow control. This restoration may involve planting tube-stock of appropriate species, orundertaking direct seeding. At sites where willows are present at low levels amongst nativevegetation, natural regeneration processes may be sufficient to re-establish native species and sono further intervention is required.1.1.2 Impacts of <strong>Willow</strong> <strong>Sawfly</strong> on <strong>Willow</strong>sThe recent arrival of willow sawfly (Nematus oligospilus Förster (Hymenoptera:Tenthredinidae)) in <strong>Australia</strong> is of interest to willow managers due to its potential to affectwillow management activities. Previous reports (Ede 2006, Ede et al. 2007 and Ede et al. 2009)
2have described the potential and actual impact of willow sawfly on willow trees in south-eastern<strong>Australia</strong>, particularly Victoria.The larval stage of willow sawfly consumes leaves of willow trees and high populations ofwillow sawfly result in the defoliation of entire trees. Although affected trees do regrow newleaves, the insect goes through several generations each season and so trees can be defoliatedseveral times during the growing season. In other countries, this pattern of repeated, severedefoliation has resulted in tree deaths (Ede 2009), but to date there is no evidence in Victoria ofwillow sawfly directly causing tree deaths, despite trees at some sites having been defoliatedeach season since 2005/06.1.1.3 Interactions Between <strong>Willow</strong> <strong>Sawfly</strong> and <strong>Willow</strong> <strong>Management</strong>One of the main concerns about willow sawfly has been its likely impact on willow management.It is possible that willow sawfly activity will influence the effectiveness of willow managementtechniques.As the major impact of willow sawfly on willows is the loss of photosynthetic capacity, willowsrepeatedly defoliated by willow sawfly are likely to have fewer carbohydrate reserves thanunaffected trees. If defoliated trees are then treated by cutting and painting, it is likely that theywill be less able to resprout after treatment as the resources required to regrow new tissues havebeen depleted.The potential interactions between willow sawfly impacts and stem injection activities occur as aresult of the movement of herbicide within the tree via the phloem. At the start of the growingseason, the rising sap within the tree carries carbohydrates and other resources stored in the rootsup into the shoots to allow the development of a new canopy. Once the canopy is fullydeveloped, the direction of phloem movement reverses and for the remainder of the season,phloem translocation moves carbohydrates from the shoots down to the roots for storage.The herbicide most commonly used to kill willow trees is translocated in the phloem. Thereforestem injection techniques ensure that the bulk of the applied herbicide is moved into the rootsystem, if undertaken at any time except at the start of the growing season. It is in the roots thatthe herbicide is most effective at killing the whole tree. Any herbicide which moves into thecanopy of the tree will kill foliage but is less likely to cause whole tree death.The impact of willow sawfly comes about because the defoliation caused by the insect meansthat the tree needs to grow new foliage during the season, using resources stored in other parts ofthe plant. This is likely to lead to a reversal in the direction of phloem translocation in defoliatedtrees, transporting any injected herbicide upwards towards the canopy. As much of the herbicideis no longer being translocated to the roots, stem injection is likely to be less effective at killingtrees which have been defoliated by willow sawfly.1.1.4 Exploiting the Opportunity Presented by <strong>Willow</strong> <strong>Sawfly</strong>As mentioned above, willow infestations compete with native riparian species for a number ofresources, including space, nutrients and water, and particularly light. The dense canopies of
willows limit the light which is available to the understorey, often resulting in riparian vegetationcommunities with very limited numbers of native species and high levels of exotic species,particularly weedy grasses and herbs (Ede et al. 2007).Defoliation of willows by willow sawfly increases understorey light levels (Ede et al. 2009). Thishas the potential to stimulate the development of understorey vegetation, but without carefulmanagement, is likely to lead to increases in weediness at many sites. Development of a nativedominatedriparian community at a site affected by willow sawfly defoliation may require theplanting or sowing of desirable species under the existing willow canopy.At sites affected by willow sawfly where willow removal is impractical or which are of such alow priority that willow control will unlikely to ever be undertaken, this approach of activelyintroducing native species has the potential to enhance riparian vegetation communities.A field trial was designed to test this management approach, and whether it is possible to reestablishnative species into willow-dominated sites where willow sawfly is causing defoliation.3Key Points: <strong>Willow</strong>s are serious weeds of waterways and wetlands; There are a range of appropriate willow management techniques, including cut andpaint and stem injection techniques; <strong>Willow</strong> control is often followed by restoration of native riparian communities; <strong>Willow</strong> sawfly, which has recently arrived in <strong>Australia</strong>, can defoliate whole willowtrees and may affect willow management activities; Defoliation increases understorey light levels and may provide the opportunity to reestablishnative species under willow trees.Happy Valley Site on 16 th January 2010 (above)and 26 th March 2010 (right). Photos: TerryMcCormack, NECMA
41.2 Methods1.2.1 Design of <strong>Trials</strong>Two trials were established to test different aspects of the interactions between willow sawflyand willow management.The first trial was designed to determine whether the defoliation caused by willow sawflyprovided the opportunity to establish native species in willow-dominated riparian zones. As acomponent of this trial, the effectiveness of two different vegetation establishment techniques(planting tube-stock and direct seeding) was compared.A second, smaller trial was established to test whether stem injection was effective at achievingwhole tree death when applied to trees which had been defoliated by willow sawfly. However asthis trial was limited by a number of practical constraints and the outcomes were generallyinconclusive at most sites, further details of the trial are not given in this report. A short summaryof the results from one site (on the Goulburn River in central Victoria) is presented in Section1.3.8.1.2.2 Site SelectionThree sites were selected to test the interaction between tree defoliation and re-establishment ofnative species (site details are given in Table 1). These sites had extensive infestations of eithercrack willow (Salix fragilis) or its hybrid S. x rubens. Trees at two sites (Kiewa River andCampaspe River) had been defoliated by willow sawfly in the 2007/08 season, while the third(Happy Valley) acted as a control site as it had very low willow sawfly populations and trees hadnot been defoliated by willow sawfly prior to trial establishment.The limiting factor for selecting trial sites was finding sites which contained sufficient numbersof willow trees which were able to be stem-injected and left in place for one to two years. Thisprecluded very large trees which were unlikely to remain upright for the duration of the trial. Itwas also preferable that site orientation was such that the plots were located on the south side ofthe willows to maximise the shade cast by intact willow canopies.Domestic stock was excluded from plots at all sites to prevent grazing.1.2.3 Allocation of Experimental TreatmentsA nested design, with willow sawfly status of the site as the highest level (Fig. 1), was used toallocate treatments at each site.Each site was divided into four blocks. At the Happy Valley and Campaspe River sites, eachblock contained four trees giving a total of 16 trees in the trial at these sites. However only eightsuitable trees were found at the Kiewa River site and so each block contained only two trees.At the Kiewa River site, all eight trees were under-planted with tube-stock of native riparianspecies. One tree in each block was stem-injected, while the second tree was left untreated.
At the Happy Valley and Campaspe River sites, blocks were sub-divided into two pairs of trees.Plots under one pair of trees were under-planted with tube-stock of native riparian species, whileplots under the remaining pair of trees were direct-sown. One tree in each pair was stem-injectedand the second tree remained untreated. Figure 1 illustrates this design.5Campaspe River SiteHigh willow sawflyHappy Valley SiteLow willow sawflyBlocks 1 - 4Blocks 1 - 4TubestockDirectseedTubestockDirectseedSteminjectedSteminjectedNoninjectedNoninjectedNoninjectedNoninjectedSteminjectedSteminjectedFigure 1: Nested design of treatment allocations to test establishment of native riparianspecies under stem-injected and non-injected willows trees at sites with either high or lowpopulations of willow sawfly.Table 1: Site Details for Revegetation Field TrialSite Location <strong>Willow</strong><strong>Sawfly</strong>Number ofReplicates<strong>Willow</strong> and RevegetationTreatmentsHappyValleyOvens(NE Vic)Low 4444Stem injection, tube-stockStem injection, direct sowingTree untreated, tube-stockTree untreated, direct sowingKiewaRiverKergunyah(NE Vic)High 44Stem injection, tube-stockTree untreated, tube-stockCampaspeRiverKyneton(CentralVic)High 4444Stem injection, tube-stockStem injection, direct sowingTree untreated, tube-stockTree untreated, direct sowing1.2.4 <strong>Willow</strong> Tree TreatmentTo be able to compare the effects of tree defoliation both within and between sites, it wasnecessary to artificially defoliate trees at each site to simulate canopy loss during the growing
6season. This ensured that some trees were defoliated for the duration of the trial, regardless of thewillow sawfly activity.Artificial tree defoliation was achieved by stem injection, with the selected trees treated inDecember 2007 and left in situ throughout the trial. At the Happy Valley and Campaspe Riversites, eight trees were stem-injected while at the Kiewa River site, four trees were stem-injected(Table 1). The remaining trees were not treated.For the Happy Valley site, which had very low willow sawfly populations, it was anticipated thatthe stem-injected trees would lose their foliage while the non-injected trees would maintain fullcanopy cover throughout each growing season.At those sites with high willow sawfly populations, little difference was expected in canopycover between stem-injected trees compared with non-injected trees, as it was expected that alltrees would be defoliated for an extended period, particularly through the latter part of thegrowing season.1.2.5 Re-establishment of Native SpeciesPlots were established under the trees by determining the area of shade cast by the trees in themiddle of the day under high light conditions, when they had full canopy cover, prior to steminjection. The size of the plots was limited to the area under the canopy of each individual tree,with pairs of trees spaced far enough apart to minimise overlap of shade.Each plot was treated with herbicide in late autumn or early winter 2008, with additional weedspraying undertaken approximately two weeks prior to planting. No additional spraying wasundertaken at the sites, but some hand-removal of weeds occurred after planting. Those plotsselected for direct-sowing were cleared of all existing vegetation (both live and dead matter) andsurface soil by scraping with a rake-hoe, to provide an ideal seed-bed.The species selected for planting and sowing were locally indigenous riparian species. At theHappy Valley and Kiewa River sites, the six species used were a mixture of trees and shrubs,while at the Campaspe River site the sedge Carex appressa was also planted (Table 2). The seedmix used in the direct seeding was composed of the same species as the tube-stock at HappyValley, but additional species were included in the seed mix sown at Campaspe River.Tube-stock were hand-planted at spacing of 1.6 m x 1.6 m. The number of plants per plot rangedfrom 11 – 33, depending on plot size. The allocation of plant species to planting positions withinthe plots was haphazard, with the exception of the sedge at Campaspe River which was alwaysplanted at the riverside edge of the plot. All plants were watered-in and protected with a treeguard after planting. Plants at all sites were watered again on one or two occasions in springand/or mid-summer, depending on the patterns of local rainfall.Hand broadcasting was used to sow the seeds. Seeds of Acacia species were broadcast in the firstpass over a plot. The plots were then lightly raked and the remaining species were sown in asecond pass. The Acacia seeds had been pre-treated with heat prior to sowing.
Planting and sowing were undertaken at the Happy Valley and Kiewa River sites on 11-12 thAugust 2008 and at the Campaspe River site on the 24 th September 2008.71.2.6 MonitoringPlant heights were measured at the time of planting and again in December 2008, April 2009,December 2009 and April 2010, for all species except C. appressa, for which survival and healthwere recorded. At the Kiewa River site, some trees had grown to such an extent that it wasdifficult to measure plant heights during the second season. Measurement of the diameter atbreast height (dbh) was made on those trees in December 2009, as well as height measures, withdbh only measured in April 2010.The direct-seeded plots were assessed at the same time by undertaking thorough searches in six,1 m 2 quadrats which were randomly placed within each plot. The number of seedlings found inthe quadrats, and their heights, were recorded. The heights of seedlings which were foundelsewhere in the plots were also measured.The extent of tree defoliation and willow sawfly population levels were also assessed at duringeach site visit.On one occasion some months after planting, the light environment of each planting position forthe tube-stock was determined by measuring PAR (Photosynthetically Active Radiation). Thesemeasurements were made around midday on a clear, sunny day which had a day-length as closeas was feasible to the longest day (mid-December to early-January).Light measurements were also made in the direct-seeded plots on the same day, to give anestimate of the light environment across those plots. Light levels were assessed at six positions ineach plot, three of these positions were spaced evenly along the riverside edge of the plot, andthree were spaced evenly along the landward edge of the plot.A line quantum sensor (Apogee Instruments Inc.) calculated Photosynthetic Photon Flux Densityfrom 10 PAR sensors measuring over a 70 cm length. The output from the ten sensors wasintegrated to give a single reading. This instrument recorded the number of photons in the 400 –700 nm range of the spectrum in units of µmol photons per metre 2 per second. The range of theinstrument was 0 – 2,000 µmol m -2 s -1 .The PAR measurements for each position in both the planted and direct-seeded plots wereconverted to percentage of full light available at the time of measurement by dividing the data byPAR measurements taken in the open within the same time period. This standardisation allowedfor comparison of the data between plots and between sites, as it accounted for variations inavailable light at the time of measurement.1.2.7 Data AnalysisAnalysis of Variance (ANOVA) (GenStat 12.0, 2009; VSN International Ltd.) was used toanalyse data. A one way ANOVA was used to test for the effect of willow tree treatment on plantsurvival at each site, across all species.
8A two way ANOVA was used to compare seedling heights of the different species with willowtree treatment as a factor. Log 10 transformations were performed on datasets to approximate anormal distribution. The data for each site were analysed separately.Further analysis was undertaken on the Kiewa River seedling height data. In order to comparethe growth of different species, the relative growth rates (RGR) of each species were calculatedas follows:RGR = Final Height – Initial HeightInitial HeightA two way ANOVA was then used to test the effects of species and of willow treatment on RGR.RGR data were not calculated for the remaining two sites because growth rates throughout thetrial were adversely affected by browsing.In the body of this report, any reference to a significant difference between variables indicatesthat the result was significant at the 5% level (P
91.3 Results1.3.1 <strong>Willow</strong> <strong>Sawfly</strong> Population Levels and Tree DefoliationPopulations of willow sawfly at the Kiewa Valley site were high at the outset of the trial andwere maintained throughout the trial period, with whole tree defoliation occurring in both the2008/09 and 2009/10 seasons.However, despite high populations at Campaspe River in 2007/08, prior to trial establishment,willow sawfly numbers were very low in both the 2008/09 and 2009/10 season and treedefoliation did not occur throughout these seasons. Thus this site operated more as a “control”site for willow sawfly defoliation, with the non-injected trees maintaining their canopiesthroughout each growing season.The Happy Valley site maintained very low willow sawfly populations in 2008/09. However, in2009/10, populations increased dramatically and whole tree defoliation occurred throughout thelength of the site, including on the trees in this trial (Section 2.3.1). Defoliation was first evidentin late December 2009 and high levels of defoliation were maintained until the end of the season.Thus this site switched from being a low willow sawfly population site in the first season of thetrial to a high willow sawfly population site in the second season.1.3.2 Plant Survival (Tube-Stock)More than 80% of plants were alive at the end of the first season across all sites (Table 2), withall but four plants surviving at the Kiewa River site. There was some mortality in the secondseason with overall survival decreasing by about 10% at Happy Valley and Campaspe River,while plant survival at Kiewa River remained high (Table 2).Species with the lowest survival rates were tree violet at Happy Valley (53%) and silver wattle(57%) and tall sedge (56%) at Campaspe although there was no additional mortality of tall sedgeplants in the second season (Table 2).Statistical analysis of survival data (Table i, Appendix 1) found no difference in plant survivalbetween tube-stock planted under trees which had been stem-injected and those planted undernon-injected trees at any of the trial sites, when all the species data were combined.<strong>Willow</strong> sawfly eggs (left) and larvae (right). Photos: DPI Victoria and Valerie Caron
10Table 2: Survival of Tube-Stock Planted at Three Trial Sites in Winter 2008Site and Species Common Name Survival atApril 2009Survival atApril 2010Happy ValleyEucalyptus camaldulensis river red gum 80% 68%Acacia dealbata silver wattle 89% 75%Acacia melanoxylon blackwood 94% 94%Callistemon sieberi river bottlebrush 96% 89%Melicytus dentatus tree violet 73% 53%Kunzea ericoides burgan 94% 81%Overall Survival: 88% 78%Kiewa RiverEucalyptus camaldulensis river red gum 100% 100%Acacia dealbata silver wattle 98% 96%Acacia melanoxylon blackwood 93% 93%Callistemon sieberi river bottlebrush 100% 98%Melicytus dentatus tree violet 93% 86%Bursaria spinosa sweet bursaria 95% 86%Overall Survival: 97% 94%Campaspe RiverEucalyptus ovata swamp gum 89% 83%Eucalyptus viminalis manna gum 87% 71%Acacia dealbata silver wattle 77% 57%Acacia melanoxylon blackwood 90% 85%Acacia retinodes wirilda 96% 79%Carex appressa tall sedge 56% 56%Overall Survival: 84% 73%1.3.3 Plant Growth (Tube-stock)1.3.3.1 Happy Valley SiteThose plants which were closest to the river were flooded on one or two occasions in spring andearly summer 2009, indicating that the site was not moisture limited early in the season.Plants at this site had been severely affected by browsing in the 2008/09 season and averageplant heights had not increased for any species except blackwood (Ede et al. 2009). Browsingdamage was evident again in 2009/10, although it appeared to be occurring at a lower intensity.<strong>Weeds</strong> had grown up in the plots around the plants and in some cases, these weeds may haveprovided some protection against browsing, particularly the thistles.Despite this browsing, average plant heights did increase through the 2009/10 season (Table 3) asregrowth from browsed stems grew more strongly. For all species, average heights increased by
50% - 100% between December 2009 and April 2010. As a result of this growth in the latter partof the season, all species recorded an overall increase in average plant height from plantingwhich ranged from 24% for river red gum through to 456% for blackwood (Table 3).One river red gum plant grew very strongly at this site, and by April 2010 was 2.5 m tall. Thisplant was protected from browsing by a fallen branch which surrounded it on all sides. Thegrowth of this individual does indicate that strong plant growth would be possible at this site inthe absence of browsing pressure. Removing this individual from the dataset results in an averageplant height for the remaining river red gums of 57.7 cm in April 2010, which is only slightlytaller than the average height of this species at planting (54.5 cm), indicating that this species hasbeen severely affected by the browsing pressure.A small number of plants, including other river red gums, acacias and a river bottlebrush, weremore than 1 m tall when measured in April 2010, but the tallest of these, a silver wattle at 1.53 mtall, was almost one metre shorter than the protected river red gum.In addition to browsing, future plant growth at this site is likely to be limited by herbicidedamage observed in April 2010. Information from the land-owner indicated that spraying hadoccurred in the period just prior to trial monitoring, but that every effort was made to avoid theplants in the trial. It is likely that some plants will recover as damage was not severe on all plants,but others may not survive.111.3.3.2 Kiewa River SiteAt the Kiewa River site, plants continued to grow strongly in the 2009/10 season with severalriver red gum and silver wattle trees reaching more than 3 m in height by the end of the season.The tallest tree, a silver wattle, was estimated to be 5.5 m tall in April 2010. Because the heightsof the tallest trees were not able to be accurately measured, the height data included only theshorter trees which decreased the average heights presented in Table 3 for these two species. Forthe remaining four species, heights increased 3-5 fold between planting and April 2010.River red gum, silver wattle and blackwood were all significantly taller than river bottlebrush,tree violet and sweet bursaria at this site in December 2009 (Table ii, Appendix 1).As a substitute measure of growth, assessments of dbh were made on the larger trees inDecember 2009 and then again in April 2010. For river red gum the average dbh increased from1.5 cm to 2.5 cm over that period, while for the silver wattle trees the average dbh increased from2.4 cm to 3.4 cm.Most plants at this site were healthy when measured, although some insect damage was evidenton a limited number of individuals. Some plants were also affected by weed competition, beingovergrown by grasses, thistles and other herbaceous weeds, with some particularly affected bybindweed (Convolvulus spp.).A limited amount of natural regeneration occurred in two plots at the site, with one self-sownacacia and four eucalypt seedlings observed. In April 2010, these plants ranged in height from1.3 – 2.9 m.
12Table 3: Average Height of Seedlings at Planting (Winter/Spring 2008), in December 2009and in April 2010 and Change in Plant Height over TimeSpeciesPlantingHeight (cm)Height inDec 09 (cm)Height inApril 10 (cm)Change in Height:Planting – Apr 10(cm and % change) 1Happy Valleyriver red gum 54.5 44.4 69.0 12.9 (24%)silver wattle 44.2 42.3 74.4 30.9 (70%)blackwood 14.4 49.1 80.2 65.6 (456%)river bottlebrush 24.0 32.0 51.7 28.3 (118%)tree violet 25.1 24.3 46.9 18.5 (74%)burgan 30.9 28.5 56.0 24.5 (79%)Kiewa Riverriver red gum 66.7 192.0 228.1 2 - 3silver wattle 44.6 240.4 268.2 4 - 3blackwood 30.9 161.8 188.8 158.6 (513%)river bottlebrush 31.4 123.1 151.1 119.9 (382%)tree violet 26.5 64.6 106.8 80.8 (305%)sweet bursaria 37.8 109.5 143.6 104.9 (278%)Campaspe Riverswamp gum 17.9 37.6 32.1 14.6 (82%)manna gum 24.7 41.8 37.1 12.6 (51%)silver wattle 7.2 31.8 32.5 25.6 (355%)blackwood 43.0 48.7 46.1 2.3 (5%)wirilda 44.2 40.3 50.5 5.4 (12%)1 The data relating to change in planting height have been calculated using heights from only those plants whichsurvived until April 2010;2 Data exclude 3 tallest trees which were unable to be measured accurately;3Not calculated as data exclude tallest trees;4 Data exclude tallest 13 trees.1.3.3.3 Campaspe River SiteSevere browsing continued to be the major impediment to plant growth at Campaspe River in the2009/10 season. The average heights of swamp gum, manna gum and blackwood all decreasedbetween December 2009 and April 2010 and overall increases in plant height from the time ofplanting were very low for blackwood and wirilda (Table 3). Although silver wattle plantsincreased in height by a factor of 3.5 over the two seasons, the average planting height was only7.2 cm so this increase only resulted in an average height of 32.5 cm in April 2010 (Table 3).In December 2009, the average heights of silver wattle and blackwood were similar at theCampaspe and Happy Valley sites, but as a result of the ongoing browsing at Campaspe River,the Happy Valley plants were more than 30 cm taller on average by April 2010 (Table 3).
The tallest plants at this site in April 2010 were two blackwood plants (111 and 117 cm tall) andtwo wirilda plants (110 and 183 cm tall). Overall, blackwood and wirilda plants were taller thansilver wattle and swamp gum plants (Table ii, Appendix 1).A small number of plants which had been planted in the areas outside the plots had survivedintense weed competition and were growing strongly, in comparison to many of the plants withinthe plots which exhibited very poor health as a result of browsing. The average heights of theseplants ranged from 38 cm for swamp gum to 100 cm for wirilda (Table 4), with one wirilda planthaving a height of 182 cm.Table 4: Average Heights in April 2010 of Additional Tube-stock Planted Outside TrialPlots in Spring 2008 at Campaspe RiverSpeciesHeight inApril 2010 (cm)Number ofPlantsswamp gum 38 2manna gum 74 3silver wattle 57 8blackwood 70 6wirilda 100 913Although the heights of the tall sedge plants were not measured, those that were still alive inApril 2010 were in good health and growing strongly, indicating that they were well establishedat this site.1.3.4 Effect of <strong>Willow</strong> Tree Treatment on Heights and Relative Growth Rates<strong>Willow</strong> tree treatment did not affect seedling height of any species at any of the sites, indicatingthat the heights of seedlings under those willows which were stem-injected were not differentfrom the heights of those growing under untreated willows. The interaction between willow treetreatment and species was also non-significant at all sites (Table ii, Appendix 1).The relative growth rates (RGR) of the six species planted at Kiewa River were calculated toaccount for the difference between species in plant height at the time of planting. RGR were notaffected by willow tree treatment, nor was the interaction between willow tree treatment andspecies significant (Table iii, Appendix 1). However, there were highly significant differences inRGR between the species (Table iii, Appendix 1). The RGR of silver wattle, blackwood and riverbottlebrush, which ranged between 3.2 and 4.9, were significantly higher (Table iii, Appendix 1)than the RGR of river red gum, tree violet and sweet bursaria (range from 1.7 - 2.0).1.3.5 Light Environment for Tube-stockOne of the key impacts of willow sawfly defoliation of willow trees is the increase in the lightavailable to the understorey, which enhances recruitment opportunities for other riparian species.This trial was designed to test whether this change in light environment under defoliated willowswas sufficient to promote the growth of native riparian species.
14Table 5: Average Relative Light Levels at Tube-stock Planting Positions in Plots UnderStem-injected <strong>Willow</strong>s and Untreated <strong>Willow</strong>sSite and <strong>Willow</strong> TreeTreatmentPlotAverage Light Levelsat Planting PositionsRange of Light LevelsWithin PlotsHappy ValleyStem-injected 1 82% 27 - 99%2 23% 1 - 98%3 87% 36 - 100%4 61% 3 - 100%Tree untreated 1 7% 3 - 16%2 1% 0.4 - 3%3 2% 0.5 - 10%4 4% 0.5 - 14%Kiewa RiverStem-injected 1 75% 31 - 100%2 75% 15 - 100%3 54% 7 - 81%4 58% 23 - 91%Tree untreated 1 17% 4 - 55%2 19% 3 - 56%3 47% 7 - 100%4 13% 4 - 43%Campaspe RiverStem-injected 1 58% 2 - 100%2 77% 7 - 100%3 38% 4 - 85%4 5% 2 - 16%Tree untreated 1 3% 0.5 - 26%2 10% 1 - 47%3 4% 1 - 35%4 8% 2 - 39%The assessment of the light available to seedlings were only made on one occasion during thetrial and as such, the data represent a snapshot of the light environment experienced by theseedlings. Most seedlings would receive highly variable levels of light on both a daily and aseasonal basis, resulting from both the position and angle of the sun, cloud cover, and also windconditions which affect the movement of canopies and the presence of sun-flecks.Taking into account these factors, and the conversion of the raw PAR data to percentage ofavailable light (Section 1.2.6), it must be recognised that the data presented in Table 5 representthe relative, rather than absolute, light environments for seedlings in the different plots at each
161.3.6 Direct Seeding1.3.6.1 Happy Valley SiteEstablishment of seedlings from direct seeding has been very limited at this site. At the end ofthe first season after sowing, in April 2009, 22 acacia seedlings and seven burgan seedlings werefound across the eight plots (Ede et al. 2009).Although seedling numbers remained low in the second season, there was some evidence ofestablishment of silver wattle and burgan seedlings, with a number of seedlings found at samelocations in April 2010 as previously. Some of these seedlings were relatively tall (Table 6).There was no significant difference (Table iv, Appendix 1) in the number of seedlings found inplots under stem-injected willows compared with plots under untreated willows, nor was thereany significant relationship between willow tree treatment and the heights of silver wattleseedlings (Table v, Appendix 1). Analysis of the data relating the heights of the burgan andeucalypt seedlings was not undertaken as there were too few plots containing these seedlings toallow meaningful analysis.Table 6: Height of Seedlings Established in the Direct Sowing Plots at the Happy ValleySite, Assessed in April 2010<strong>Willow</strong> TreeTreatmentPlot Species Number ofSeedlingsAverageHeight (cm)MaximumHeight (cm)Stem-injected 1 silver wattle 1 60 602 silver wattle 12 61 1033 -4 silver wattleburganTree untreated 1 burgan 1 17 172 silver wattle 2 113 1803 eucalyptsilver wattleburgan24133024224435484 silver wattle 2 31 383251147419Given the longevity of seed viability of a number of the species included in the sowing mix, it islikely that additional seedling establishment will occur in these plots over time, if conditions arefavourable.However, it was noted during the April 2010 assessment that a number of the plots had recentlybeen sprayed with herbicide, as had occurred in the planted plots (Section 1.3.3.1). It is unclearhow many seedlings had been affected by the spraying but in one plot which had had 14seedlings in December 2009, only one seedling could be found in April 2010.
171.3.6.2 Campaspe River SiteThe poor rate of seedling establishment observed in the first season of the trial at the CampaspeRiver site continued into the second season. In April 2009, 13 acacia seedlings had been found inall plots across the site, with heights ranging from 2 - 6 cm (Ede et al. 2009).Assessments undertaken 16 months after sowing, in January 2010, found a total of six acaciaseedlings ranging in height from 2 - 7 cm tall. At the final assessment, undertaken in late April2010, only three seedlings were found. One of these was a very small acacia (1 cm tall), but twowere reasonably well established silver wattle seedlings at 61 and 72 cm tall. Seedlings were notfound of any species other than acacia during any of the assessments.1.3.7 Light Levels in Direct-Seeded PlotsAt the Happy Valley site, average relative light levels in the direct-seeded plots under the steminjectedtrees ranged from 68% to 92% of full light. Under the non-injected trees, averagerelative light levels ranged from 3% to 6%.The average relative light levels measured at the Campaspe site under stem-injected trees rangedfrom 61% to 90%, while under non-injected trees they were 2 - 6%.1.3.8 Stem Injection <strong>Trials</strong>As noted earlier (Section 1.2.1), a trial was carried out to test the efficacy of stem injectiontreatments on willows which had been defoliated buy willow sawfly. At three sites in north eastVictoria, the results of this trial were inconclusive. However, at a site on the Goulburn River incentral Victoria, results were more clear-cut. <strong>Willow</strong> trees were stem-injected about 6 weeksafter tree defoliation had occurred. The stem injection treatments were as effective at killing thedefoliated trees as treatment of trees unaffected by willow sawfly.Anecdotal evidence from New South Wales (Jeff Cottrell, pers. comm.) has also shown that steminjection of willows defoliated by willow sawfly has been effective in killing those willows,although in some cases defoliated trees took longer to die than those which were not defoliated.Although these results indicate that stem injection is as effective on willows defoliated by willowsawfly as on those willows which are not, it should be noted that the trial was not able to treattrees immediately after defoliation, when the greatest amount of refoliation was occurring. It maystill be preferable to avoid stem injecting trees at the peak of the refoliation process if possible, tomaximise the efficacy of the stem injection treatment.
18Key Points: <strong>Willow</strong> trees were defoliated by willow sawfly in 2008/09 and 2009/10 at the KiewaRiver trial site and at the Happy Valley trial site in 2009/10; There was no defoliation at the Campaspe River trial site; After two seasons, plant survival was >90% at Kiewa River and >70% at the other twosites; Growth of tube-stock was strong at Kiewa River for all species, with river red gum andsilver wattle plants more than 2 m tall, on average, at the end of the 2009/10 season; Browsing severely limited plant growth at the remaining two sites; There was no difference in plant survival or growth at any site between those seedlingsplanted under stem-injected trees and those planted under untreated trees; Seedling establishment was poor in plots which had been direct-seeded at both HappyValley and Campaspe River; Light levels were lower under untreated willows than stem-injected willows or thosedefoliated by willow sawfly; In the stem injection trial, it was found that trees which were treated about 6 weeks afterdefoliation by willow sawfly were killed by the herbicide application.Measuring dbh on silver wattle at Kiewa Site April 2010. Photo: DPI Victoria
191.4 Discussion1.4.1 Establishment of Native Species1.4.1.1 Restoring Native Riparian CommunitiesThe restoration of healthy riparian vegetation communities dominated by native species is thedesired outcome of most willow management activities.This trial has shown that it is possible to establish native species under willow canopies, but ithas also highlighted that assessing the survival of tube-stock as a measure of success can bemisleading. Across all three trial sites, survival rates two seasons after planting were 75% orgreater for the majority of species. However, these high survival rates are indicative of successfulprogress towards the restoration goal at only one site (Kiewa River) where the planted seedlingshave thrived. The growth rates of these plants and the observation that some of the silver wattlesare already reaching reproductive maturity indicates that the tube-stock planted at Kiewa River inwinter 2008 are well on the way to forming a healthy, self-sustaining riparian communitydominated by native species.1.4.1.2 Barriers to Establishment of Tube-StockA) Weed CompetitionFor many restoration projects, weed management is the critical factor determining success orfailure in the long-term. Pre-planting weed control is crucial to provide tube-stock with the bestpossible chance of establishing at a site and in many instances, post-planting weed managementis also required to minimise weed competition.However, at the three sites in this trial, weed competition had a relatively minor impact on plantsurvival and growth. At Kiewa River, some plots were overrun with herbaceous weeds,particularly in the first season, but most plants in those plots were able to grow up above theweeds. It appears that at this site, the deep soils and high soil moisture levels were sufficient tomaintain the growth of both the planted seedlings and abundant weeds.There were some plants at this site though, which were overgrown with the herbaceous climber,bindweed. This weed, like cape ivy and other scrambling species, can grow up saplings and limittheir growth. In severe infestations, the weight of the weed may be sufficient to completely pullover the sapling.At the Happy Valley and Campaspe River sites, competition from exotic grasses and otherherbaceous weed species may have affected plant survival and growth, but any impact was notreadily apparent. Those seedlings which survived outside the plot areas (Section 1.3.3.3)illustrate this point. These seedlings had been planted into unsprayed areas of the site and onlyvery minor hand-clearing of weeds was undertaken at the time of planting. Despite growing inamongst a dense sward of pasture grasses, these seedlings exhibited very strong growth,indicating that if planted seedlings can survive the initial establishment phase, then weedcompetition may become less of a limiting factor.
20B) BrowsingAt both Happy Valley and Campaspe River browsing by feral animals, probably a combinationof deer, rabbits, hares and wallabies, was the major limiting factor preventing plant growth. Sodespite the exclusion domestic stock, restoration of the native riparian community was hamperedby the activities of these animals.A cycle of browsing, regrowth, browsing and more regrowth was obvious on the majority ofseedlings at both these sites, with all species affected to some extent. Tree heights for a numberof seedlings corresponded with the top of the tree guards, with any growth that emerged abovethe tree guard being consumed. There was also some browsing of plant matter lower down,within the tree guards.At Happy Valley, the browsing pressure lessened in the latter half of the 2009/10 season,possibly because there were high levels of other feed available after good spring rains. Thisallowed the plants at this site to grow beyond the height of the tree guards. However, it ispossible that this new growth will be browsed over coming months.This situation raises several interesting questions. The first of these relates to the use of treeguards, particularly at sites where relatively few seedlings are planted. At both Happy Valley andCampaspe River, only about 200 seedlings were planted into a landscape devoid of seedlings,which would be insufficient to satiate the appetites of the local herbivore populations. Althoughtree guards do provide a level of protection against browsing, they also draw attention to theplants and it is possible that their presence highlights the locality of browse to the animals. Thelack of tree guards on the additional seedlings at Campaspe River planted outside the trial plots,and their location within dense grass, may have provided these seedlings with protection frombrowsing.It is also possible that the cycle of browsing, regrowth and browsing again encourages the strongdevelopment of below-ground tissues in the affected seedlings, so that if browsing pressure isreleased, the seedlings can quickly attain greater above-ground growth from the resources storedin the root system.There are some possible options to overcome browsing at sites with high levels of herbivores,such as investing in animal-proof fencing or bait deterrents. These options can be expensive, butmay be the only solutions at some sites until plants are established. It is also possible that stagedreplanting would alleviate some of the pressure, with less palatable species being initiallyestablished at a site. At some sites, avoiding the use of tree guards may be beneficial, whileexperimenting with a range of different types of guards can help determine which give the bestprotection at a site.
211.4.1.3 Barriers to Establishment from Direct SeedingA) DroughtAt the two sites in this trial where direct seeding was carried out, there was very poorestablishment of seedlings. The most likely explanation for this outcome is the very dry springand summer that followed sowing. The condition of the direct-seeded plots at the CampaspeRiver site provided good evidence of the impact of the lack of rainfall, with many plotsremaining bare of vegetation in the months following seeding, despite the abundance ofherbaceous weeds nearby. The soil surface of these plots was extremely dry for much of thesummer, indicating that any seedlings which might have germinated would have faced verydifficult growing conditions.Further evidence for the impact of the dry conditions on the lack of seedling establishment in thedirect-seeded plots comes from Happy Valley where there was a moderate overstorey of variousacacia species, as well as some eucalypts. It would be expected that the disturbance associatedwith the creation of the direct seeding plots would stimulate mass germination from the existingseed bank, particularly of acacia seedlings. This was not observed despite inspections of the plotsat 4 – 6 weekly intervals throughout the first season of the trial, indicating that conditions werenot favourable for establishment of seedlings from any seed at this site.Such mass establishment of acacia seedlings from the soil seed bank has been observed at a siteunder study as part of another project. Located on the Upper Bass River in West Gippsland thissite was sown in October 2009, and watered in November. Good late spring and summer rainshave meant that soil moisture levels at this site have remained high, promoting extensive seedlingestablishment. The most abundant seedlings at the site are silver wattle seedlings, which have allarisen from the soil seed bank (no silver wattle seed was included in the seed mix sown in thearea). Some of these seedlings are already more than 2.5 m tall.B) Weed CompetitionAlthough weed competition is likely to have had some impact on seedling establishment in thedirect-seeded plots, the regrowth of weeds in these plots has been relatively modest, particularlyat Happy Valley. The density of weeds within plots is still much lower than the density outsideplots, and there are sufficient areas of bare ground available within plots for seedingestablishment.Thistles have dominated the weed flora in direct-seeded plots at Campaspe River and the growthhabit of these plants may have impaired the establishment of newly germinated seedlings.However, the extent of thistle cover across plots is unlikely to completely explain the lack ofseedling establishment.It is possible that browsing has also limited seedling establishment, but there is insufficientevidence to demonstrate the extent of this impact.1.4.2 Impacts of <strong>Willow</strong>s and <strong>Willow</strong> <strong>Sawfly</strong> on Light LevelsIntact willow canopies can reduce understorey light to very low levels, as measurements of PARat several sites over previous seasons have shown (Ede et al. 2007, Ede et al. 2009). Theabsolute amounts of light available can be as low as 10 – 20 µmol m -2 s -1 (0.5 – 1% of full light).
22Plant growth is limited under these dense willow canopies because the low light levels mean thatmany species are not able to photosynthesise at a rate which provides sufficient carbohydrates tomaintain growth. The light level at which photosynthesis (production of carbohydrates) balancesplant respiration (use of carbohydrates) is termed the light compensation point.The light levels measured under untreated willows at a number of the planting positions and inthe direct-seeded plots in this trial were below the expected light compensation points for manyspecies. Thus the shade cast by the trees in these plots was sufficient to inhibit plant growth.Treating the willows by stem injection removed the canopy, allowing greater levels of lightthrough to the understorey (Table 5). In most plots, the amount of light reaching seedlings wouldhave been sufficient to allow growth. Defoliation by willow sawfly also removed willow canopyincreasing understorey light levels as seen in the untreated trees at Kiewa River in Table 5.The results from Kiewa River, which was the only site in the trial to be affected by willow sawflydefoliation in both seasons, illustrate the impact of this defoliation on establishment of nativeseedlings. There was no significant difference between seedling survival, seedling heights orrelative growth rates between those plots under stem-injected willows and those under untreatedwillows. If the untreated trees had not been defoliated by willow sawfly, then seedling growthwould have been expected to be significantly lower under the intact canopies of these trees.Unfortunately it was not possible to thoroughly test this hypothesis from the data collected in thistrial as seedling growth was so limited by browsing at the two remaining sites. The CampaspeRiver site would have provided an ideal control for the Kiewa River as there was no defoliationof willows at this site during the trial, so growth rates under untreated trees would be expected tobe lower than those under stem-injected trees.The development of high willow sawfly populations at Happy Valley in the second season of thetrial may also have provided an interesting insight into the direct impact of tree defoliation onseedling growth, with contrasting growth rates in the two seasons, had there been adequategrowth at this site prior to the defoliation.Key Points: It is possible to re-establish native species under willows which have been defoliated; Barriers to successful establishment of tube-stock include browsing by herbivores andweed competition; Barriers to successful establishment of seedlings using direct seeding include drought andweed competition; In the riparian areas studied, weed competition had a lower impact on seedlingestablishment and growth than either browsing or drought; Very low light levels under intact willow canopies limit understorey plant growth; Defoliation, through stem injection or willow sawfly activity, increases available light tolevels which allow understorey growth.
231.5 <strong>Willow</strong> <strong>Sawfly</strong> Impacts on <strong>Willow</strong> <strong>Management</strong>1.5.1 Impacts of <strong>Willow</strong> <strong>Sawfly</strong> on <strong>Willow</strong>sThe outcomes of the management trials and the monitoring of willow sawfly impacts over fourseasons provide guidance on the potential repercussions on willow management by willowsawfly. Observations of willow sawfly impacts on willow trees have shown that:• whole tree defoliation is a dramatic, but relatively short-term effect of high willowsawfly levels;• repeated defoliation causes branch dieback;• repeated defoliation over four – five seasons has not yet killed entire trees at monitoringsites.It is unlikely that extensive willow tree deaths across the landscape will occur as a result ofwillow sawfly activities, although this possibility cannot be ruled out at this stage.1.5.2 Impacts of <strong>Willow</strong> <strong>Sawfly</strong> on <strong>Willow</strong> <strong>Management</strong>It is unlikely that willow sawfly infestations will affect willow management decisions in mostinstances.At sites where willow sawfly levels remain low, no changes to willow management activities arerequired.At sites where willow sawfly is causing defoliation, there are some circumstances where changesto willow management may be appropriate:1. Sites to be treated with stem injection:- delay stem injection until the peak of willow refoliation has passed.2. Sites at which no willow management is planned:- re-establishment of native vegetation can be achieved through planting tube-stock,direct seeding or natural regeneration under defoliated trees, if appropriate sitepreparation and maintenance (including management of browsing) is undertaken.
24Section 2: Monitoring <strong>Willow</strong> <strong>Sawfly</strong> Populations and Defoliation2.1 IntroductionRegular monitoring of willow sawfly populations has been undertaken at several sites in northeastand southern Victoria since 2006/07 (reported in Ede et al. 2007 and Ede et al. 2009). Themonitoring sites include those with both high and low willow sawfly populations and at severalsites, trees have been defoliated. A range of willow taxa have been monitored across the sites.In previous seasons intensive monitoring of willow sawfly populations, defoliation, tree canopydensity, leaf area and light levels under willow canopies had been conducted at selected sites atfrequent intervals throughout the growing season. It was determined that there was little benefitto be gained in continuing monitoring at this intensity, although long term monitoring could stillprovide useful insights. For this reason, in the 2009/10 season site assessments were restricted towillow sawfly population counts and estimates of the extent of tree defoliation.The purpose of the monitoring program has been to determine the impact of willow sawfly onwillows and on their management.2.2 MethodsNine sites were monitored in the 2009/10 season (Table 7). Most sites were located in north-eastVictoria where sawfly is more prevalent. All sites had been monitored for at least two seasonsprior to the 2009/10 season. A more extensive description of sites can be found in Ede et al. 2007and Ede et al. 2009.Sites were monitored up to five times during the season, from spring until autumn. At eachassessment two parameters were monitored:1. willow sawfly population levels;2. extent of tree defoliation.<strong>Willow</strong> sawfly population levels were estimated by counting the number of larvae visible on allaccessible foliage during a defined five minute period. All sizes of larvae were counted and otherstages of the life cycle were noted if present.The extent of defoliation of the tree canopy was estimated by one observer, and recorded aspercentage of total canopy defoliated by willow sawfly. In some situations whole tree defoliationwas not evident, but a small number of branches had been defoliated or isolated leaves had beenreduced to mid-ribs only. These occurrences were noted, but not scored as tree canopydefoliation.At two sites (Kiewa and Kergunyah), assessments of the ratio of live: dead material had beenmade in two previous seasons and these assessments were repeated in spring 2009. Theseassessments were visual estimates of the ratio of live: dead material over the whole tree. As such,judgements were difficult to make, so the results are subjective and give only an indication of theextent of change over time rather than an absolute measure.
Table 7: Site Locations, <strong>Willow</strong> Taxa Present and <strong>Willow</strong> <strong>Sawfly</strong> Population Levels inPrevious Seasons for Sites Monitored in 2009/10 SeasonSite River <strong>Willow</strong> Taxa Assessed PopulationsPrior to 2009/1025Baranduda(NE Vic)BeechworthCamp Ground(NE Vic)Everton(NE Vic)Happy Valley(NE Vic)Healesville(Southern Vic)Kergunyah(NE Vic)Kiewa(NE Vic)Leneva West(NE Vic)Tarago(Southern Vic)Finns Creek Black willow (Salix nigra) Low - highSpring Creek Grey sallow (S. cinerea) LowOvens RiverHappy ValleyCreekBlack willow (S. nigra)Crack willow (S. fragilis)Golden upright (S. alba var. vitellina)Purple osier (S. purpurea)Weeping willow (S. babylonica)Crack willow (S. fragilis)Low - highLowKelly’s Creek Crack willow (S. fragilis) LowTributary toKiewa RiverKiewa RiverMiddle CreekS. x rubens HighCrack willow (S. fragilis)Weeping willow (S. babylonica)Crack willow (S. fragilis)Pussy willow (S. x reichardtii)Weeping willow (S. babylonica)HighLowTarago River S. x rubens High - low
262.3 Results2.3.1 <strong>Willow</strong> <strong>Sawfly</strong> Population Levels<strong>Willow</strong> sawfly populations were maintained at low levels in the 2009/10 season at most siteswhere they had been low in the 2008/09 season – Beechworth, Healesville, Leneva West andTarago (Table 8) and consequently no tree defoliation was observed at these sites (Table 9).High willow sawfly populations continued to persist at the Everton and Kergunyah sites (Table8), as had been the case in previous seasons. The highest numbers of larvae were found atEverton in December on the black, crack and golden willows, while at Kergunyah populationlevels were highest in March (Table 8). There was some oscillation of larvae numbers throughthe season as site visits coincided with different stages of the population development cycle.Table 8: <strong>Willow</strong> <strong>Sawfly</strong> Populations Assessed Throughout the 2009/10 Season on Various<strong>Willow</strong> Taxa at Monitoring SitesSite<strong>Willow</strong>TaxaAverage Number of <strong>Willow</strong> <strong>Sawfly</strong> Larvae Found in 5Minute CountOct/Nov09Dec 09 Jan 10 Mar 10 Apr 10Baranduda Black - 1 22 1 - 25Beechworth Grey - 1 2 - 0Everton Black 2 108 23 1 4Crack 3 167 2 40 9Golden 0 111 14 16 2Purple 0 56 0 0 0Weeping 0 22 - 0 0Happy Valley Crack 2 16 76 22 13Healesville Crack 0 4 1 1 1Kergunyah S. x rubens 4 18 7 72 11Kiewa Crack 2 8 0 1 1Weeping 0 6 0 0 0Leneva Crack - 7 1 - 5Pussy - 0 0 - 0Weeping - 1 0 - 0Tarago S. x rubens 0 2 2 10 61 Some sites were not assessed at every monitoring point throughout the seasonAt the remaining sites, willow sawfly populations in the 2009/10 season developed differently incomparison with previous seasons. <strong>Willow</strong> sawfly populations had been high at the Kiewa sitesince willow sawfly was reported in north-east Victoria in December 2005. However,populations failed to increase to high levels in 2009/10 on either the crack or weeping willows(Table 8). As a consequence, no tree defoliation was noted at this site (Table 9). It is unclear whywillow sawfly numbers were so low at Kiewa this season.
High willow sawfly numbers were also found at the Baranduda site in both 2007/08 and 2008/09,although tree defoliation only occurred in 2007/08 (Ede et al. 2009). In the 2009/10 season,willow sawfly numbers were low throughout the season (Table 8) and no tree defoliation wasobserved (Table 9).In contrast, after three seasons of very low populations, willow sawfly numbers at Happy Valleyincreased to high levels (Table 8), and caused considerable tree defoliation (Table 9). Themonitoring site at this location is situated in a corridor of willows that stretches for about onekilometre along Happy Valley Creek. Defoliation of willows was first noticed at the western(downstream) end of this corridor in late December 2009, and as the season progressed, the waveof defoliation spread eastwards (upstream) along the creek. The trees that are monitored wereamongst the last to be defoliated.<strong>Willow</strong> sawfly population levels at Happy Valley were low throughout the 2008/09 season (Edeet al. 2009) and there was no indication that numbers would increase in 2009/10 as dramaticallyas they did. However, whole tree defoliation has been evident in previous seasons on willows inneighbouring sites particularly on the Ovens River nearby, so willow sawfly populations in thevicinity have been high for the last two seasons. This may explain the increase in numbers at theHappy Valley monitoring site in 2009/10.272.3.2 <strong>Willow</strong> Tree DefoliationSubstantial whole tree defoliation of willows did not occur at any site until the latter part of theseason, although some limited leaf and branch damage as a result of willow sawfly activity wasobserved during the December assessments at Everton and Kergunyah.The highest levels of tree defoliation across most taxa at Everton were observed in January(Table 9) which followed the peak in willow sawfly number in December (Table 8). Thecanopies of the black willows recovered substantially later in the season. However, there waslittle recovery of crack willow canopies as regrowth was consumed by new generations of willowsawfly. The regrowth of golden willows canopies also remained incomplete for the rest of theseason. The purple osiers were not substantially defoliated by willow sawfly (Table 9) despitehigh willow sawfly numbers in December (Table 8). However, the overall health of these shrubswas not good.At Kergunyah, the foliage present on one tree in January was almost all regrowth, indicating thatfull tree defoliation had occurred prior to the assessment. By March, most of the foliage on alltrees was regrowth. The most severe defoliation was evident in April (Table 9), which followedthe peak in willow sawfly numbers at the site observed in March (Table 8).As described above (Section 2.3.1), whole tree defoliation across the entire Happy Valley Creeksite was first noticed in late December. Defoliation of the trees in the monitoring area was verylimited in January but increased as the season progressed (Table 9). In March, defoliation wasmore apparent on the river-side of the trees monitored than the landward side, but by Aprildefoliation was severe across the entirety of tree canopies.
28Table 9: <strong>Willow</strong> Tree Defoliation at Monitoring Sites in 2009/10 SeasonExtent of Tree DefoliationSite <strong>Willow</strong> Taxa Jan 10 Mar 10 Apr 10Baranduda Black 0% - 1 0%Beechworth Grey 0% - 0%Everton Black 70% 5% -Crack 95% 70% 70%Golden 100% 40% -Purple 5% 20% -Happy Valley Crack 1% - 5% 70% 90%Healesville Crack 0% 0% 0%Kergunyah S. x rubens 60% 50% 90%Kiewa Crack 0% 0% 0%Weeping 0% 0% 0%Leneva Crack 0% 0% 0%Pussy 0% 0% 0%Weeping 0% 0% 0%Tarago S. x rubens 0% 0% 0%1 Defoliation for some sites/taxa were not assessed at every monitoring point throughout the season2.3.3 Grey Sallow Defoliation at Happy ValleyAlthough low levels of willow sawfly have been present on grey sallow (S. cinerea) plants at theBeechworth Camp Ground site since the 2006/07 season (Ede et al. 2007), there has been noincrease in willow sawfly numbers over time at this site and no defoliation.At Happy Valley there are two grey sallow plants downstream of the monitoring site. InDecember, 5 minute counts were undertaken on these plants which found 36 larvae. Most of thelarvae were very small, but there were also appreciable numbers of fresh eggs, and one adult wasobserved at this time.By the time of the January assessment, these grey sallow plants had been defoliated by willowsawfly. Defoliation levels across the two plants were 60% - 80% and 107 larvae were foundduring a 5 minute count. In March, the defoliation of the two grey sallow plants was similar tothat seen in January, at 70% - 80%, but increased in April with one plant being >95% defoliated.This is the first recorded occurrence of willow sawfly defoliation of grey sallow in <strong>Australia</strong>.2.3.4 Extent of Tree DeathOverall between 2008/09 and 2009/10 there had been a slight decrease in the amount of livematerial on trees at Kiewa (Table 10). All trees at this site exhibited some level of small branch
and twig dieback. Epicormic shoots, estimated to be one – two years old, were also dead on sometrees.There was little change in the ratio of live: dead material in the trees at Kergunyah, with onlyTree 2 showing a decrease in live material (Table 10). There was some limited dieback of smallbranches and twigs on trees at this site.Overall at these two sites there has been little change in the extent of dead material between 2007and 2009, despite three seasons of high willow sawfly populations and whole tree defoliation.Table 10: Change in Ratio of Live: Dead Material on Trees Between October 2007 andOctober 200929Tree October 2007 October 2008 October 2009KiewaTree 1 90% live 80% live 70% liveTree 2 80% live No change 70% liveTree 3 90% live No change 80% liveTree 4 10% live - unhealthy 20% live - unhealthy 10% liveTree 5 60% live No change No changeTree 6 60% live No change 50% liveTree 7 80% live No change 90% liveKergunyahTree 1 40% live 60% live No changeTree 2 50% live 80% live 70% liveTree 3 80% live 90% live No changeTree 4 30% live 20% live Not assessedTree 5 80% live 90% live No changeTree 6 70% live No change No changeThe health of trees at other sites has also been noted, and a number of the willows at Everton arein poor health. One tree in the monitoring site appears to be dead, while other trees have verylimited numbers of live branches. However, as willows are adept at resprouting, it is difficult todetermine at this stage whether these trees will survive or die.It is still not possible to ascribe any willow tree deaths in Victoria solely to the activity of willowsawfly, although dieback of large and small branches does commonly occur on trees repeatedlydefoliated by willow sawfly. It is likely that tree health is compromised by willow sawflydefoliation and the combination of this impact with drought and age may be sufficient to hastenthe demise of some trees.
30Key Points: <strong>Willow</strong> sawfly population levels and extent of tree defoliation were monitored onwillows of various taxa at nine sites across Victoria throughout the 2009/10 season; After maintaining low population levels at Happy Valley Creek for three seasons,willow sawfly numbers exploded in 2009/10, resulting in extensive tree defoliation; Population levels at four other sites remained low, while levels decreased from high tolow at two sites, and remained high at two sites in 2009/10 in comparison with 2008/09; Tree defoliation occurred at Everton, Happy Valley and Kergunyah, with the mostextensive defoliation occurring approximately a month after a peak in population levels; Two grey sallow plants were extensively defoliated by willow sawfly at Happy Valley; The ratio of live: dead material on willow trees decreased slightly at Kiewa in 2009, butwillow sawfly does not yet appear to have killed any willow trees in Victoria.Defoliation of grey sallow atHappy Valley January 2010.Photo: DPI Victoria
2.4 Synthesis of Monitoring ProgramOver the four seasons of monitoring, there has been considerable variation in willow sawflypopulations both within sites and between sites (Ede et al. 2007, 2009).Low willow sawfly population levels have been maintained for four seasons at some sites,including on the crack willows at Healesville and the grey sallow at Beechworth. And for thethree seasons prior to 2009/10, willow sawfly numbers were low at Happy Valley as well. It ispossible that willow sawfly numbers increased at this site in 2009/10 as a result of highpopulations in neighbouring willow stands, whereas there are no stands of willow supportinghigh willow sawfly populations nearby to either the Healesville or Beechworth sites.At some sites, willow sawfly populations have been sufficiently high in previous seasons tocause defoliation, but in later seasons numbers have declined and defoliation has not occurred.This pattern has been observed at both the Tarago site and the Campaspe River management trialsite, where willow sawfly numbers were very high in the 2006/07 and 2007/08 seasons, but lowin 2008/09 and 2009/10. Tree defoliation was extensive when population levels were high, buthas not occurred in the past two seasons at these sites.This same pattern became evident at the Kiewa site in 2009/10, after four seasons of high willowsawfly populations and tree defoliation. In 2009/10 the population did not develop to high levelsand no defoliation was observed.In contrast, willow sawfly populations at the other two sites in the Kiewa Valley – the Kergunyahmonitoring site and Kiewa River management trial site – were high sufficiently high in 2009/10to cause extensive tree defoliation. Like the Kiewa site, willow sawfly had been active at theKergunyah site for the previous four seasons. High willow sawfly populations also developedagain at the Everton site in 2009/10, for the third season in succession, with extensive treedefoliation observed on three willow taxa at this site.There are no clear explanations for these observed patterns in willow sawfly populations overtime and between sites, as several biological and physical factors can affect population dynamics(Ede et al. 2009).The purpose of monitoring willow sawfly over several sites and several seasons was to determineif the insect was affecting willows and potentially their management. The most obvious impact ofhigh willow sawfly levels is whole tree defoliation, but in most instances, defoliated willows areable to regrow new foliage. Over time, dieback of both large and small branches has beenobserved on willow trees which have been repeatedly defoliated, but no willow tree deathsappear to have been caused solely by the activity of willow sawfly.Apart the very obvious impact of tree defoliation, there are no other visible or obvious signs thathigh willow sawfly populations affect willow tree health. The new foliage that regrows duringthe season is generally healthy, and at the outset of each new season, trees which had beendefoliated the previous season develop full canopies that appear to be as healthy as those on treesunaffected by defoliation. It is possible that reproductive capacity, root health and overall growthare all compromised by repeated defoliation, but these factors have not been investigated.31
32Section 3: <strong>Willow</strong> <strong>Sawfly</strong> Across <strong>Australia</strong>3.1 South Eastern <strong>Australia</strong>The known distribution of willow sawfly in <strong>Australia</strong> is presented in Fig. 2, with more detail ofsites in south eastern <strong>Australia</strong> provided in Fig 3. It must be noted that these maps provide datarelating only to those sites where willow sawfly has been found, and they do not include siteswhich have not been searched for willow sawfly.Very few reports of willow sawfly activity at new localities were received in the 2009/10 seasonin south eastern <strong>Australia</strong>. In Victoria a new infestation of willow sawfly was reported on theMitchell River at Hillside, just west of Bairnsdale in Gippsland (Neil Woodward, pers. comm.),while another new infestation was reported on Boggy Creek near Myrrhee in north east Victoria(Andrew Briggs, pers. comm.). In NSW, willow sawfly was reported on the McDonald River atBendemeer, south of Armidale, for the first time although willow sawfly has been active at thissite for two seasons (Birgitte Verbeek pers. comm.).The most common changes in willow sawfly distribution related to expansions of range within anarea, for example tree defoliation was noted along more southern reaches of the Kiewa River innorth east Victoria than had been obvious in previous seasons (Andrew Briggs, pers. comm.).Reports that were received indicated that the intensity of willow sawfly activities was perceivedto be lower than in previous seasons, with either less extensive areas of tree defoliation noted orlater and fewer defoliation events. For example, in north east Victoria, tree defoliation was lessextensive along the upper reaches Mitta Mitta River in comparison with the previous two seasons(Rebecca Damm, pers. comm.). Similarly, willows at a site on the Murrumbidgee River nearBredbo, NSW, which had been defoliated by willow sawfly in previous seasons were showing nosigns of defoliation by mid-February and willow sawfly numbers in the area were very low(Douglas Kerruish, pers. comm.).At other sites however, willow sawfly activity was still sufficiently high to cause extensive treedefoliation, for example throughout central Victoria. And as was discussed earlier (Section 2.3.1)willow sawfly populations at Happy Valley Creek in north east Victoria increased dramatically inthe 2009/10 season and caused extensive defoliation on all willow taxa along the creek. Despitehaving been present for the previous three seasons at Happy Valley Creek, willow sawflypopulations had not increased to the levels required to cause tree defoliation until the 2009/10season. It remains unclear why the population of willow sawfly remained low for so long, andwhy it then exploded in 2009/10.<strong>Willow</strong> sawfly is now widely distributed across south eastern <strong>Australia</strong> (Fig. 3) and there arelikely to be few areas with large numbers of willows which remain free of willow sawfly. Overcoming seasons, it is expected that willow sawfly will continue to expand its range to all areaswith willows, but that fluctuations in population levels will result in varying amounts of treedefoliation at the site scale.
33Figure 2: Known distribution of willow sawfly across <strong>Australia</strong> as at April 2010Figure 3: Known distribution of willow sawfly across south eastern <strong>Australia</strong> as at April2010
343.2 Western <strong>Australia</strong>The first report of willow sawfly in WA was received from Albany in March 2009 (Ede et al.2009) where weeping willow trees had been defoliated at a suburban property. A second report,this time from Bunbury, was also of willow sawfly defoliation of weeping willows in a suburbanbackyard.These two reports prompted a visit to southern WA by Fiona Ede and Valerie Caron in February2010. Several sites from Perth to Albany, and across to Bunbury were assessed for willow sawflywith the insect being found at all but three sites (Fig. 2). Populations were at low levels at mostsites.However, at three sites willow sawfly populations were high. These included the Albany sitewhere willow sawfly had once again defoliated the weeping willows, with the first defoliationevent for the season occurring in mid-December 2009. At the time of the site visit in February,the extent of tree defoliation was assessed at 80%.In addition to the trees affected at this property, willow sawfly defoliation was evident on severalwillow trees at a nearby park, with the extent of defoliation ranging from >90% on goldenupright willows (S. alba var. vitellina) to 40% on other willows (taxon unknown).The second site with high populations of willow sawfly was a park at Cowaramup, which is justnorth of Margaret River. At this site, willow sawfly was present on several tortured willows (S.matsudana ‘Tortuosa’), with 69 larvae found during 5 minute counts. Low levels of twigdefoliation were obvious, but whole tree defoliation was not yet apparent.The third site with high levels of willow sawfly was the backyard in Bunbury where treedefoliation had occurred for the second season, in early December 2009. <strong>Willow</strong> sawfly numberswere low at the time of the site visit, but the trees were still about 60% defoliated. While willowsawfly populations at this site have been high in both the 2008/09 and 2009/10 season, there havebeen no other reports of tree defoliation in other parts of Bunbury and two additional sites whichwere checked in February 2010 for willow sawfly had only very low populations.If the experience of willow sawfly in south eastern <strong>Australia</strong> is repeated in WA, it is likely thatwillow sawfly will continue to expand its range to all areas with willows over coming seasons. Itis also likely that populations will increase at some sites to the level required to cause whole treedefoliation and this may be extensive in some parts of the landscape. However, willow sawfly isunlikely to cause large scale willow tree death across WA.Key Points: <strong>Willow</strong> sawfly is widely distributed across south eastern <strong>Australia</strong>; <strong>Willow</strong> sawfly is now present at several sites in south western WA, and hascaused whole tree defoliation of willows at sites in Albany and Bunbury.
35Section 4: BibliographyARMCANZ (Agriculture and Resource <strong>Management</strong> Council of <strong>Australia</strong> and New Zealand,<strong>Australia</strong>n and New Zealand Environment and Conservation Council and ForestryMinisters) (2001). <strong>Weeds</strong> of National Significance: <strong>Willow</strong> (Salix taxa, excluding S.babylonica, S. x calodendron and S. x reichardtii) Strategic Plan. National <strong>Weeds</strong> StrategyExecutive Committee, Launceston. 33p.Baker, M.L. (2009). The willows (Salix – Salicaceae) in Tasmania. Muelleria 27(2):127-148Bruzzese, E. and McFadyen, R. (2006). Arrival of leaf-feeding willow sawfly Nematusoligospilus Förster in <strong>Australia</strong> - pest or beneficial? Plant Protection Quarterly 21(1):43-44Ede, F.J. (2006). <strong>Willow</strong> sawfly (Nematus oligospilus) in Victoria: Status report, July 2006.Department of Primary Industries, Victoria, <strong>Australia</strong>. 30 p.Available on: http://www.weeds.org.au/WoNS/willows/Ede, F.J. (2007). How can willow sawfly aid our willow management? Weed Society of VictoriaThird Biennial Conference ‘Earth Wind Fire Water and <strong>Weeds</strong>’ 3–4 October 2007, p16-18Ede, F., Caron, V. and Clements, D. (2007). <strong>Willow</strong> sawfly activity in Victoria: the 2006/07season. Department of Primary Industries, Victoria, <strong>Australia</strong>. 57 p.Available on: http://www.weeds.org.au/WoNS/willows/Ede, F.J. (2009). Can international experience help us to predict the potential impacts ofwillow sawfly (Nematus oligospilus Förster) on willow populations in <strong>Australia</strong>? PlantProtection Quarterly 24(2):62-66Ede, F., Hunt, T., Clements, D. and Caron, V. (2009). <strong>Willow</strong> sawfly activity in Victoria: 2007 -2009. Department of Primary Industries, Victoria, <strong>Australia</strong>. 51 p.Available on: http://www.weeds.org.au/WoNS/willows/Finlay, K.J. and Adair, R.J. (2006). Distribution and host range of the recently introduced willowsawfly, Nematus oligospilus Förster, on willows (Salix spp.) in southeast <strong>Australia</strong>.Proceedings of the 15 th <strong>Australia</strong>n <strong>Weeds</strong> Conference, eds C. Preston, J.H. Watts and N.D.Crossman (Weed <strong>Management</strong> Society of South <strong>Australia</strong>, <strong>Australia</strong>), 791-794Holland Clift, S. and Davies, J. (2007). <strong>Willow</strong>s national management guide: Currentmanagement and control options for willows (Salix spp.) in <strong>Australia</strong>. Published byDepartment of Primary Industries, Geelong, Victoria, <strong>Australia</strong>. 112 p.Other information pertaining to willow sawfly and willows in general can be found on the <strong>Weeds</strong>of National Significance (WoNS) website: http://www.weeds.org.au/WoNS/willows/
36Appendix 1: Details of Statistical AnalysesTable i: Results of One Way ANOVA to Test Effect of <strong>Willow</strong> Tree Treatment on Survivalof Tube-Stock over Two SeasonsSite Date Assessed n 1 d.f. 2 F ratio P valueHappy Valley April 2009 4 1 0.02 0.886April 2010 4 1 0.71 0.432Kiewa River April 2009 4 1 2.78 0.147April 2010 4 1 0.04 0.849Campaspe River April 2009 4 1 0.06 0.814April 2010 4 1 0.03 0.8631 n is the number of replicates (i.e. number of plots within each willow tree treatment);2 d.f. are the degrees of freedom associated with the statistic (as there are only two willow tree treatments, there canonly be one degree of freedom)Table ii: Results of Two Way ANOVA of Seedling Heights of the Different Native Specieswith <strong>Willow</strong> Tree Treatment as a FactorSite Source of Variation n d.f. F ratio P valueHappy Valley Tree treatment (tmt) 24 1 1.92 0.176(assessed Apr 2010) Native species (spp) 8 5 2.18 0.082Tmt x spp interaction 4 5 0.84 0.531Kiewa River Tree treatment (tmt) 24 1 0.93 0.342(assessed Dec 2009) Native species (spp) 8 5 23.47
Table iv: Results of One Way ANOVA to Test Effect of <strong>Willow</strong> Tree Treatment on Numberof Seedlings Establishing in Direct Seeded Plots at Happy Valley Site37Site Date Assessed n d.f. F ratio P valueHappy Valley April 2010 4 1 0.10 0.767Table v: Results of One Way ANOVA to Test Effect of <strong>Willow</strong> Tree Treatment on Heightof Silver Wattle Seedlings Establishing in Direct Seeded Plots at Happy Valley SiteSite Date Assessed n d.f. F ratio P valueHappy Valley April 2010 4 1 0.40 0.559