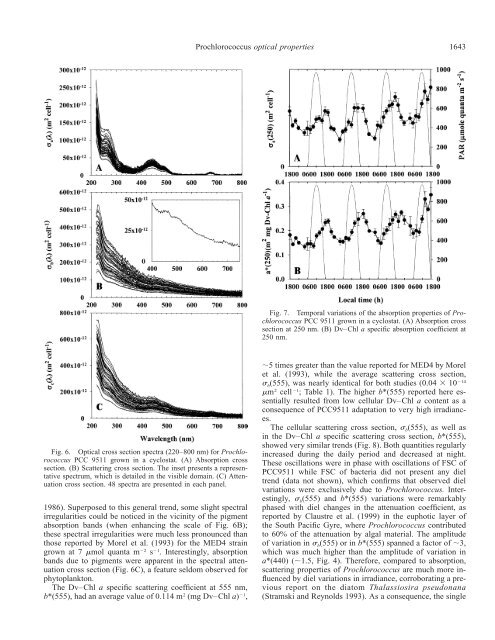
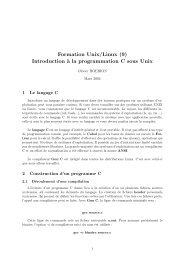
1642 Claustre et al.study, even at this wavelength. Indeed, previous work hasshown that, as a result of its t<strong>in</strong>y size, the absorption capacity<strong>in</strong> the blue doma<strong>in</strong> of the MED4 clone is only reduced byless than 20% (Morel et al. 1993) or even 10% (Bricaud etal. 1999), comparatively to the absorption capacity of thesame amount of pigments, if they were <strong>in</strong> solution. Furthermore,the low cellular Dv–Chl a content reported here as aresult of photoacclimation (see above) would also result <strong>in</strong>low packag<strong>in</strong>g. It is thus expected that pigment packag<strong>in</strong>g,if any, was even lower <strong>in</strong> our study than the (already weak)package effect reported <strong>in</strong> the studies of Morel et al. (1993)and Bricaud et al. (1999). Thus, the relatively large diel oscillations<strong>in</strong> a*(440) were most probably related to changes<strong>in</strong> the contribution by accessory pigments to absorption.The diel <strong>variation</strong>s <strong>in</strong> a*(440) (Fig. 4) were <strong>in</strong> phase withthose <strong>in</strong> ZDR (Fig. 3), an observation that supports the controlof specific absorption of <strong>Prochlorococcus</strong> by accessorypigment dynamics. This <strong>in</strong>fluence of accessory pigments canbe quantified by partition<strong>in</strong>g the specific absorption a*(440)<strong>in</strong>to a photosynthetic [a (440)] and a nonphotosynthetic*PS[a*NPS(440)] contribution, <strong>in</strong> a similar way as performed byBab<strong>in</strong> et al. (1996) or Allali et al. (1997). In the presentcase, due to the very simple pigmentation of <strong>Prochlorococcus</strong>,the nonphotosynthetic pool was restricted to zeaxanth<strong>in</strong>,while both Dv–Chl a and carotene were the only contributorsto the photosynthetic pool [the excellent correlationbetween Dv–Chl a and carotene pools (r 2 0.99; n 44) is a strong <strong>in</strong>dication that carotene is a photosyntheticpigment]. On the basis of the concentration and of the specificabsorption coefficient of these pigments at 440 nm[0.027 m 2 (mg Dv–Chl a) 1 ; 0.039 m 2 (mg zeaxanth<strong>in</strong>) 1 ;0.043 m 2 (mg carotene) 1 ], the partial contribution (<strong>in</strong> percentage)of a PS *(440) and a NPS * (440) can be estimated (Fig.5a). On average, the percentage of a *PS(440) is only 40.8 3.4%, which means that more than half of absorbed photonswere not directed toward photosynthesis. The percentage ofa *PS(440) was maximal at sunrise (45–48%), when ZDR wasm<strong>in</strong>imal, and m<strong>in</strong>imum at sunset (35–38%), when ZDR wasmaximal.These partial absorption contributions, when multiplied bya*(440), allow the determ<strong>in</strong>ation of a * PS(440) and a * NPS(440),respectively (Fig. 5B). Contrary to a NPS * (440), a PS *(440) didnot present any daily <strong>variation</strong>s. Daily <strong>variation</strong>s <strong>in</strong> <strong>Prochlorococcus</strong>a*(440) were thus exclusively governed by <strong>variation</strong>s<strong>in</strong> a * NPS(440). In other words, because a NPS * (440) washere equivalent to Dv–Chl a specific absorption by zeaxanth<strong>in</strong>,<strong>variation</strong>s <strong>in</strong> a*(440) were only driven by the relative<strong>variation</strong>s <strong>in</strong> cell contents of zeaxanth<strong>in</strong> and Dv–Chl a.The potential of <strong>Prochlorococcus</strong> for absorb<strong>in</strong>g, per unitDv–Chl a, energy usable for photosynthesis rema<strong>in</strong>ed constantthroughout the day [a*(676) and a (440) kept un-*PSchanged]. <strong>Prochlorococcus</strong> grown under high irradiance (as<strong>in</strong> the upper layer of the surface ocean) was therefore likelyunable to adjust its absorption capacity to light change atthe daily scale (1) because this capacity was already nearlymaximal (close to the theoretical maximum, see above) asthe package effect was m<strong>in</strong>imal and (2) because <strong>Prochlorococcus</strong>lacked a significant amount of accessory photosyntheticpigments (Dv–Chlb and carotene rema<strong>in</strong>ed m<strong>in</strong>or<strong>in</strong> any case).Fig. 5. Temporal <strong>variation</strong>s of the absorption <strong>properties</strong> of <strong>Prochlorococcus</strong>PCC 9511 grown <strong>in</strong> a cyclostat. (A) Relative proportionof photosynthetic and nonphotosynthetic absorption. (B) Dv–Chl a specific absorption coefficient at 440 nm for photosyntheticand nonphotosynthetic pigments.Besides pigment absorption bands <strong>in</strong> the blue (zeaxanth<strong>in</strong>and Dv–Chl a) and <strong>in</strong> the red (Dv–Chl a only) part of thespectrum (Fig. 6A), <strong>Prochlorococcus</strong> exhibited a pronouncedabsorption band <strong>in</strong> the UV doma<strong>in</strong>, between 250and 270 nm. This band exhibited very clear diel oscillations,either on a per cell or on a per Dv–Chl a basis (Fig. 7). Theexperimental setup of the culture (neon tubes, polycarbonatevessel with<strong>in</strong> a glass aquarium) prevented <strong>Prochlorococcus</strong>biochemical <strong>properties</strong> from be<strong>in</strong>g <strong>in</strong>fluenced by UV radiation,so that the enhanced absorption <strong>in</strong> the 250–270-nmrange was not a response to UV stress. We believe that thisUV absorption band might characterize the plastoqu<strong>in</strong>onepool (Falkowski and Raven 1997, their figure 9.12) or thepresence of antioxidant compounds (Dunlap and Shick1998), whose function is to counteract the presence of variousdamag<strong>in</strong>g O 2 species as a result of excess excitationenergy (O 2 reduction <strong>in</strong>to O2or H 2 O 2 through PS I, s<strong>in</strong>gletoxygen). It is worth not<strong>in</strong>g that this UV absorption featureis typical of cyanobacteria that lack of xanthophyll cycle,the function of which <strong>in</strong> eukaryotic phytoplankton is, at leastpartly, to avoid the formation of this O 2 destructive species(photooxidation) (Demmig-Adams and Adams 1993).Scatter<strong>in</strong>g—General <strong>variation</strong>s: The spectral scatter<strong>in</strong>gcross section (Fig. 6B) regularly <strong>in</strong>creased with decreas<strong>in</strong>gwavelength, with an average 2.1 dependency (for all thespectra), consistent with theoretical expectations for nonabsorb<strong>in</strong>gparticles of very small size (Morel and Bricaud
<strong>Prochlorococcus</strong> <strong>optical</strong> <strong>properties</strong>1643Fig. 7. Temporal <strong>variation</strong>s of the absorption <strong>properties</strong> of <strong>Prochlorococcus</strong>PCC 9511 grown <strong>in</strong> a cyclostat. (A) Absorption crosssection at 250 nm. (B) Dv–Chl a specific absorption coefficient at250 nm.Fig. 6. Optical cross section spectra (220–800 nm) for <strong>Prochlorococcus</strong>PCC 9511 grown <strong>in</strong> a cyclostat. (A) Absorption crosssection. (B) Scatter<strong>in</strong>g cross section. The <strong>in</strong>set presents a representativespectrum, which is detailed <strong>in</strong> the visible doma<strong>in</strong>. (C) Attenuationcross section. 48 spectra are presented <strong>in</strong> each panel.1986). Superposed to this general trend, some slight spectralirregularities could be noticed <strong>in</strong> the vic<strong>in</strong>ity of the pigmentabsorption bands (when enhanc<strong>in</strong>g the scale of Fig. 6B);these spectral irregularities were much less pronounced thanthose reported by Morel et al. (1993) for the MED4 stra<strong>in</strong>grown at 7 mol quanta m 2 s 1 . Interest<strong>in</strong>gly, absorptionbands due to pigments were apparent <strong>in</strong> the spectral attenuationcross section (Fig. 6C), a feature seldom observed forphytoplankton.The Dv–Chl a specific scatter<strong>in</strong>g coefficient at 555 nm,b*(555), had an average value of 0.114 m 2 (mg Dv–Chl a) 1 ,5 times greater than the value reported for MED4 by Morelet al. (1993), while the average scatter<strong>in</strong>g cross section, b (555), was nearly identical for both studies (0.04 10 14m 2 cell 1 ; Table 1). The higher b*(555) reported here essentiallyresulted from low cellular Dv–Chl a content as aconsequence of PCC9511 adaptation to very high irradiances.The cellular scatter<strong>in</strong>g cross section, b (555), as well as<strong>in</strong> the Dv–Chl a specific scatter<strong>in</strong>g cross section, b*(555),showed very similar trends (Fig. 8). Both quantities regularly<strong>in</strong>creased dur<strong>in</strong>g the daily period and decreased at night.These oscillations were <strong>in</strong> phase with oscillations of FSC ofPCC9511 while FSC of bacteria did not present any dieltrend (data not shown), which confirms that observed diel<strong>variation</strong>s were exclusively due to <strong>Prochlorococcus</strong>. Interest<strong>in</strong>gly, b (555) and b*(555) <strong>variation</strong>s were remarkablyphased with diel changes <strong>in</strong> the attenuation coefficient, asreported by Claustre et al. (1999) <strong>in</strong> the euphotic layer ofthe South Pacific Gyre, where <strong>Prochlorococcus</strong> contributedto 60% of the attenuation by algal material. The amplitudeof <strong>variation</strong> <strong>in</strong> b (555) or <strong>in</strong> b*(555) spanned a factor of 3,which was much higher than the amplitude of <strong>variation</strong> <strong>in</strong>a*(440) (1.5, Fig. 4). Therefore, compared to absorption,scatter<strong>in</strong>g <strong>properties</strong> of <strong>Prochlorococcus</strong> are much more <strong>in</strong>fluencedby diel <strong>variation</strong>s <strong>in</strong> irradiance, corroborat<strong>in</strong>g a previousreport on the diatom Thalassiosira pseudonana(Stramski and Reynolds 1993). As a consequence, the s<strong>in</strong>gle