of Muncie & Delaware County, Inc. - The Community Foundation of ...
of Muncie & Delaware County, Inc. - The Community Foundation of ...
of Muncie & Delaware County, Inc. - The Community Foundation of ...

Create successful ePaper yourself
Turn your PDF publications into a flip-book with our unique Google optimized e-Paper software.
THE COMMUNITY FOUNDATION <strong>of</strong> <strong>Muncie</strong> & <strong>Delaware</strong> <strong>County</strong>, <strong>Inc</strong>.<br />
2006 Annual Report<br />
22<br />
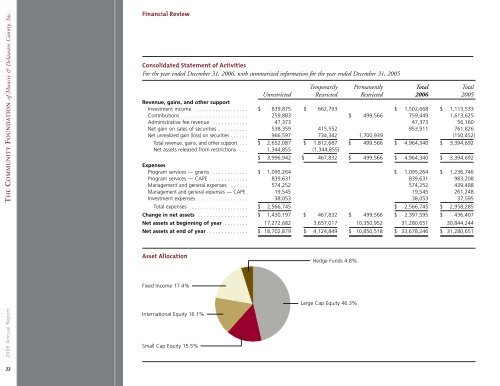
Financial Review<br />
Consolidated Statement <strong>of</strong> Activities<br />
For the year ended December 31, 2006, with summarized information for the year ended December 31, 2005<br />
Temporarily Permanently Total Total<br />
Unrestricted Restricted Restricted 2006 2005<br />
Revenue, gains, and other support<br />
Investment income . . . . . . . . . . . . . . . . . . $ 839,875 $ 662,793 $ 1,502,668 $ 1,113,533<br />
Contributions . . . . . . . . . . . . . . . . . . . . . . 259,883 $ 499,566 759,449 1,613,625<br />
Administrative fee revenue . . . . . . . . . . . . 47,373 47,373 56,160<br />
Net gain on sales <strong>of</strong> securities . . . . . . . . . . 538,359 415,552 953,911 761,826<br />
Net unrealized gain (loss) on securities . . . . . . 966,597 734,342 1,700,939 (150,452)<br />
Total revenue, gains, and other support . . . $ 2,652,087 $ 1,812,687 $ 499,566 $ 4,964,340 $ 3,394,692<br />
Net assets released from restrictions . . . 1,344,855 (1,344,855)<br />
Expenses<br />
$ 3,996,942 $ 467,832 $ 499,566 $ 4,964,340 $ 3,394,692<br />
Program services — grants . . . . . . . . . . . . $ 1,095,264 $ 1,095,264 $ 1,236,746<br />
Program services — CAPE . . . . . . . . . . . . . 839,631 839,631 983,208<br />
Management and general expenses . . . . . . 574,252 574,252 439,488<br />
Management and general expenses — CAPE 19,545 19,545 261,248<br />
Investment expenses . . . . . . . . . . . . . . . . . 38,053 38,053 37,595<br />
Total expenses . . . . . . . . . . . . . . . . . . . . $ 2,566,745 $ 2,566,745 $ 2,958,285<br />
Change in net assets . . . . . . . . . . . . . . . . . $ 1,430,197 $ 467,832 $ 499,566 $ 2,397,595 $ 436,407<br />
Net assets at beginning <strong>of</strong> year . . . . . . . . 17,272,682 3,657,017 10,350,952 31,280,651 30,844,244<br />
Net assets at end <strong>of</strong> year . . . . . . . . . . . . . . $ 18,702,879 $ 4,124,849 $ 10,850,518 $ 33,678,246 $ 31,280,651<br />
Asset Allocation<br />
Fixed <strong>Inc</strong>ome 17.4%<br />
International Equity 16.1%<br />
Small Cap Equity 15.5%<br />
Hedge Funds 4.8%<br />
Large Cap Equity 46.3%