Application of ICP-MS for the determination of trace metals in textiles
Application of ICP-MS for the determination of trace metals in textiles
Application of ICP-MS for the determination of trace metals in textiles

You also want an ePaper? Increase the reach of your titles
YUMPU automatically turns print PDFs into web optimized ePapers that Google loves.
CHEMIJA. 2007. Vol. 18. No. 3. P. 16–19© Lietuvos mokslų akademija, 2007© Lietuvos mokslų akademijos leidykla, 2007<strong>Application</strong> <strong>of</strong> <strong>ICP</strong>-<strong>MS</strong> <strong>for</strong> <strong>the</strong> <strong>determ<strong>in</strong>ation</strong> <strong>of</strong> <strong>trace</strong><strong>metals</strong> <strong>in</strong> <strong>textiles</strong>Birutė Pranaitytė*,Audrius Padarauskas andEvaldas NaujalisLaboratory <strong>for</strong> Metrology <strong>in</strong>Chemistry, Semiconductor PhysicsInstitute, A. Goštauto 11,LT-01108 Vilnius, LithuaniaA sector field high-resolution <strong>in</strong>ductively coupled plasma mass spectrometry (<strong>ICP</strong>-<strong>MS</strong>) was developed<strong>for</strong> <strong>the</strong> <strong>determ<strong>in</strong>ation</strong> <strong>of</strong> total amount <strong>of</strong> <strong>trace</strong> <strong>metals</strong> (Cd, Cr, Cu, Ni and Pb) <strong>in</strong> <strong>textiles</strong>after microwave-assisted acidic digestion <strong>of</strong> samples at 300 °C <strong>for</strong> 28 m<strong>in</strong>. Spectral <strong>in</strong>terferencesaris<strong>in</strong>g from <strong>the</strong> plasma gases or <strong>the</strong> major components <strong>of</strong> <strong>the</strong> samples were identified andremoved. Detection limits <strong>of</strong> <strong>the</strong> studied analytes were between 0.5 × 10 –11 g/g <strong>for</strong> 208 Pb and 8.5× 10 –11 g/g <strong>for</strong> 110 Cd. The method was applied to determ<strong>in</strong>e Cd, Cr, Cu, Ni and Pb <strong>in</strong> four <strong>textiles</strong>amples us<strong>in</strong>g standard addition calibration technique. The accuracy <strong>of</strong> <strong>the</strong> proposed techniquewas checked aga<strong>in</strong>st certified comparative reference material. Good agreement between <strong>the</strong> certifiedvalues and <strong>the</strong> concentrations measured was obta<strong>in</strong>ed.Key words: <strong>in</strong>ductively coupled plasma mass spectrometry, heavy <strong>metals</strong>, textile productsINTRODUCTIONThe major chemical pollutants on <strong>textiles</strong> are dyes conta<strong>in</strong><strong>in</strong>gcarc<strong>in</strong>ogenic am<strong>in</strong>es and toxic heavy <strong>metals</strong> [1, 2]. Heavy <strong>metals</strong>can exist <strong>in</strong> natural structures <strong>of</strong> <strong>textiles</strong> or <strong>the</strong>y can penetrate<strong>in</strong>to <strong>the</strong> <strong>textiles</strong> dur<strong>in</strong>g <strong>the</strong> production, dy<strong>in</strong>g process orvia <strong>the</strong> protection agents used <strong>for</strong> <strong>the</strong> storage <strong>of</strong> <strong>the</strong>se <strong>textiles</strong>.Fur<strong>the</strong>rmore, cotton, flax and hemp sometimes adsorb verylarge amounts <strong>of</strong> <strong>metals</strong> from <strong>the</strong> environment [3].The basic requirements decid<strong>in</strong>g whe<strong>the</strong>r textile productsmay be successfully commercialised are health and safety <strong>for</strong><strong>the</strong> user, and harmlessness <strong>for</strong> <strong>the</strong> environment. People are <strong>of</strong>tenexposed to different allergenic and toxic chemicals com<strong>in</strong>g from<strong>textiles</strong> due to daily contact with clo<strong>the</strong>s, bed l<strong>in</strong>en and similarproducts. Toxic effects <strong>of</strong> heavy <strong>metals</strong> on human health are verywell known: damages <strong>of</strong> organs, disorders <strong>in</strong> <strong>the</strong> respiratorytract and lung diseases, dysfunction <strong>of</strong> heart, blood and bloodproduc<strong>in</strong>g organs, sk<strong>in</strong> diseases and some o<strong>the</strong>rs. Due to <strong>the</strong> toxicity<strong>of</strong> some heavy <strong>metals</strong>, <strong>the</strong> guidel<strong>in</strong>es <strong>for</strong> tolerable amounts<strong>of</strong> <strong>the</strong>se <strong>metals</strong> <strong>in</strong> textile products have been provided and arebe<strong>in</strong>g adopted by countries all over <strong>the</strong> world [4].Determ<strong>in</strong>ation <strong>of</strong> <strong>the</strong> metal content <strong>of</strong> different textile materialsis very important not only <strong>for</strong> <strong>the</strong> safety <strong>of</strong> consumers, butalso <strong>for</strong> <strong>the</strong> textile <strong>in</strong>dustry. It is known that some <strong>metals</strong> present<strong>in</strong> cotton may contribute to problems <strong>in</strong> yarn manufactur<strong>in</strong>g,bleach<strong>in</strong>g and dye<strong>in</strong>g, and process<strong>in</strong>g quality [5]. Problems reportedfrom dye<strong>in</strong>g processes are related to metal contributionto <strong>the</strong> light-<strong>in</strong>duced yellow<strong>in</strong>g <strong>of</strong> whitewashed denim. Transition<strong>metals</strong> catalyze organic reactions and function as mordants thatstrongly b<strong>in</strong>d many organic compounds to cotton. The use <strong>of</strong>chromium-based dyes is essential <strong>for</strong> fast black-dye<strong>in</strong>g <strong>of</strong> wool∗ Correspond<strong>in</strong>g author. E-mail: pranaityte@pfi.ltand nylon [6]. For this reason <strong>the</strong> <strong>textiles</strong> treated <strong>in</strong> those processesshould be monitored <strong>for</strong> <strong>the</strong> presence <strong>of</strong> different <strong>metals</strong>,and <strong>the</strong>ir presence has to be reduced by apply<strong>in</strong>g different productionmethods [7].Hence, much attention should be devoted to <strong>the</strong> development<strong>of</strong> a fast, reliable and sensitive method <strong>for</strong> <strong>the</strong> <strong>determ<strong>in</strong>ation</strong> <strong>of</strong>toxic <strong>metals</strong> <strong>in</strong> textile materials. Several analytical techniques,such as anodic stripp<strong>in</strong>g voltametry [8], spectrophotometry [9],atomic absorption spectrometry [10] and X-ray fluorescencespectrometry [11] have been proposed <strong>for</strong> <strong>the</strong> <strong>determ<strong>in</strong>ation</strong><strong>of</strong> total or extractable amounts <strong>of</strong> heavy <strong>metals</strong> <strong>in</strong> <strong>textiles</strong>. Eachmethod has its own merits, but generally <strong>the</strong>y are laborious,time-consum<strong>in</strong>g, not selective enough and <strong>of</strong>ten lack sensitivity.Inductively coupled plasma mass spectrometry (<strong>ICP</strong>-<strong>MS</strong>) isa powerful technique <strong>for</strong> <strong>the</strong> measurement <strong>of</strong> ultra<strong>trace</strong> <strong>metals</strong><strong>in</strong> a wide range <strong>of</strong> sample types [12]. Virtually, all <strong>the</strong> elementscan be measured, high sensitivity and low background signalscomb<strong>in</strong>e to give very low detection limits (ng/L <strong>in</strong> most cases),and <strong>the</strong> measurement <strong>of</strong> a full set <strong>of</strong> elements takes only aboutfew m<strong>in</strong>utes per sample. Recently, laser ablation <strong>ICP</strong>-<strong>MS</strong> techniquehas been proposed <strong>for</strong> <strong>the</strong> exam<strong>in</strong>ation <strong>of</strong> <strong>the</strong> metal content<strong>in</strong> historical <strong>textiles</strong> [13], but this non-destructive methodpermits only a semi-quantitative and comparative (<strong>the</strong> comparison<strong>of</strong> <strong>the</strong> <strong>in</strong>tensity <strong>of</strong> peaks) analysis.This paper describes <strong>the</strong> application <strong>of</strong> sector field highresolution<strong>ICP</strong>-<strong>MS</strong> technique <strong>for</strong> <strong>the</strong> <strong>determ<strong>in</strong>ation</strong> <strong>of</strong> totalamounts <strong>of</strong> cadmium, chromium, copper, lead and nickel <strong>in</strong> textileproducts.EXPERIMENTALA double-focus<strong>in</strong>g sector field <strong>ICP</strong> mass spectrometer Element2<strong>of</strong> high resolution (Thermo F<strong>in</strong>nigan AB, Germany) was used
<strong>Application</strong> <strong>of</strong> <strong>ICP</strong>-<strong>MS</strong> <strong>for</strong> <strong>the</strong> <strong>determ<strong>in</strong>ation</strong> <strong>of</strong> <strong>trace</strong> <strong>metals</strong> <strong>in</strong> <strong>textiles</strong>17<strong>for</strong> <strong>the</strong> measurements. Typical rout<strong>in</strong>e operat<strong>in</strong>g conditions aregiven <strong>in</strong> Table 1. The <strong>in</strong>strument has <strong>the</strong> capability to use threedifferent resolution sett<strong>in</strong>gs, m/∆m (10% valley def<strong>in</strong>ition): 300(low-resolution mode); 4000 (medium-resolution mode) and10000 (high-resolution mode).Table 1. Element2 <strong>in</strong>strument sett<strong>in</strong>gs <strong>for</strong> <strong>the</strong> <strong>ICP</strong>-<strong>MS</strong> measurementsParameterCool gas (Ar) flowAuxiliary gas (Ar) flowNebuliser gas (Ar) flowRF powerTorch typeNebuliserSpray chamberSample coneSkimmer coneValue14 L/m<strong>in</strong>0.7 L/m<strong>in</strong>1 L/m<strong>in</strong>1100 WFasselMe<strong>in</strong>hardScott type (double pass)Nickel, 1.1 mm orifice diameterNickel, 0.8 mm orifice diameterA closed-vessel microwave digestion system (Anton PaarGmbH, Austria) equipped with a temperature control was used<strong>for</strong> <strong>the</strong> sample digestion.All <strong>the</strong> solutions were prepared with polyethylene laboratoryware us<strong>in</strong>g Milli-Q deionized water. High purity HNO 3(65%v/v, SuprapurR, Merck) was used as received. Standard solutionswere prepared from <strong>ICP</strong>-<strong>MS</strong> multi-element standard solution VICertiPUR (Merck). A certified comparative reference material<strong>for</strong> cotton <strong>trace</strong> element analysis IAEA-V-9 was used to validate<strong>the</strong> sample preparation and analysis procedure.RESULTS AND DISCUSSIONIsotopic <strong>in</strong>terferencesAs a rule, <strong>in</strong> <strong>the</strong> case <strong>of</strong> multi-isotopic elements, <strong>the</strong> strategy <strong>for</strong><strong>the</strong> selection <strong>of</strong> <strong>the</strong> isotope was to choose <strong>the</strong> most abundant andat <strong>the</strong> same time <strong>the</strong> least <strong>in</strong>terfered one. Whenever possible, it isdesirable to per<strong>for</strong>m <strong>the</strong> analysis <strong>in</strong> a low-resolution mode because<strong>of</strong> <strong>the</strong> higher ion transmission atta<strong>in</strong>able <strong>in</strong> this way. On<strong>the</strong> o<strong>the</strong>r hand, this mode is affected by mass <strong>in</strong>terferences toa large extent. Spectral <strong>in</strong>terferences are caused by atomic ionsand/or polyatomic ions with <strong>the</strong> same nom<strong>in</strong>al mass <strong>of</strong> <strong>the</strong> analyte.The latter type <strong>of</strong> <strong>in</strong>terferences is more serious and comefrom ions <strong>of</strong> <strong>the</strong> plasma gas and/or <strong>the</strong> major elements <strong>in</strong> <strong>the</strong>sample matrix. In order to obta<strong>in</strong> higher accuracy, two or threemost abundant isotopes <strong>of</strong> each metal were selected <strong>for</strong> <strong>the</strong> <strong>determ<strong>in</strong>ation</strong>.Only Ni was determ<strong>in</strong>ed from one 60 Ni isotope because<strong>the</strong> most abundant 58 Ni isotope can not be resolved from58Fe even <strong>in</strong> <strong>the</strong> high-resolution mode. A list <strong>of</strong> known and possible<strong>in</strong>terferences <strong>for</strong> <strong>the</strong> selected isotopes <strong>of</strong> <strong>the</strong> <strong>metals</strong> studiedare given <strong>in</strong> Table 2, along with <strong>the</strong> resolution selected to spectrallyresolve most <strong>of</strong> <strong>the</strong>m from <strong>the</strong> analyte isotopes.In this case, only Pb isotopes were analysed <strong>in</strong> <strong>the</strong> low-resolutionmode (m/∆m = 300). Although not measured, <strong>the</strong> concentration<strong>of</strong> Er, Os, Ir, Yb and Pt <strong>in</strong> <strong>textiles</strong> is expected to be verylow. Fur<strong>the</strong>rmore, <strong>the</strong> <strong>for</strong>mation <strong>of</strong> <strong>the</strong> polyatomic ions <strong>for</strong> <strong>the</strong>se<strong>metals</strong> is relatively low. It appears, <strong>the</strong>re<strong>for</strong>e, that <strong>the</strong>se <strong>in</strong>terferencescan be totally neglected.In <strong>the</strong> case <strong>of</strong> <strong>the</strong> <strong>determ<strong>in</strong>ation</strong> <strong>of</strong> Cr, Cu and Ni isotopes,<strong>the</strong> most important <strong>in</strong>terferences deriv<strong>in</strong>g from C, O, Cl, Ca, Cd,Mg, Ba, Sb, Na polyatomic ions can be resolved <strong>in</strong> a medium-resolutionmode (m/∆m = 4000). All o<strong>the</strong>r potentially <strong>in</strong>terfer<strong>in</strong>gelements can be neglected, ei<strong>the</strong>r because <strong>of</strong> scarce abundance<strong>of</strong> <strong>the</strong> <strong>in</strong>volved polyatomic species or <strong>the</strong>ir extremely low concentration<strong>in</strong> textile samples. As regards Cd isotopes, most <strong>of</strong> <strong>the</strong><strong>in</strong>terferences are resolved only <strong>in</strong> a less sensitive high-resolutionmode (m/∆m = 10000).Microwave-assisted sample digestionA complete dissolution <strong>of</strong> solid samples requires a digestion stepto be per<strong>for</strong>med most times, which can be accelerated us<strong>in</strong>g hightemperature and pressure, microwaves, or ultrasound assistance.Among <strong>the</strong>se auxiliary energies, microwaves are <strong>the</strong> most widelyused, both <strong>in</strong> closed-multimode and open-focused devices.Nitric acid was used s<strong>in</strong>gly as a digestion reagent <strong>in</strong> our prelim<strong>in</strong>aryexperiments. The digestion procedure was optimizedwith <strong>the</strong> certified reference material (IAEA-V-9) by vary<strong>in</strong>g <strong>the</strong>most significant experimental conditions: digestion time (5–50m<strong>in</strong>), sample size (0.1–1.0 g), oxidant concentration (1–10 mLHNO 3) and applied microwave power (100–1000 W). Textilesamples were completely dissolved after a digestion <strong>of</strong> 0.300–0.500 g <strong>of</strong> textile with 5–6 mL <strong>of</strong> 65% HNO 3at 300 °C <strong>for</strong> 28m<strong>in</strong>utes. The optimized digestion program consisted <strong>of</strong> fivepower stages: 400, 600, 700, 800 and 900 W <strong>for</strong> a duration <strong>of</strong> 6,Table 2. Potential spectral <strong>in</strong>terferences <strong>of</strong> <strong>the</strong> isotopes studiedElementIsotopeIsotopicabundance,%MassInterferentResolutionrequiredPb206Pb 24.10 205.9745166Er 40 Ar, 190 Os 16 O;207Pb 22.10 206.9759167Er 40 Ar, 191 Ir 16 O;208Pb 52.40 207.9766168Er 40 Ar, 168 Yb 40 Ar, 192 Pt 16 O, 192 Os 16 O.300Cr52Cr 83.79 51.9405103Rh ++ , 104 Pd ++ , 104 Ru ++ , 12 C 40 Ar, 36 Ar 16 O, 105 Pd ++ 400053Cr 9.50 52.9407105Pd ++ , 106 Pd ++ , 106 Cd ++ , 37 Cl 16 O, 13 C 40 Ar, 35 Cl 18 O, 36 Ar 16 O 1 H, 107 Ag ++60 119Ni Ni 26.10 59.9308 Sn ++ , 44 Ca 16 O, 120 Sn ++ , 120 Te ++ , 24 Mg 36 Ar, 20 Ne 40 Ar, 121 Sb ++ 400012563TeCu 69.17 62.9296++ , 47 Ti 16 O, 27 Al 36 Ar, 126 Te ++ , 126 Xe ++ , 23 Na 40 Ar, 45 Sc 18 O, 23 Na 23 Na 16 O 1 H,15CuN 16 O 16 O 16 O, 14 N 17 O 16 O 16 O, 127 I ++ 400065 129Cu 30.83 64.9278 Xe ++ , 49 Ti 16 O, 25 Mg 40 Ar, 130 Xe ++ , 130 Te ++ , 130 Ba ++ , 23 Na 23 Na 18 O 1 H, 131 Xe ++110Cd 12.49 109.903070Ge 40 Ar, 70 Zn 40 Ar, 74 Ge 36 Ar, 94 Mo 16 O, 94 Zr 16 O, 110 PdCd111Cd 12.80 110.904271Ga 40 Ar, 75 As 36 Ar, 95 Mo 16 O, 93 Nb 18 O112Cd 24.13 111.902872Ge 40 Ar, 96 Mo 16 O, 96 Ru 16 O, 96 Zr 16 O, 112 Sn10000
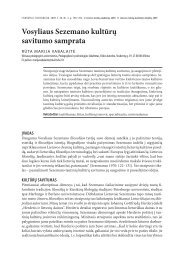
18Birutė Pranaitytė, Audrius Padarauskas and Evaldas Naujalis4, 4, 4 and 10 m<strong>in</strong>, respectively. The digested sample was cooled,diluted to 100 g with deionized water, yield<strong>in</strong>g a clear solutionwithout any detectable <strong>for</strong>mation <strong>of</strong> a precipitate. Consequently,<strong>in</strong> all <strong>the</strong> fur<strong>the</strong>r experiments <strong>the</strong> result<strong>in</strong>g sample solutionswere subjected to <strong>ICP</strong>-<strong>MS</strong> without filtration.Analytical per<strong>for</strong>manceSeveral analytical per<strong>for</strong>mance characteristics important <strong>for</strong> <strong>the</strong>quantitative analysis were measured. For calibration curves, <strong>the</strong>standard solution mixture was diluted step-wise with 2% nitricacid, and solutions <strong>for</strong> n<strong>in</strong>e po<strong>in</strong>ts <strong>in</strong>clud<strong>in</strong>g <strong>the</strong> blank test solutionwere prepared. Three replicates were prepared <strong>for</strong> each analyteconcentration.The detection limits were calculated as three times <strong>the</strong> standarddeviation <strong>of</strong> <strong>the</strong> <strong>in</strong>tensities <strong>of</strong> <strong>the</strong> blank signals at m/z <strong>for</strong> each isotope.The average values and <strong>the</strong> standard deviation <strong>of</strong> <strong>the</strong> blanksignals were obta<strong>in</strong>ed by us<strong>in</strong>g <strong>the</strong> results <strong>of</strong> <strong>the</strong> three replicate measurements.The blank consisted <strong>of</strong> deionized water with 2% HNO 3.These results have been summarized <strong>in</strong> Table 3. As can beobserved, <strong>the</strong> detection limits <strong>of</strong> <strong>the</strong> studied isotopes lie between0.5 × 10 –11 g/g <strong>for</strong> 208 Pb and 8.5 × 10 –11 g/g <strong>for</strong> 110 Cd. Slightly higherdetection limits <strong>for</strong> <strong>the</strong> three Cd isotopes can be expla<strong>in</strong>ed byhigher <strong>in</strong>strumental backgrounds obta<strong>in</strong>ed <strong>in</strong> <strong>the</strong> high-resolutionmode. The detection limits are low enough <strong>for</strong> <strong>the</strong> methodto be useful <strong>for</strong> <strong>the</strong> monitor<strong>in</strong>g <strong>of</strong> <strong>the</strong> <strong>trace</strong> <strong>metals</strong> <strong>in</strong> <strong>textiles</strong>.The l<strong>in</strong>earity <strong>of</strong> <strong>the</strong> calibration curves was considered to be satisfactory<strong>in</strong> <strong>the</strong> wide concentration range with correlation coefficientsr ≥ 0.996 <strong>for</strong> all <strong>the</strong> isotopes.Sample analysisF<strong>in</strong>ally, <strong>the</strong> concentrations <strong>of</strong> Cd, Cr, Cu, Ni and Pb were determ<strong>in</strong>ed<strong>in</strong> four textile samples obta<strong>in</strong>ed from a market-place <strong>in</strong>Vilnius. All <strong>the</strong> samples were processed <strong>in</strong> <strong>the</strong> Ch<strong>in</strong>ese textile <strong>in</strong>dustry.In order to evaluate <strong>the</strong> accuracy <strong>of</strong> <strong>the</strong> sample preparationand analysis procedures, a certified reference material <strong>for</strong> cotton<strong>trace</strong> element analysis IAEA-V-9 was used. All measurements wereper<strong>for</strong>med us<strong>in</strong>g multiple standard addition technique. As an example,Figure shows <strong>the</strong> standard addition curve obta<strong>in</strong>ed <strong>for</strong> Cuisotopes <strong>in</strong> <strong>the</strong> certified reference material sample. The obta<strong>in</strong>edresults, toge<strong>the</strong>r with <strong>the</strong> certified values are reported <strong>in</strong> Table4. It can be seen that <strong>the</strong>y are <strong>in</strong> good agreement with <strong>the</strong> certifiedconcentrations.A comparison <strong>of</strong> <strong>the</strong> means us<strong>in</strong>g a t-test hasshown that <strong>the</strong>re is no statistically significant difference between<strong>the</strong>m at 95% confidence level. Although <strong>the</strong> concentration <strong>of</strong> Cd<strong>in</strong> <strong>the</strong> reference material was found to be below <strong>the</strong> quantificationlimit, this result also corresponds to <strong>the</strong> certified value.Figure. Standard addition curves obta<strong>in</strong>ed <strong>for</strong> two Cu isotopes <strong>in</strong> certified referencematerial sampleTable 3. Method per<strong>for</strong>mance characteristicsIsotope L<strong>in</strong>earity range, g/g Correlation coefficient (r) Detection limit, g/g206Pb 0.3 × 10 -10 – 5.0 × 10 –6 0.998 1.1 × 10 –11207Pb 0.3 × 10 -10 – 5.0 × 10 –6 0.998 0.8 × 10 –11208Pb 0.1 × 10 -10 – 5.0 × 10 –6 0.998 0.5 × 10 –1152Cr 1.5 × 10 –10 – 5.0 × 10 –6 0.999 4.5 × 10 –1153Cr 2.7 × 10 –10 – 5.0 × 10 –6 0.999 8.2 × 10 –1160Ni 2.2 × 10 –10 – 5.0 × 10 –6 0.999 6.7 × 10 –1163Cu 0.5 × 10 –10 – 5.0 × 10 –6 0.997 2.2 × 10 –1165Cu 0.9 × 10 –10 – 5.0 × 10 –6 0.996 2.8 × 10 –11110Cd 2.8 × 10 –10 – 1.0 × 10 –3 0.999 8.5 × 10 –11111Cd 2.7 × 10 –10 – 1.0 × 10 –3 0.999 8.2 × 10 –11112Cd 1.5 × 10 –10 – 1.0 × 10 –3 0.999 5.0 × 10 –11Table 4. Determ<strong>in</strong>ation <strong>of</strong> some heavy <strong>metals</strong> <strong>in</strong> textile samples by <strong>ICP</strong>-<strong>MS</strong> (n = 3)SampleElement concentration ± standard deviation (mg/kg)Cd Cr Cu Ni PbNo 1 (blue) – a 0.17 ± 0.01 23.57 ± 0.86 0.09 ± 0.01 0.34 ± 0.02No 2 (red) – a 0.10 ± 0.01 0.88 ± 0.03 0.09 ± 0.01 0.06 ± 0.01No 3 (cherry) – a 0.25 ± 0.02 12.16 ± 0.45 0.17 ± 0.02 0.18 ± 0.01No 4 (black) – a 0.31 ± 0.02 1.07 ± 0.04 0.47 ± 0.04 0.36 ± 0.02Reference material IAEA-V-9aBelow <strong>the</strong> quantification limit.bValues <strong>in</strong> paren<strong>the</strong>ses are certified concentrations.– a0.13 ± 0.01(0.002) b (0.11)0.66 ± 0.04(0.59)0.10 ± 0.01(0.09)0.26 ± 0.01(0.25)
<strong>Application</strong> <strong>of</strong> <strong>ICP</strong>-<strong>MS</strong> <strong>for</strong> <strong>the</strong> <strong>determ<strong>in</strong>ation</strong> <strong>of</strong> <strong>trace</strong> <strong>metals</strong> <strong>in</strong> <strong>textiles</strong>19From <strong>the</strong> presented results it can be concluded that <strong>ICP</strong>-<strong>MS</strong>technique is well suited <strong>for</strong> rapid and sensitive monitor<strong>in</strong>g <strong>of</strong><strong>trace</strong> <strong>metals</strong> <strong>in</strong> textile samples.ACKNOWLEDGEMENTSAuthors appreciate <strong>the</strong> f<strong>in</strong>ancial support received from <strong>the</strong>Lithuanian postdoc program "Gamtos mokslų podoktorantūr<strong>in</strong>iųstažuočių programa".ReferencesReceived 03 July 2007Accepted 12 July 20071. H. W. Nurnberg (Ed.). Pollutants and <strong>the</strong>ir EcotoxicologicalSignificance. Wiley, Chichester (1985).2. D. Purves. Trace Element Contam<strong>in</strong>ation <strong>of</strong> <strong>the</strong> Environments.Elsevier Science Publishers B. V., Ne<strong>the</strong>rlands (1985).3. P. L<strong>in</strong>ger, J. Mussig, H. Fischer and J. Korbert, Ind. CropsProd., 16, 33 (2002).4. S. Kir<strong>in</strong> and R. Eunko, Tekstil, 48, 299 (1999).5. D. E. Brushwood, Am. Assoc. Text. Chem. Color., 5, 20(2002).6. J. W. Rucker, H. S. Freeman and W. N. Hsu, Text. Chem.Color., 24, 66 (1992).7. J. W. Rucker, H. S. Freeman and W. N. Hsu, Text. Chem.Color., 24, 21 (1992).8. D. Katovic, I. Piuac andI. Soljacic, Text. Research J., 55, 20(1985).9. Z. Grabaric, L. Bokic and B. Stefanovic, J. AOAC Int., 82,683 (1999).10. A. V. Raghunath, G. Sr<strong>in</strong>ivasan and S. Durani, Indian J.Chem. Technol., 7, 35 (2000).11. M. Dogan, M. Soylak, L. Elci and A. Von Bohlen,Microchim. Acta, 138, 77 (2002).12. J. S. Becker, Spectrochim Acta Part B, 57, 1805 (2002).13. M. I. Szynkowska, K. Czerski, T. Paryjczak, E. Rybicki andA. Wlochowicz, Fibres and Textiles <strong>in</strong> Eastern Europe, 14,87 (2006).Birutė Pranaitytė, Audrius Padarauskas, Evaldas NaujalisPĖDSAKINIŲ METALŲ NUSTATYMAS TEKSTILĖJEINDUKTYVIAI SUŽADINTOS PLAZMOS MASIŲSPEKTROMETRIJOS METODUS a n t r a u k aOptimizuotas <strong>in</strong>duktyviai sužad<strong>in</strong>tos plazmos masių spektrometrijosmetodas kai kuriems sunkiesiems metalams (Cd, Cr, Cu, Ni ir Pb)tekstilėje nustatyti. Tekstilės mėg<strong>in</strong>iai buvo m<strong>in</strong>eralizuojami veikiantazoto rūgštimi (28 m<strong>in</strong>) mikrobangų krosnelėje 300°C temperatūroje.Identifikuoti galimi plazmos dujų ir mėg<strong>in</strong>ių matricos komponentųspektr<strong>in</strong>iai trukdžiai. Išmatuotos pagr<strong>in</strong>d<strong>in</strong>ės metodo analiz<strong>in</strong>ės charakteristikos.Metalų aptikimo ribos yra <strong>in</strong>tervale nuo 0,5×10 -11 g/g208Pb iki 8,5×10 -11 g/g 110 Cd. Atlikta keturių tekstilės gam<strong>in</strong>ių analizė.Metodo teis<strong>in</strong>gumas įvert<strong>in</strong>tas analizuojant paliudytąją pamat<strong>in</strong>ę medžiagą.Nustatyta, kad išmatuoti ir deklaruoti metalų kiekiai statistiška<strong>in</strong>esiskiria.