National Vital Statistics Reports, Vol. 61, No. 5
National Vital Statistics Reports, Vol. 61, No. 5
National Vital Statistics Reports, Vol. 61, No. 5

You also want an ePaper? Increase the reach of your titles
YUMPU automatically turns print PDFs into web optimized ePapers that Google loves.
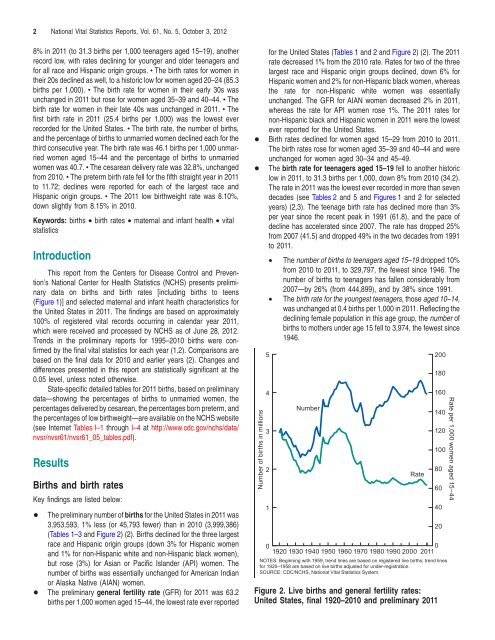
2 <strong>National</strong> <strong>Vital</strong> <strong>Statistics</strong> <strong>Reports</strong>, <strong>Vol</strong>. <strong>61</strong>, <strong>No</strong>. 5, October 3, 20128% in 2011 (to 31.3 births per 1,000 teenagers aged 15–19), anotherrecord low, with rates declining for younger and older teenagers andfor all race and Hispanic origin groups. c The birth rates for women intheir 20s declined as well, to a historic low for women aged 20–24 (85.3births per 1,000). c The birth rate for women in their early 30s wasunchanged in 2011 but rose for women aged 35–39 and 40–44. c Thebirth rate for women in their late 40s was unchanged in 2011. c Thefirst birth rate in 2011 (25.4 births per 1,000) was the lowest everrecorded for the United States. c The birth rate, the number of births,and the percentage of births to unmarried women declined each for thethird consecutive year. The birth rate was 46.1 births per 1,000 unmarriedwomen aged 15–44 and the percentage of births to unmarriedwomen was 40.7. c The cesarean delivery rate was 32.8%, unchangedfrom 2010. c The preterm birth rate fell for the fifth straight year in 2011to 11.72; declines were reported for each of the largest race andHispanic origin groups. c The 2011 low birthweight rate was 8.10%,down slightly from 8.15% in 2010.Keywords: births • birth rates • maternal and infant health • vitalstatisticsIntroductionThis report from the Centers for Disease Control and Prevention’s<strong>National</strong> Center for Health <strong>Statistics</strong> (NCHS) presents preliminarydata on births and birth rates [including births to teens(Figure 1)] and selected maternal and infant health characteristics forthe United States in 2011. The findings are based on approximately100% of registered vital records occurring in calendar year 2011,which were received and processed by NCHS as of June 28, 2012.Trends in the preliminary reports for 1995–2010 births were confirmedby the final vital statistics for each year (1,2). Comparisons arebased on the final data for 2010 and earlier years (2). Changes anddifferences presented in this report are statistically significant at the0.05 level, unless noted otherwise.State-specific detailed tables for 2011 births, based on preliminarydata—showing the percentages of births to unmarried women, thepercentages delivered by cesarean, the percentages born preterm, andthe percentages of low birthweight—are available on the NCHS website(see Internet Tables I–1 through I–4 at http://www.cdc.gov/nchs/data/nvsr/nvsr<strong>61</strong>/nvsr<strong>61</strong>_05_tables.pdf).ResultsBirths and birth ratesKey findings are listed below:+ The preliminary number of births for the United States in 2011 was3,953,593, 1% less (or 45,793 fewer) than in 2010 (3,999,386)(Tables 1–3 and Figure 2) (2). Births declined for the three largestrace and Hispanic origin groups (down 3% for Hispanic womenand 1% for non-Hispanic white and non-Hispanic black women),but rose (3%) for Asian or Pacific Islander (API) women. Thenumber of births was essentially unchanged for American Indianor Alaska Native (AIAN) women.+ The preliminary general fertility rate (GFR) for 2011 was 63.2births per 1,000 women aged 15–44, the lowest rate ever reportedfor the United States (Tables 1 and 2 and Figure 2) (2). The 2011rate decreased 1% from the 2010 rate. Rates for two of the threelargest race and Hispanic origin groups declined, down 6% forHispanic women and 2% for non-Hispanic black women, whereasthe rate for non-Hispanic white women was essentiallyunchanged. The GFR for AIAN women decreased 2% in 2011,whereas the rate for API women rose 1%. The 2011 rates fornon-Hispanic black and Hispanic women in 2011 were the lowestever reported for the United States.+ Birth rates declined for women aged 15–29 from 2010 to 2011.The birth rates rose for women aged 35–39 and 40–44 and wereunchanged for women aged 30–34 and 45–49.+ The birth rate for teenagers aged 15–19 fell to another historiclow in 2011, to 31.3 births per 1,000, down 8% from 2010 (34.2).The rate in 2011 was the lowest ever recorded in more than sevendecades (see Tables 2 and 5 and Figures 1 and 2 for selectedyears) (2,3). The teenage birth rate has declined more than 3%per year since the recent peak in 1991 (<strong>61</strong>.8), and the pace ofdecline has accelerated since 2007. The rate has dropped 25%from 2007 (41.5) and dropped 49% in the two decades from 1991to 2011.Number of births in millions• The number of births to teenagers aged 15–19 dropped 10%from 2010 to 2011, to 329,797, the fewest since 1946. Thenumber of births to teenagers has fallen considerably from2007—by 26% (from 444,899), and by 38% since 1991.• The birth rate for the youngest teenagers, those aged 10–14,was unchanged at 0.4 births per 1,000 in 2011. Reflecting thedeclining female population in this age group, the number ofbirths to mothers under age 15 fell to 3,974, the fewest since1946.54321NumberRate001920 1930 1940 1950 1960 1970 1980 1990 2000 2011200180160140120100NOTES: Beginning with 1959, trend lines are based on registered live births; trend linesfor 1920–1958 are based on live births adjusted for under-registration.SOURCE: CDC/NCHS, <strong>National</strong> <strong>Vital</strong> <strong>Statistics</strong> System.Figure 2. Live births and general fertility rates:United States, final 1920–2010 and preliminary 201180604020Rate per 1,000 women aged 15–44