Synthesis, structure and luminescence of Er3+-doped ... - UPV
Synthesis, structure and luminescence of Er3+-doped ... - UPV
Synthesis, structure and luminescence of Er3+-doped ... - UPV

Create successful ePaper yourself
Turn your PDF publications into a flip-book with our unique Google optimized e-Paper software.
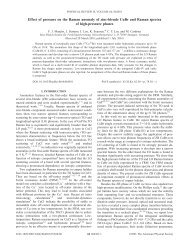
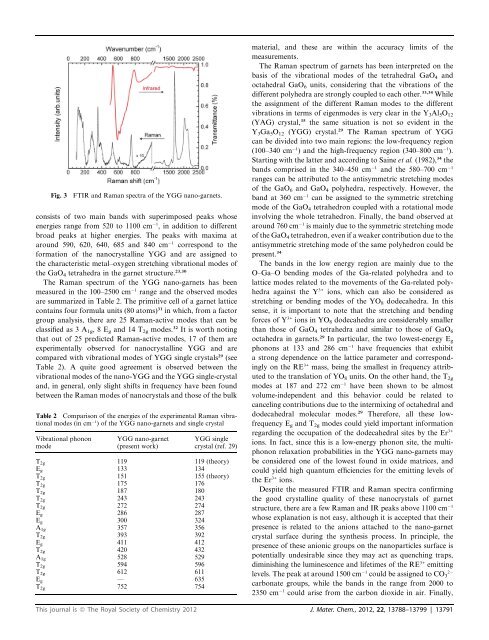
Fig. 3FTIR <strong>and</strong> Raman spectra <strong>of</strong> the YGG nano-garnets.consists <strong>of</strong> two main b<strong>and</strong>s with superimposed peaks whoseenergies range from 520 to 1100 cm 1 , in addition to differentbroad peaks at higher energies. The peaks with maxima ataround 590, 620, 640, 685 <strong>and</strong> 840 cm 1 correspond to theformation <strong>of</strong> the nanocrystalline YGG <strong>and</strong> are assigned tothe characteristic metal–oxygen stretching vibrational modes <strong>of</strong>the GaO 4 tetrahedra in the garnet <strong>structure</strong>. 23,30The Raman spectrum <strong>of</strong> the YGG nano-garnets has beenmeasured in the 100–2500 cm 1 range <strong>and</strong> the observed modesare summarized in Table 2. The primitive cell <strong>of</strong> a garnet latticecontains four formula units (80 atoms) 31 in which, from a factorgroup analysis, there are 25 Raman-active modes that can beclassified as 3 A 1g ,8E g <strong>and</strong> 14 T 2g modes. 32 It is worth notingthat out <strong>of</strong> 25 predicted Raman-active modes, 17 <strong>of</strong> them areexperimentally observed for nanocrystalline YGG <strong>and</strong> arecompared with vibrational modes <strong>of</strong> YGG single crystals 29 (seeTable 2). A quite good agreement is observed between thevibrational modes <strong>of</strong> the nano-YGG <strong>and</strong> the YGG single-crystal<strong>and</strong>, in general, only slight shifts in frequency have been foundbetween the Raman modes <strong>of</strong> nanocrystals <strong>and</strong> those <strong>of</strong> the bulkTable 2 Comparison <strong>of</strong> the energies <strong>of</strong> the experimental Raman vibrationalmodes (in cm 1 ) <strong>of</strong> the YGG nano-garnets <strong>and</strong> single crystalVibrational phononmodeYGG nano-garnet(present work)YGG singlecrystal (ref. 29)T 2g 119 119 (theory)E g 133 134T 2g 151 155 (theory)T 2g 175 176T 2g 187 180T 2g 243 243T 2g 272 274E g 286 287E g 300 324A 1g 357 356T 2g 393 392E g 411 412T 2g 420 432A 1g 528 529T 2g 594 596T 2g 612 611E g — 635T 2g 752 754material, <strong>and</strong> these are within the accuracy limits <strong>of</strong> themeasurements.The Raman spectrum <strong>of</strong> garnets has been interpreted on thebasis <strong>of</strong> the vibrational modes <strong>of</strong> the tetrahedral GaO 4 <strong>and</strong>octahedral GaO 6 units, considering that the vibrations <strong>of</strong> thedifferent polyhedra are strongly coupled to each other. 33,34 Whilethe assignment <strong>of</strong> the different Raman modes to the differentvibrations in terms <strong>of</strong> eigenmodes is very clear in the Y 3 Al 5 O 12(YAG) crystal, 35 the same situation is not so evident in theY 3 Ga 5 O 12 (YGG) crystal. 29 The Raman spectrum <strong>of</strong> YGGcan be divided into two main regions: the low-frequency region(100–340 cm 1 ) <strong>and</strong> the high-frequency region (340–800 cm 1 ).Starting with the latter <strong>and</strong> according to Saine et al. (1982), 34 theb<strong>and</strong>s comprised in the 340–450 cm 1 <strong>and</strong> the 580–700 cm 1ranges can be attributed to the antisymmetric stretching modes<strong>of</strong> the GaO 6 <strong>and</strong> GaO 4 polyhedra, respectively. However, theb<strong>and</strong> at 360 cm 1 can be assigned to the symmetric stretchingmode <strong>of</strong> the GaO 4 tetrahedron coupled with a rotational modeinvolving the whole tetrahedron. Finally, the b<strong>and</strong> observed ataround 760 cm 1 is mainly due to the symmetric stretching mode<strong>of</strong> the GaO 4 tetrahedron, even if a weaker contribution due to theantisymmetric stretching mode <strong>of</strong> the same polyhedron could bepresent. 34The b<strong>and</strong>s in the low energy region are mainly due to theO–Ga–O bending modes <strong>of</strong> the Ga-related polyhedra <strong>and</strong> tolattice modes related to the movements <strong>of</strong> the Ga-related polyhedraagainst the Y 3+ ions, which can also be considered asstretching or bending modes <strong>of</strong> the YO 8 dodecahedra. In thissense, it is important to note that the stretching <strong>and</strong> bendingforces <strong>of</strong> Y 3+ ions in YO 8 dodecahedra are considerably smallerthan those <strong>of</strong> GaO 4 tetrahedra <strong>and</strong> similar to those <strong>of</strong> GaO 6octahedra in garnets. 29 In particular, the two lowest-energy E gphonons at 133 <strong>and</strong> 286 cm 1 have frequencies that exhibita strong dependence on the lattice parameter <strong>and</strong> correspondinglyon the RE 3+ mass, being the smallest in frequency attributedto the translation <strong>of</strong> YO 8 units. On the other h<strong>and</strong>, the T 2gmodes at 187 <strong>and</strong> 272 cm 1 have been shown to be almostvolume-independent <strong>and</strong> this behavior could be related tocanceling contributions due to the intermixing <strong>of</strong> octahedral <strong>and</strong>dodecahedral molecular modes. 29 Therefore, all these lowfrequencyE g <strong>and</strong> T 2g modes could yield important informationregarding the occupation <strong>of</strong> the dodecahedral sites by the Er 3+ions. In fact, since this is a low-energy phonon site, the multiphononrelaxation probabilities in the YGG nano-garnets maybe considered one <strong>of</strong> the lowest found in oxide matrices, <strong>and</strong>could yield high quantum efficiencies for the emitting levels <strong>of</strong>the Er 3+ ions.Despite the measured FTIR <strong>and</strong> Raman spectra confirmingthe good crystalline quality <strong>of</strong> these nanocrystals <strong>of</strong> garnet<strong>structure</strong>, there are a few Raman <strong>and</strong> IR peaks above 1100 cm 1whose explanation is not easy, although it is accepted that theirpresence is related to the anions attached to the nano-garnetcrystal surface during the synthesis process. In principle, thepresence <strong>of</strong> these anionic groups on the nanoparticles surface ispotentially undesirable since they may act as quenching traps,diminishing the <strong>luminescence</strong> <strong>and</strong> lifetimes <strong>of</strong> the RE 3+ emittinglevels. The peak at around 1500 cm 1 2could be assigned to CO 3carbonate groups, while the b<strong>and</strong>s in the range from 2000 to2350 cm 1 could arise from the carbon dioxide in air. Finally,This journal is ª The Royal Society <strong>of</strong> Chemistry 2012 J. Mater. Chem., 2012, 22, 13788–13799 | 13791