Share data• <strong>Skanska</strong>’s market capitalization totaled SEK 26.6 billion at the end of <strong>2003</strong>.• <strong>Skanska</strong>’s share price rose by 25 percent to SEK 63.50 during the year.• Average volume per trading day rose by 9 percent to 1,264,861 shares.• The proposed dividend for <strong>2003</strong> is SEK 3.00 per share.<strong>Skanska</strong>’s Series B shares are quoted on the Alist of Stockholmsbörsen (formerly the OMStockholm Stock Exchange) under the SKAbsymbol and are traded in round lots of 200shares. Current price information is availableon <strong>Skanska</strong>’s web site, www.skanska.com, inthe Reuter system under the SKAb.ST symboland in the Bloomberg system under theSKAB SS symbol.<strong>Skanska</strong> share history<strong>2003</strong> 2002 2001 2000 1999Year-end market price, SEK 63.50 51.00 68.50 97.50 79.25Year-end market capitalization, SEK bn 26.6 21.3 28.7 41.5 1 36.1Average number of shares for the year, million 418.6 418.6 420.0 444.6 455.4Shares outstanding at year-end, million 418.6 418.6 418.6 426.1 455.4Highest share price during the year, 65.00 83.50 106.40 106.13 86.75Lowest share price during the year, SEK 38.10 41.20 57.00 68.50 53.25Yield, percent 3 4.7 2 3.9 4.4 3.5 3.81 Excluding repurchased shares, equivalent to SEK 2.9 billion.2 Based on the dividend proposed by the Board of Directors.3 Dividend as a percentage of respective year-end share price.Change in shares outstanding (million) and capital stockPar valueShares of capitalStock New share out- stockYear and event Reduction dividend issue standing SEK M1991 1:1 63.0 125.9 1,259.21994 conv. 125.9 1,259.21997 redemption1:10 –12.0 113.9 1,255.62001 cancellation of repurchased shares –9.2 104.7 1,255.62001 split 4:1 314.0 418.6 1,255.6The largest shareholders in <strong>Skanska</strong> AB,holdings on December 31, <strong>2003</strong>Series A Series B % of % ofShareholders shares shares capital stock voting powerIndustrivärden (investment company) 17,302,756 16,000,000 8.0 27.2AMF Pension (retirement insurance) 0 27,600,000 6.6 4.0Alecta (retirement insurance) 0 27,413,960 6.5 3.9SHB/SPP fonder 0 15,603,985 3.7 2.2AFA Försäkring (insurance) 0 12,934,380 3.1 1.9Robur mutual funds (Swedbank) 0 11,264,490 2.7 1.6Inter IKEA Investment AB 7,549,396 3,678,672 2.7 11.4State of New Jersey Pension 0 8,000,000 1.9 1.2AMF Pension mutual funds 0 6,430,000 1.5 0.9Svenska Handelsbanken (bank) 2,000,000 3,855,292 1.4 3.410 largest shareholders 26,852,152 132,780,779 38.1 57.7Other shareholders in Sweden 3,734,025 192,020,660 46.8 33.1Shareholders abroad 85,744 63,079,712 15.1 9.2Total 30,671,921 387,881,151 100.0 100.0Sources: VPC, SIS Ägarservice.Transfers of capital to <strong>Skanska</strong>’s shareholdersTotal 2004 <strong>2003</strong> 2002 2001 2000Regular dividend per share, SEK 3.00 1 2.00 3.00 3.38 3.00Extra dividend per share, SEK 1.00Total per share, SEK 3.00 1 2.00 3.00 3.38 4.00Regular dividend, total, SEK bn 6.6 1.3 1 0.8 1.3 1.4 1.8Buy-backs of <strong>Skanska</strong>’s own shares, SEK bn 3.4 0.8 2.6Total 10.0 1.3 0.8 1.3 2.2 4.41 Proposed by the Board of DirectorsAt the end of <strong>2003</strong>, there were a total of418,553,072 shares outstanding, with a parvalue of SEK 3 per share. Of the shares outstanding,30,671,921 were Series A shareswith 10 votes apiece and 387,881,151 SeriesB shares with one vote apiece. Of the sharesin circulation, Series B shares accounted for92.7 percent of shares and 55.8 percent ofvoting power. During <strong>2003</strong>, the number of<strong>Skanska</strong> shares traded on Stockholmsbörsenwas 314,950,284 (291,101,248), at a value ofSEK 15.9 billion (18.5). The average volumeper trading day amounted to 1,264,861, anincrease of 9 percent from the average volumeof 1,164,405 shares during 2002. Tradingvolume during <strong>2003</strong> was equivalent to 81(76) percent of the total number of Series Bshares outstanding at the end of the year.Share performanceDuring <strong>2003</strong>, the market price climbed by25 percent to SEK 63.50 per share as the finalprice paid in <strong>2003</strong>. The overall market capitalizationof <strong>Skanska</strong> thus rose during theyear to SEK 26.6 billion. The highest pricepaid for a <strong>Skanska</strong> share during the year wasSEK 65.00 in December. The lowest pricepaid was SEK 38.10 on April 1. The StockholmAll Share Index (SAX) rose during<strong>2003</strong> by 29.8 percent. The Dow Jones TitansConstruction Index, which includes <strong>Skanska</strong>,rose by 46.1 percent.<strong>Skanska</strong>’s Series B shares are also includedin the Dow Jones Stoxx 600.Percentage of capital stockby shareholder categoryShares by category on December 31, <strong>2003</strong>Number of % of % ofCategory shares capital stock voting powerA 30,671,921 7.3 44.2B 387,881,151 92.7 55.8Totalt 418,553,072 100 10024Share data– <strong>Skanska</strong> <strong>Annual</strong> <strong>Report</strong> <strong>2003</strong>
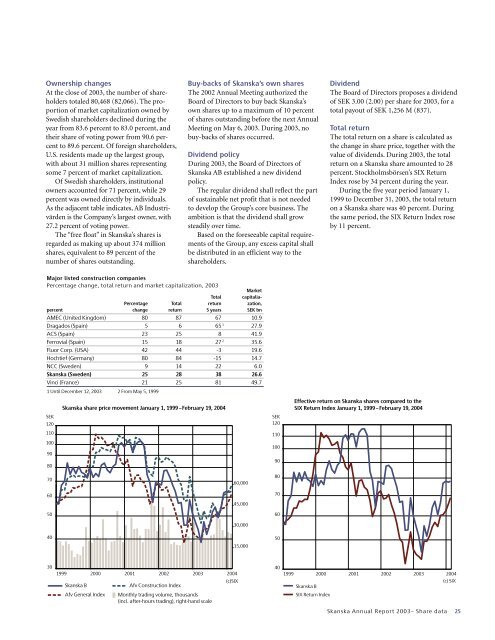
Ownership changesAt the close of <strong>2003</strong>, the number of shareholderstotaled 80,468 (82,066). The proportionof market capitalization owned bySwedish shareholders declined during theyear from 83.6 percent to 83.0 percent, andtheir share of voting power from 90.6 percentto 89.6 percent. Of foreign shareholders,U.S. residents made up the largest group,with about 31 million shares representingsome 7 percent of market capitalization.Of Swedish shareholders, institutionalowners accounted for 71 percent, while 29percent was owned directly by individuals.As the adjacent table indicates, AB Industrivärdenis the Company’s largest owner, with27.2 percent of voting power.The “free float” in <strong>Skanska</strong>’s shares isregarded as making up about 374 millionshares, equivalent to 89 percent of thenumber of shares outstanding.Buy-backs of <strong>Skanska</strong>’s own sharesThe 2002 <strong>Annual</strong> Meeting authorized theBoard of Directors to buy back <strong>Skanska</strong>’sown shares up to a maximum of 10 percentof shares outstanding before the next <strong>Annual</strong>Meeting on May 6, <strong>2003</strong>. During <strong>2003</strong>, nobuy-backs of shares occurred.Dividend policyDuring <strong>2003</strong>, the Board of Directors of<strong>Skanska</strong> AB established a new dividendpolicy.The regular dividend shall reflect the partof sustainable net profit that is not neededto develop the Group’s core business. Theambition is that the dividend shall growsteadily over time.Based on the foreseeable capital requirementsof the Group, any excess capital shallbe distributed in an efficient way to theshareholders.DividendThe Board of Directors proposes a dividendof SEK 3.00 (2.00) per share for <strong>2003</strong>, for atotal payout of SEK 1,256 M (837).Total returnThe total return on a share is calculated asthe change in share price, together with thevalue of dividends. During <strong>2003</strong>, the totalreturn on a <strong>Skanska</strong> share amounted to 28percent. Stockholmsbörsen’s SIX ReturnIndex rose by 34 percent during the year.During the five year period January 1,1999 to December 31, <strong>2003</strong>, the total returnon a <strong>Skanska</strong> share was 40 percent. Duringthe same period, the SIX Return Index roseby 11 percent.Major listed construction companiesPercentage change, total return and market capitalization, <strong>2003</strong>MarketTotal capitalia-Percentage Total return zation,percent change return 5 years SEK bnAMEC (United Kingdom) 80 87 67 10.9Dragados (Spain) 5 6 65 1 27.9ACS (Spain) 23 25 8 41.9Ferrovial (Spain) 15 18 27 2 35.6Fluor Corp. (USA) 42 44 -3 19.6Hochtief (Germany) 80 84 -15 14.7NCC (Sweden) 9 14 22 6.0<strong>Skanska</strong> (Sweden) 25 28 38 26.6Vinci (France) 21 25 81 49.71 Until December 12, <strong>2003</strong> 2 From May 5, 1999SEK1201101009080<strong>Skanska</strong> share price movement January 1, 1999 –February 19, 2004SEK12011010090Effective return on <strong>Skanska</strong> shares compared to theSIX Return Index January 1, 1999–February 19, 20047060,00080607045,000506030,0004015,00050301999 2000 2001 2002 <strong>2003</strong> 2004<strong>Skanska</strong> BAfv General IndexAfv Construction IndexMonthly trading volume, thousands(incl. after-hours trading), right-hand scale(c)SIX401999 2000 2001 2002 <strong>2003</strong> 2004(c) SIX<strong>Skanska</strong> BSIX Return Index<strong>Skanska</strong> <strong>Annual</strong> <strong>Report</strong> <strong>2003</strong>– Share data 25