Peter V. Nielsen, Li Rong and Inés Olmedo The IEA Annex 20 Two ...
Peter V. Nielsen, Li Rong and Inés Olmedo The IEA Annex 20 Two ...
Peter V. Nielsen, Li Rong and Inés Olmedo The IEA Annex 20 Two ...
- No tags were found...

You also want an ePaper? Increase the reach of your titles
YUMPU automatically turns print PDFs into web optimized ePapers that Google loves.
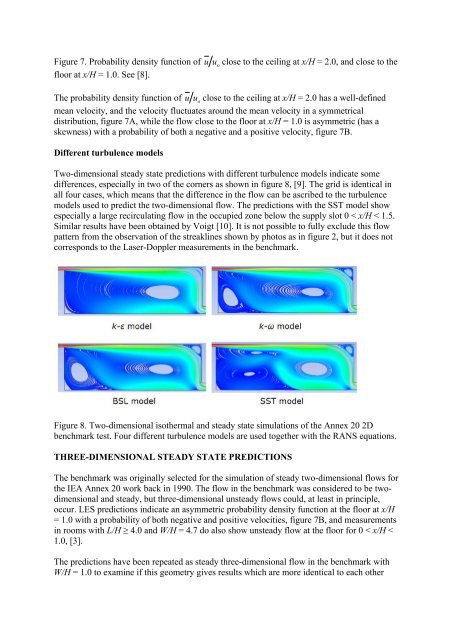
Figure 7. Probability density function of ufloor at x/H = 1.0. See [8].<strong>The</strong> probability density function of uuouoclose to the ceiling at x/H = 2.0, <strong>and</strong> close to theclose to the ceiling at x/H = 2.0 has a well-definedmean velocity, <strong>and</strong> the velocity fluctuates around the mean velocity in a symmetricaldistribution, figure 7A, while the flow close to the floor at x/H = 1.0 is asymmetric (has askewness) with a probability of both a negative <strong>and</strong> a positive velocity, figure 7B.Different turbulence models<strong>Two</strong>-dimensional steady state predictions with different turbulence models indicate somedifferences, especially in two of the corners as shown in figure 8, [9]. <strong>The</strong> grid is identical inall four cases, which means that the difference in the flow can be ascribed to the turbulencemodels used to predict the two-dimensional flow. <strong>The</strong> predictions with the SST model showespecially a large recirculating flow in the occupied zone below the supply slot 0 < x/H < 1.5.Similar results have been obtained by Voigt [10]. It is not possible to fully exclude this flowpattern from the observation of the streaklines shown by photos as in figure 2, but it does notcorresponds to the Laser-Doppler measurements in the benchmark.Figure 8. <strong>Two</strong>-dimensional isothermal <strong>and</strong> steady state simulations of the <strong>Annex</strong> <strong>20</strong> 2Dbenchmark test. Four different turbulence models are used together with the RANS equations.THREE-DIMENSIONAL STEADY STATE PREDICTIONS<strong>The</strong> benchmark was originally selected for the simulation of steady two-dimensional flows forthe <strong>IEA</strong> <strong>Annex</strong> <strong>20</strong> work back in 1990. <strong>The</strong> flow in the benchmark was considered to be twodimensional<strong>and</strong> steady, but three-dimensional unsteady flows could, at least in principle,occur. LES predictions indicate an asymmetric probability density function at the floor at x/H= 1.0 with a probability of both negative <strong>and</strong> positive velocities, figure 7B, <strong>and</strong> measurementsin rooms with L/H ≥ 4.0 <strong>and</strong> W/H = 4.7 do also show unsteady flow at the floor for 0 < x/H