

Jharkhand - DISE
Jharkhand - DISE
Jharkhand - DISE

You also want an ePaper? Increase the reach of your titles
YUMPU automatically turns print PDFs into web optimized ePapers that Google loves.
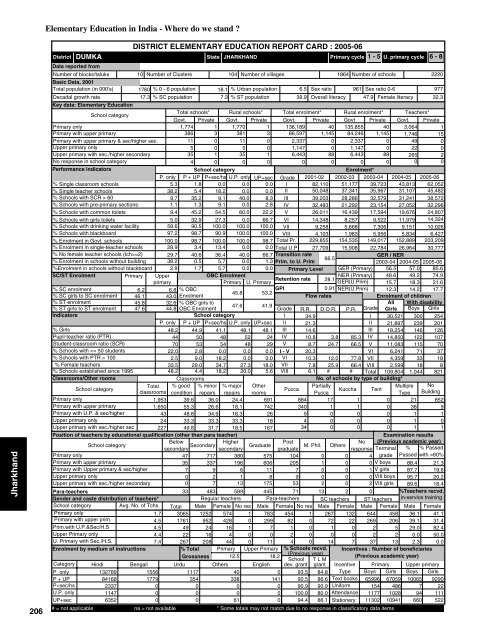
<strong>Jharkhand</strong>206Elementary Education in India - Where do we stand ?DUMKADistrictData reported fromNumber of blocks/taluksBasic Data, 2001Total population (in 000's)Decadal growth rateDISTRICT ELEMENTARY EDUCATION REPORT CARD : 2005-06StateJHARKHAND10 Number of Clusters 104 Number of villages1864 Number of schools22201760 % 0 - 6 population 18.1 % Urban population 6.5 Sex ratio 961 Sex ratio 0-697717.3 % SC population 7.3 % ST population39.9 Overall literacy 47.9 Female literacy 32.3Primary cycle 1 - 5 U. primary cycle 6 - 8Key data: Elementary EducationSchool categoryTotal schools* Rural schools* Total enrolment* Rural enrolment* Teachers*Govt. Private Govt. Private Govt. Private Govt Private Govt. PrivatePrimary only1,774 1 1,770 1 136,189 40 135,855 40 3,064 1Primary with upper primary386 3 381 3 86,597 1,145 84,246 1,145 1,746 15Primary with upper primary & sec/higher sec.11 0 11 0 2,337 0 2,337 0 49 0Upper primary only5 0 5 0 1,147 0 1,147 0 22 0Upper primary with sec./higher secondary35 1 35 1 6,443 88 6,443 88 265 2No response in school category4 0 0 0 0 0 0 0 0 0Performance indicatorsSchool categoryEnrolment*P. only P + UP P+sec/hs U.P. only UP+sec Grade 2001-02 2002-03 2003-04 2004-05 2005-06% Single classroom schools5.3 1.8 0.0 0.0 0.0 I 82,110 51,177 39,723 43,813 62,052% Single teacher schools38.2 5.4 18.2 0.0 0.0 II 50,048 37,341 35,967 31,107 45,482% Schools with SCR > 609.7 35.2 9.1 40.0 8.3 III 39,203 28,286 32,579 31,241 38,572% Schools with pre-primary sections 1.1 1.3 9.1 0.0 2.8 IV 32,483 21,292 23,154 27,052 32,296% Schools with common toilets 9.4 45.2 54.5 60.0 22.2 V 26,011 16,439 17,594 19,676 24,807% Schools with girls toilets 5.0 32.9 27.3 0.0 66.7 VI 14,348 8,257 9,522 11,979 14,324% Schools with drinking water facility 58.6 90.5 100.0 100.0 100.0 VII 9,258 5,668 7,306 9,151 10,026% Schools with blackboard97.2 98.7 90.9 100.0 100.0 VIII 4,103 1,983 5,956 5,834 6,427% Enrolment in Govt. schools 100.0 98.7 100.0 100.0 98.7 Total Pr. 229,855 154,535 149,017 152,889 203,209% Enrolment in single-teacher schools 28.9 3.4 13.4 0.0 0.0 Total U.P 27,709 15,908 22,784 26,964 30,777% No female teacher schools (tch>=2) 29.7 40.6 36.4 40.0 66.7 Transition rateGER / NER66.5% Enrolment in schools without building 38.2 0.5 5.7 0.0 1.3 Prim. to U. Prim2003-04 2004-05 2005-06%Enrolment in schools without blackboard 2.9 1.7 5.7 0.0 0.0 Primary Level GER (Primary) 56.5 57.0 85.6SC/ST EnrolmentPrimary UpperOBC EnrolmentNER (Primary) 48.6 49.2 74.9Retention rate 28.1primaryPrimary U. PrimaryGER(U.Prim) 15.7 18.3 21.6% SC enrolment6.2 6.8 % OBCGPI0.91 NER(U.Prim) 12.3 14.2 17.745.8 53.2% SC girls to SC enrolment 46.1 43.0 EnrolmentFlow ratesEnrolment of children% ST enrolment45.8 32.6 % OBC girls toAll With disability47.6 41.9% ST girls to ST enrolment 47.6 44.8 OBC EnrolmentGrade R.R. D.O.R. P.R. Grade Girls Boys GirlsIndicatorsSchool categoryI 34.9I 30,521 300 254P. only P + UP P+sec/hs U.P. only UP+sec II 21.3II 21,897 239 201% Girls48.2 44.9 41.1 48.1 48.1 III 14.6III 18,254 146 126Pupil-teacher ratio (PTR)44 50 48 52 24 IV 10.8 3.8 85.3 IV 14,850 122 107Student-classroom ratio (SCR)70 53 54 48 29 V 8.7 24.7 66.5 V 11,083 115 70% Schools with 1002.5 9.0 18.2 0.0 0.0 VI 10.3 12.0 77.8 VII 4,359 33 18% Female teachers33.5 29.0 34.7 27.3 18.0 VII 7.8 25.9 66.4 VIII 2,599 18 8% Schools established since 199548.2 4.4 18.2 20.0 5.6 VIII 6.1 # # Total 109,804 1,044 821Classrooms/Other roomsClassroomsNo. of schools by type of building*School categoryTotal % good % minor % major OtherPartiallyMultiple NoPuccaKuccha Tentclassrooms condition repairs repairs roomsPuccaType BuildingPrimary only1,953 39.6 36.0 24.4 691 884 17 1 0 21 852Primary with upper primary1,650 55.3 26.6 18.1 742 340 1 1 0 38 9Primary with U.P. & sec/higher43 48.8 34.9 16.3 269 0 0 0 1 1Upper primary only24 33.3 33.3 33.3 184 0 0 0 1 0Upper primary with sec./higher sec 227 49.8 31.7 18.5 16734 0 0 0 1 1Position of teachers by educational qualification (other than para teacher)Examination resultsSchool category BelowHigherPost(Previous academic year)M. Phil.secondarysecondarygraduateNoresponse Terminal % % Passed47 717 380 575 104 0 0 4 grade Passed with >60%V boysPrimary onlyPrimary with upper primaryPrimary with Upper primary & sec/higherUpper primary onlyUpper primary with sec./higher secondaryPara-teachersGender and caste distribution of teachers*School categoryAvg. No. of Tchs.Primary only1.7 3065 1252Primary with upper prim.4.5 1761 952 428 0 299Prim.with U.P.&Sec/H.S4.5 49 24 16 1 7Upper Primary only4.4 22 16 4 0 0U. Primary with Sec./H.S.7.4 267 208 44 0 11Enrolment by medium of instructions% Total Primary Upper PrimaryGrossness 12.5 18.2Category Hindi Bengali Urdu Others EnglishP. only13278915561117400P + UP841681779354338141P+sec/hs23370000U.P. only11470000UP+sec63520061035 337 196 606 205 1 0 07 9 6 11 7 0 0 1 V girls0 2 1 8 9 0 0 0 VIII boys0 7 13 175 53 2 0 2 VIII girls33 483 589 445 71 13 2 0Regular teachers Para-teachers SC teachers ST teachersTotal Male Female No res Male Female No res Male Female Male Female574 1 783 454 1 267 132 644 458821200072102200269222065289.6 18.4%Teachers recvd.in-service trainingMale Female36.1 41.139.1 31.429.0 82.40.0 50.04 0 14 7 37 13 2.3 0.0% Schools recvd. Incentives : Number of beneficiaries(Previous year)(Previous academic year)School T L Mdev. grant grant Incentive Primary Upper primary93.5 84.8 Type Boys Girls Boys Girls90.5 86.6 Text books 65996 67059 10065 929090.9 90.9 Uniform 154 486 7 22100.0 80.0 Attendance 1177 1028 94 11194.4 86.1 Stationery 11302 10941 660 522# = not applicable na = not available * Some totals may not match due to no response in classificatory data items88.4 21.387.7 19.695.7 20.2


