Consumer Choice
Consumer Choice
Consumer Choice

You also want an ePaper? Increase the reach of your titles
YUMPU automatically turns print PDFs into web optimized ePapers that Google loves.
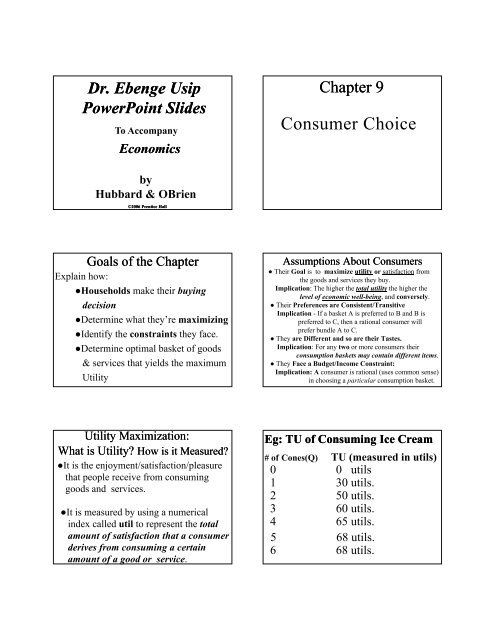
Dr. Ebenge UsipPowerPoint SlidesTo AccompanyEconomicsChapter 9<strong>Consumer</strong> <strong>Choice</strong>byHubbard & OBrien©2006 Prentice HallGoals of the ChapterExplain how:●Households make their buyingdecision●Determine what they’re maximizing●Identify the constraints they face.●Determine optimal basket of goods& services that yields the maximumUtilityAssumptions About <strong>Consumer</strong>s● Their Goal is to maximize utility or satisfaction fromthe goods and services they buy.Implication: The higher the total utility the higher thelevel of economic well-being, and conversely.● Their Preferences are Consistent/TransitiveImplication - If a basket A is preferred to B and B ispreferred to C, then a rational consumer willprefer bundle A to C.● They are Different and so are their Tastes.Implication: For any two or more consumers theirconsumption baskets may contain different items.● They Face a Budget/Income Constraint:Implication: A consumer is rational (uses common sense)in choosing a particular consumption basket.Utility Maximization:What is Utility? How is it Measured?●It is the enjoyment/satisfaction/pleasurethat people receive from consuminggoods and services.●It is measured by using a numericalindex called util to represent the totalamount of satisfaction that a consumerderives from consuming a certainamount of a good or service.Eg: TU of Consuming Ice Cream# of Cones(Q) TU (measured in utils)0 0 utils1 30 utils.2 50 utils.3 60 utils.4 65 utils.5 68 utils.6 68 utils.
What is Marginal Utility (MU) ?How Is It Calculated?●Thechange in the TU a personreceives from consuming additionalunit of a particular good or service.Note: A change can be an increase ora decrease●Computation Rule: MU = )TU÷)Q■The rule is used as follows:Eg: Ice Cream Consumption# of Cones(Q) TU MU = ΔTU÷)Q0 0 -1 30 30 (30-0)/(1-0)2 50 20 (50-30)/(2-1)3 60 10 (60-50)/(3-2)4 65 5 (65-60)/(4-3)5 68 4 (68-65)/(5-4)6 68 0 (68-68)/(6-5)Numberof ConesGraphs of TU & MULisa’s Total and Marginal Utility fromConsuming Ice Cream ConesTotalUtility0 0 utils1 3 0 utils2 5 0 utils3 60 utils4 65 utils5 68 utils6 68 utilsMarginalUtility3 0 utils2 0 utils1 0 utils5 utils3 utils0 utilsUtilsUtils70605040302010302010(a)Total Utility1 2 3 4 5 6Ice Cream Conesper Week(b)1 2 3 4 5 6Marginal UtilityNotes● TU rises with Q but at a decreasing rate after Q = 3.● MU falls continuously as Q rise; could even be zero after Q = 6Ice Cream Conesper WeekText Example: Graphs of TU & MU9 – 1, p. 274Total and Marginal Utilityfrom Eating Pizza onSuper Bowl SundayNotes● TU rises with Q but at adecreasing rate after Q = 3.● MU falls continuously as Qrise; could even be negativeafter Q = 5The Law of Diminishing MUWhat is it?<strong>Consumer</strong> experience diminishing additionalsatisfaction (or MU) as they consume more ofa good/service during a given period of time.Question: When does a rational consumerstop consuming additional unit?Answer: When MU = PReason: ■MU reflects the extra benefit ofconsuming an extra unit,■P reflects the extra cost of buyingthat extra unit.Suppose You Hungry, How ManyHotdogs Would You Buy?Up to where your MU = PIf MU > P you will buy another one.If MU < P you won’t buy that lasthotdog
TU and MU From Eating Pizza& Drinking Coke 9 – 1, p. 275NUMBER OFSLICES OFPIZZATOTAL UTILITYFROM EATINGPIZZAMARGINALUTILITYFROM THELAST SLICENUMBER OFCUPS OFCOKETOTAL UTILITYFROMDRINKINGCOKEMARGINALUTILITYFROM THELAST CUP0 0 0 01 20 20 1 20 202 36 16 2 35 153 46 10 3 45 104 52 6 4 50 55 54 2 5 53 36 51 −3 6 52 −1●Budget Constraint: The limited amount of income available toconsumers to spend on goods and services●Budget Equation: The equation form of the budget constraintgiven as follows: I = Px.X + Py.Y●Income = Expenditure (≡ Px.X + Py.Y)Is There A Rule for choosing theUtility-Maximization Basket?YES! YES!! YES!!!●Given the budget constraint, theconsumer should choose the combinationwhere MU per dollar is the same for all thegoods in the basket.i.e., MU X ÷P X = MU Y ÷P Y●Once the equality is attained, there is nofurther gain in utility by reallocatingexpenditures in either direction●This is the MU Approach of Utility Max’tion.Using the Rule to Choose BestCombination of Pizza & Coke9 – 2, p. 276(1)(2)(3)Marginal Utilityper Dollar (4)(5)MUSlices Marginal Utility⎛⎜⎞⎟ Cups Marginal UtilityPizzaof Pizza (MU Pizza ) ⎝ Pizza⎠of Coke (MU Coke )(6)Marginal Utilityper Dollar⎛ MUCoke⎞⎜⎟⎝PCkCoke⎠1 20 10 1 20 202 16 8 2 15 153 10 5 3 10 104 6 3 4 5 55 2 1 5 3 36 −3 -- 6 −1 --● Optimal choice is: 3 slices of pizza and 4 cups of coke● The reason is as follows:Using the Rule, continued● Budget constraint = $10 to spend● Pizza (X) P X = $2/slice● Coke (Y) , P Y = $1 per cup●Optimal/best choice is:3 slices pizza (X) & 4 cups of coke (Y)Reason:MU X ÷P X = MU Y ÷P Y = 5 utils●This is the utility maximizing bundleor combination, because Tom’s incomeconstraint ($10) = Expenditure ($10)= 2x3 + 1x4 (≡P X .X + P y .X)More on Why (3,4) is the UtilityMaximization CombinationCombinations of Pizza and Coke withEqual Marginal Utilities per Dollar9 – 3, p. 276Marginal Utility per Dollar(Marginal Utility/Price) Total Spending Total Utility1 Slice of Pizza and 3 Cups of Coke 10 $2 + $3 = $5 20 + 45 = 653 Slices of Pizza and 4 Cups of Coke 5 $6 + $4 = $10 46 + 50 = 964 Slices of Pizza and 5 Cups of Coke 3 $8 + $5 = $13 52 + 53 = 105● (1X,3Y) combination is affordable at $5 but Tom does not achieve themost satisfaction (TU = 65 utils) given his income of $10● (4X,5Y) combination is NOT affordable at $13 since Tom has only$10 to spend even though that combination would yield the highestlevel of satisfaction (TU = 105 utils).● (3X,4Y) combination is affordable at $10 which how much Tom hasto spend to achieve the best satisfaction (TU = 65 utils) possible.Example 2: Anita’s ProblemAnita’s Income = $9/dayPizza (X) at $1/slice Pepsi at $.50 per canQ TU Q TU4 slices 115 5 cans 635 slices 135 6 cans 756 slices 154 7 cans 867 slices 171 8 cans 96What combination of pizza and pepsi willmaximize her utility/satisfaction?
Example 3: Anita’s ProblemAnita’s Income = $9Pizza: P = $1/slice Pepsi: P = $.50/canQ TU MU MU/P Q TU MU MU/P4 115 - - 5 63 - -5* 135 20 20* 6 75 12 246 154 19 19 7 86 11 227 171 17 17 8* 96 10 20*Utility Max. Combination is (5 slices, 8cans)Graphical Analysis: The BLAnita’s Income: I = $9Price of Pizza (X): P x = $1/slicePrice of Pepsi (Y): P y = $0.50/canBudget Constraint Equation:9 = 1X + .50YY-intercept (no pizza) = 9/.50 = 18 cansX-intercept (no pepsi) = 9/1 = 9 slicesGraphical Analysis: The BL & theIndifference Curve (IC)Pepsi (Y)18 Utility Max. combinationor bundle is (5,8) at C8 CIC5 9Pizza (X)More ApplicationsDo in class Problems1. #4, p. 2952. #7, p. 296Practice Problems: #3, p. 295Solutions for Problem # 4 p. 295(1)Quantity ofTwinkies(2)Marginal Utility ofTwinkies(MU T )(3)Marginal Utilityper Dollar (4)⎛ MU ⎞ T⎜⎟⎝ PT⎠Quantity ofHo-Hos(5)Marginal Utility(MU H )(6)Marginal Utilityper Dollar⎛ MU ⎞ H⎜⎟⎝ PH⎠1 10 10 1 18 92 8 8 2 16 83 6 6 3 14 74 4 4 4 12 65 2 2 5 10 56 0 0 6 8 47 0 0 7 6 38 0 0 8 4 29 0 0 9 2 110 0 0 10 0 0● Joes’ Income = $16; P T = $1/pack; and P H = $2/pack● He maximizes utility by buying 4 pack of Twinkies and 6 packs ofHo-Hos. He spends all his income and MU = 4 for both goodsSolutions for #7, p. 296Mary will maximize her utility if the●MU/p is the same for corn chip and sodas● she spends fully her budget on the 2 goods.●Problem: Price of each item is unknown,so we have to assume that they are the samebefore we can apply the utility max. rule.● Since the MU = 10 utils for both goods, sheis maximizing her utility only if the price ofa bag of corn chips is the same as the priceof a bottle of soda, and she is also spendingthe amount of the budget allocated to cornand sodas.
How Does the <strong>Consumer</strong>Modify her/his Behavior WhenIncome Changes?● A rise: <strong>Consumer</strong> can afford to buymore units of both goods if theyare normal (note: BL shifts right)● A Fall: <strong>Consumer</strong> buys fewer units ofboth goods if they are normal(note: BL shifts Left)A rise in Income:Effects of an Increase in IncomeNumber of30Movies per 27Month1. When Max'sincome risesto $300, hisbudget lineshiftsoutward.H''15AB12C963DEF2. If his preferences are as given in thetable, he'll choose point H (6,12)HH'3.But different marginalutility numbers couldlead him to H' or H''1 2 3 4 5 6 7 8 9 10 Number of Concertsper MonthHow Does the <strong>Consumer</strong> ModifyBehavior when Prices Change?● A rise: <strong>Consumer</strong> buys fewer units of thegood whose price has risen.(note: BL rotates inward)● AFall: <strong>Consumer</strong> buys more units of thegoods whose price has fallen.(note: BL rotates outward)Implication: A change in the price producestwo effects – income effect (IE) andsubstitution effect (SE) - that furthervalidate the Law of Demand.What is the IE of a PriceChange ?The change in q d that arises from a changein the price of a good/service on consumerpurchasing power (of income), cet. par.Note: Real I = [Nominal I ÷ CPI]x100measures the PP of income■IE is Positive if the good/service isnormal (all necessities & luxuries)■IE is Negative if the good/service isinferior (e.g. ground beef)What is the SE of a Price Change?The change in q d that arises from a change in pricemaking the good (service) more or less expensiverelative to other goods (services), holding constantthe effect of the price change on consumer PP.■SE is always negative regardless of whether thegood is normal or inferiorReason: A fall in the P x (relative to P y ) willincrease q d of X, and conversely.Key Conclusions: IE & SETogether (Table 9-4, p. 280)●Normal goods: Both effects work together toraise (lower) q d when the pricefalls (rises) - - Law of Demand●Inferior goods: Both effects work against●Inferior goods: Both effects work againsteach other as follows:▪SE moves the q d in the opposite direction ofthe price change - - Law of Demand.▪IE moves it in the same direction as the price▪SE always dominates the IE, so the demandfor an inferior good also "will virtuallyalways obey the law of demand”
Where Does the Individual D-curve Come From?●It comes from the“The Utility Maximization Theory”which is the basis of the Law of Demandfrom which we derive the D-curve●Rationale is provided in figure 9-2,p. 282Deriving the D-Curve for Pizzafrom Utility Max’tion Theory9 – 2, p. 282●Panel a: At old P X = $2/slice, 3X is bought; At new P X = $1.50/slice, 4X is bought●Panel b: Joining the two coordinates result is a D-curveDeriving the D-Curve: AnAlternative ApproachNumber of 15Movies perMonth 10861. When the price of concerts is$30, point D is best for Max.DJK2. If the price falls to $10,Max's BL rotatesrightward/outward, andhe choose point J.More ApplicationsDo in class Problem #8, p. 295(on IE & SE)Price perConcert $301050 3 5 7 10 15 30DJK3. And if the price drops furtherto $5, he chooses point K.4. The D-curve for concerts:It shows the quantity Maxchooses at each price.3 7 10 Number of Concertsper MonthEND