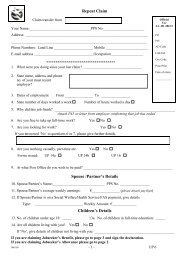
older summary people and financialSecti<strong>on</strong> A: Summary and FinancialExpenditureTotal <strong>Social</strong> <strong>Welfare</strong> expenditure in <strong>2009</strong> was €20,529 milli<strong>on</strong>, an increase of 15.3% over 2008. Expenditure in<strong>2009</strong> represented 36.8% of Gross Current Government expenditure and was equivalent to 15.6% of GNP (Table A2).The main areas of expenditure by programme group were Older People ( 22.3%), Widow’s, Widower’s and One ParentFamil<strong>ie</strong>s ( 12.7%), Illness, Disability and Caring ( 17.1 %), Jobseeker’s Supports ( 18.2 %), Child Related Payments(14.0%), Supplementary <strong>Welfare</strong> Allowance ( 4.7%) and Employment Supports (2.2%). Administrati<strong>on</strong> of the <strong>Social</strong><strong>Welfare</strong> system accounted for 2.8% of total expenditure (Graph A1).Total <strong>Social</strong> <strong>Welfare</strong> expenditure was financed by the Exchequer (52.4%) and the <strong>Social</strong> Insurance Fund (47.6%).The <strong>Social</strong> Insurance Fund was financed by Pay-Related <strong>Social</strong> Insurance c<strong>on</strong>tributi<strong>on</strong>s from employers (72.5%),employees (21.4%), the self-employed (4.3%) and investment income (1.8%). See Tables A6 and A7.Recip<strong>ie</strong>nts of Weekly <strong>Social</strong> <strong>Welfare</strong> Payments2Over 1,379,200 people were in receipt of a weekly social welfare payment at the end of <strong>2009</strong>. As these paymentsincluded increases in respect of over 175,000 Qualif<strong>ie</strong>d Adults and over 466,200 children, al<strong>on</strong>g with Family IncomeSupplement payments made in respect of over 55,700 children, there were over 2,076,200 beneficiar<strong>ie</strong>s in all.Notes: Scheme Changes and Comparability of Year-<strong>on</strong>-Year Data(a) In 2006 age related pensi<strong>on</strong>s were replaced by State Pensi<strong>on</strong>s, with significant administrative alterati<strong>on</strong>s toseveral weekly payment types which had up to that point provided for people aged over 65. These alterati<strong>on</strong>s,implemented in stages following the introducti<strong>on</strong> of the State Pensi<strong>on</strong>s, have resulted in substantial migrati<strong>on</strong>sof recip<strong>ie</strong>nts between scheme types, with accompanying changes in expenditure and recip<strong>ie</strong>nts <strong>on</strong> theseschemes. The most significant transfers of recip<strong>ie</strong>nts were those involving State Pensi<strong>on</strong> (C<strong>on</strong>tributory),formerly known as Old Age Pensi<strong>on</strong> (C<strong>on</strong>tributory), and State Pensi<strong>on</strong> (Transiti<strong>on</strong>), formerly known asRetirement Pensi<strong>on</strong>.Recip<strong>ie</strong>nts of Widow/er’s Pensi<strong>on</strong>, Deserted Wife’s Allowance, Blind Pensi<strong>on</strong>, One Parent Family Payment andPris<strong>on</strong>er’s Wife’s Allowance have since 2006 transferred to State Pensi<strong>on</strong> (N<strong>on</strong>-C<strong>on</strong>tributory) up<strong>on</strong> reaching66 years of age, resulting in some decreases in recip<strong>ie</strong>nts and expenditure <strong>on</strong> such schemes and c<strong>on</strong>comitantincreases in recip<strong>ie</strong>nts and expenditure <strong>on</strong> State Pensi<strong>on</strong> (N<strong>on</strong>-C<strong>on</strong>tributory). Recip<strong>ie</strong>nts of Invalidity Pensi<strong>on</strong>aged 66 years or over are now automatically transferred to State Pensi<strong>on</strong> (C<strong>on</strong>tributory) <strong>on</strong> reaching that agethreshold.One effect of these changes is the erosi<strong>on</strong> of data comparability between 2006 and 2007 in relati<strong>on</strong> torecip<strong>ie</strong>nts and expenditure <strong>on</strong> the schemes altered in 2006 and 2007. For instance, expenditure <strong>on</strong> StatePensi<strong>on</strong> (C<strong>on</strong>tributory) rose by 74.3% between 2006 and 2007, while that <strong>on</strong> State Pensi<strong>on</strong> (Transiti<strong>on</strong>) fell by90.8% over the same period, due to the major shifts in numbers of recip<strong>ie</strong>nts of these weekly payment types.(b) Increases in the maximum durati<strong>on</strong> and maximum payment of Maternity Benefit have resulted in asignificant increase in expenditure <strong>on</strong> the scheme. In March 2006 the maximum durati<strong>on</strong> of Maternity Benefit,Adoptive Benefit and Health and Safety Benefit claims was increased from 18 to 22 weeks, with a subsequentextensi<strong>on</strong> of Maternity Benefit in March 2007 to 26 weeks.(c) From September 2007 a pers<strong>on</strong> may receive half rate carer’s allowance while in receipt of another socialwelfare payment. This may result in double counting<str<strong>on</strong>g>Statistical</str<strong>on</strong>g> <str<strong>on</strong>g>Informati<strong>on</strong></str<strong>on</strong>g> <strong>on</strong> <strong>Social</strong> <strong>Welfare</strong> <strong>Services</strong> <strong>2009</strong>
summary and older financial peopleGraph A1: Expenditure <strong>on</strong> <strong>Social</strong> <strong>Welfare</strong> by Programme, <strong>2009</strong>Jobseeker’s Supports 18.2%Employment Supports 2.2%Supplementary <strong>Welfare</strong>Allowance 4.7%Administrati<strong>on</strong> 2.8%Older People 22.3%Widows, Widowers & OneParent Famil<strong>ie</strong>s 12.7%Child Related Payments 14.0%Illness, Disability andCaring 17.1%Miscellaneous Paymentsand Grants 5.9%Table A1: Expenditure <strong>on</strong> <strong>Social</strong> <strong>Welfare</strong> by Programme, 2008 and <strong>2009</strong>Programme 2008 <strong>2009</strong> (1) Change <strong>2009</strong> over 2008€000 €000Older People 4,300,375 4,569,654 6.3%Widows, Widowers and One Parent Famil<strong>ie</strong>s 2,504,699 2,608,360 4.1%Child Related Payments 2,793,575 2,877,039 3.0%Illness, Disability and Caring 3,301,142 3,504,509 6.2%Jobseeker’s Supports 2,087,695 3,738,330 79.1%Employment Supports 415,721 454,318 9.3%Supplementary <strong>Welfare</strong> Allowance 803,835 969,724 20.6%Miscellaneous Payments and Grants 1,021,730 1,214,540 18.9%Administrati<strong>on</strong> 579,815 592,635 2.2%Total Expenditure 17,808,587 20,529,109 15.3%(1) Provisi<strong>on</strong>al3Table A2: Expenditure <strong>on</strong> <strong>Social</strong> <strong>Welfare</strong> as a Percentage of Current GovernmentExpenditure, GNP and GDP, 2000 to <strong>2009</strong>YearTotal <strong>Social</strong> <strong>Welfare</strong>Expenditure (1) (€m)Index ofExpenditure<strong>Social</strong> <strong>Welfare</strong> Expenditure as a percentage of (3)C<strong>on</strong>sumer PriceIndex (2) Gross Current Gross Gross DomesticGovernmentExpenditureNati<strong>on</strong>alProductProduct2000 (4) 6,713 100.0 100.0 25.9 7.5 6.42001 (4) 7,842 116.8 104.9 26.2 8.0 6.72002 (4) 9,517 141.8 109.7 28.8 8.9 7.32003 (4) 10,493 156.3 113.6 28.9 8.9 7.52004 (4) 11,291 168.2 116.0 28.9 8.9 7.62005 (4) 12,168 181.3 118.9 28.2 8.9 7.52006 (4) 13,586 202.4 123.6 28.6 8.9 7.72007 (4) 15,518 231.2 129.6 29.4 9.6 8.22008 (4) 17,809 265.3 134.9 33.4 11.5 9.8<strong>2009</strong> (4) 20,529 305.8 128.8 36.8 15.6 12.6(1) Includes the full cost of Supplementary <strong>Welfare</strong> Allowance which is administered by the Health Service Executive.(2) Re-based from C<strong>on</strong>sumer Price Index data published by the Central Statistics Office.(3) Source: Central Statistics Office(4) Total <strong>Social</strong> <strong>Welfare</strong> expenditure for these years includes expenditure <strong>on</strong> the Redundancy and Insolvency Schemes which are administered by theDepartment of Enterprise, Trade and Innovati<strong>on</strong>.<str<strong>on</strong>g>Statistical</str<strong>on</strong>g> <str<strong>on</strong>g>Informati<strong>on</strong></str<strong>on</strong>g> <strong>on</strong> <strong>Social</strong> <strong>Welfare</strong> <strong>Services</strong> <strong>2009</strong>
- Page 6 and 7: older preface people from the minis
- Page 8 and 9: older summary introduction people a
- Page 10 and 11: older réamhrá peopleRéamhráCúr
- Page 12 and 13: older summary list of people tables
- Page 14 and 15: older summary list of people tables
- Page 16 and 17: older summary list of people tables
- Page 18 and 19: xviStatistical <st
- Page 22 and 23: older summary people and financialT
- Page 24 and 25: older summary people and financialT
- Page 26 and 27: older summary people and financialG
- Page 28 and 29: older summary people and financialT
- Page 30 and 31: older summary people and financialG
- Page 32 and 33: older summary people and financialT
- Page 34 and 35: older summary people and financialT
- Page 36 and 37: older summary people and financialT
- Page 38 and 39: older summary people and financialT
- Page 40 and 41: older summary people and financialT
- Page 42 and 43: older summary people and financialT
- Page 44 and 45: older peopleSection B: Older People
- Page 46 and 47: older peopleTable B2: Expenditure o
- Page 48 and 49: older peopleTable B5: Number of Rec
- Page 50 and 51: 32Statistical <str
- Page 52 and 53: widows, widowers andone parent fami
- Page 54 and 55: widows, widowers andone parent fami
- Page 56 and 57: widows, widowers andone parent fami
- Page 58 and 59: widows, widowers andone parent fami
- Page 60 and 61: child related paymentsSection D: Ch
- Page 62 and 63: child related paymentsTable D3: Exp
- Page 64 and 65: child related payments46Table D9: N
- Page 66 and 67: child related paymentsTable D11: Nu
- Page 68 and 69: illness, disability and caringSecti
- Page 70 and 71:
illness, disability and caringTable
- Page 72 and 73:
illness, disability and caringTable
- Page 74 and 75:
illness, disability and caringTable
- Page 76 and 77:
illness, disability and caringTable
- Page 78 and 79:
illness, disability and caring60Tab
- Page 80 and 81:
jobseeker’s supportsSection F: Jo
- Page 82 and 83:
jobseeker’s supportsGraph F1: Exp
- Page 84 and 85:
jobseeker’s supportsTable F8: Num
- Page 86 and 87:
jobseeker’s supportsTable F10: Nu
- Page 88 and 89:
jobseeker’s supports70Table F14:
- Page 90 and 91:
employment supportsSection G: Emplo
- Page 92 and 93:
employment supportsTable G2: Expend
- Page 94 and 95:
employment supportsTable G8: Number
- Page 96 and 97:
employment supportsTable G14: Numbe
- Page 98 and 99:
supplementary welfare allowanceSect
- Page 100 and 101:
supplementary welfare allowanceTabl
- Page 102 and 103:
supplementary welfare allowance84Ta
- Page 104 and 105:
supplementary welfare allowanceTabl
- Page 106 and 107:
supplementary welfare allowance88Ta
- Page 108 and 109:
supplementary welfare allowance90Ta
- Page 110 and 111:
supplementary welfare allowanceTabl
- Page 112 and 113:
miscellaneous payments and grantsSe
- Page 114 and 115:
miscellaneous payments and grantsTa
- Page 116 and 117:
miscellaneous payments and grantsTa
- Page 118 and 119:
100APPENDICESStatistical</s
- Page 120 and 121:
appendix 1Appendix 1: Social Insura
- Page 122 and 123:
appendix 3Appendix 3: GlossaryRecip
- Page 124:
older summary people and financial1