
You also want an ePaper? Increase the reach of your titles
YUMPU automatically turns print PDFs into web optimized ePapers that Google loves.
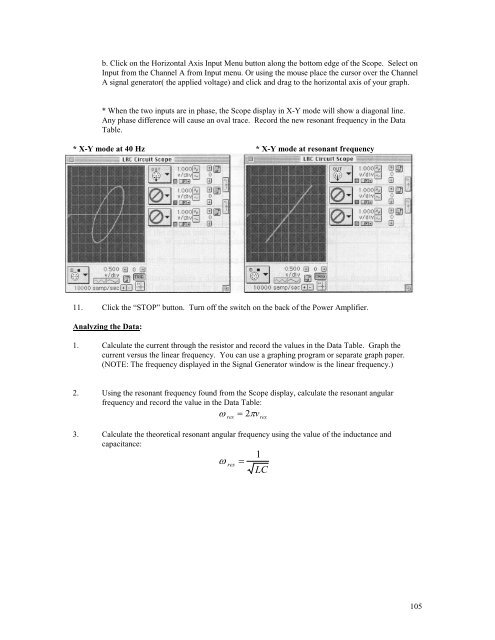
. Click on the Horizontal Axis Input Menu button along the bottom edge of the Scope. Select onInput from the Channel A from Input menu. Or using the mouse place the cursor over the ChannelA signal generator( the applied voltage) and click and drag to the horizontal axis of your graph.* When the two inputs are in phase, the Scope display in X-Y mode will show a diagonal line.Any phase difference will cause an oval trace. Record the new resonant frequency in the DataTable.* X-Y mode at 40 Hz * X-Y mode at resonant frequency11. Click the “STOP” button. Turn off the switch on the back of the Power Amplifier.Analyzing the Data:1. Calculate the current through the resistor and record the values in the Data Table. Graph thecurrent versus the linear frequency. You can use a graphing program or separate graph paper.(NOTE: The frequency displayed in the Signal Generator window is the linear frequency.)2. Using the resonant frequency found from the Scope display, calculate the resonant angularfrequency and record the value in the Data Table:ω = 2 πvres3. Calculate the theoretical resonant angular frequency using the value of the inductance andcapacitance:ω res=1resLC105