GENDER INEQUALITIES IN PRIMARY SCHOOLING - Institute of ...
GENDER INEQUALITIES IN PRIMARY SCHOOLING - Institute of ...
GENDER INEQUALITIES IN PRIMARY SCHOOLING - Institute of ...
Create successful ePaper yourself
Turn your PDF publications into a flip-book with our unique Google optimized e-Paper software.
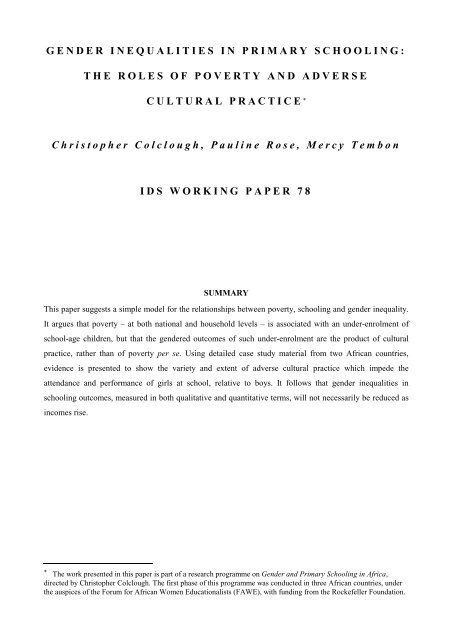
<strong>GENDER</strong> <strong><strong>IN</strong>EQUALITIES</strong> <strong>IN</strong> <strong>PRIMARY</strong> SCHOOL<strong>IN</strong>G:THE ROLES OF POVERTY AND ADVERSECULTURAL PRACTICE *Christopher Colclough, Pauline Rose, Mercy TembonIDS WORK<strong>IN</strong>G PAPER 78SUMMARYThis paper suggests a simple model for the relationships between poverty, schooling and gender inequality.It argues that poverty – at both national and household levels – is associated with an under-enrolment <strong>of</strong>school-age children, but that the gendered outcomes <strong>of</strong> such under-enrolment are the product <strong>of</strong> culturalpractice, rather than <strong>of</strong> poverty per se. Using detailed case study material from two African countries,evidence is presented to show the variety and extent <strong>of</strong> adverse cultural practice which impede theattendance and performance <strong>of</strong> girls at school, relative to boys. It follows that gender inequalities inschooling outcomes, measured in both qualitative and quantitative terms, will not necessarily be reduced asincomes rise.* The work presented in this paper is part <strong>of</strong> a research programme on Gender and Primary Schooling in Africa,directed by Christopher Colclough. The first phase <strong>of</strong> this programme was conducted in three African countries, underthe auspices <strong>of</strong> the Forum for African Women Educationalists (FAWE), with funding from the Rockefeller Foundation.
1 <strong>IN</strong>TRODUCTIONIt is well known that there is a pronounced gender gap in access to, and achievement in, school in manydeveloping countries. There is also a wide discrepancy in total school enrolment rates between countries,particularly, but by no means only, between those at different levels <strong>of</strong> development. It is important tounderstand the reasons for these phenomena. In particular, it would be useful to know whether both stemfrom the same broad cause, or whether there are different causes which interact – and perhaps reinforceeach other. So, for example, if both underenrolment and differential access for boys and girls were primarilycaused by poverty, the gender gap could be expected to disappear as development progressed. If, however,gender differences in enrolment and performance were caused by a set <strong>of</strong> factors other than poverty, theywould need to be the subject <strong>of</strong> separate policy attention. This paper suggests a simple model <strong>of</strong> therelationships between poverty, schooling and gender. Using detailed case study material from two Africancountries, evidence is presented to show that a wide variety <strong>of</strong> cultural practices impede the attendance andperformance <strong>of</strong> girls at school, relative to boys. The paper argues that, as incomes (national and household)rise, so enrolments will tend to follow. However, the speed with which a shift towards greater genderequality occurs will be slow, without measures designed to target cultural practice, and, in their absence,both quantitative and qualitative inequities in school outcomes would be likely to remain entrenched.2 <strong>IN</strong>TERACTIONS BETWEEN POVERTY, SCHOOL<strong>IN</strong>G AND <strong>GENDER</strong>Children who do not attend primary school are overwhelmingly from poor households in poor countries.The majority <strong>of</strong> such non-attendees are girls. Why is this? Figure 1 sketches a simple model whichconnects poverty and gendered outcomes <strong>of</strong> schooling. Its main constituents are as follows. The main locifor poverty/schooling interactions are at the levels <strong>of</strong> the household and <strong>of</strong> the State. 1 As regardshouseholds, in cases where the ease <strong>of</strong> access to schools <strong>of</strong> reasonable quality is similar for all, there aretwo main reasons why poorer households may choose not to send their children to them. The first is that thedirect costs which parents have to meet may be too great. Such costs exist even where school fees are notcharged. In most cases, parents incur some expenditures for school uniforms, text and exercise books. Manyalso have to contribute to the construction or upkeep <strong>of</strong> school buildings, and provide other inputs in cash orkind. Poor households may judge such costs to be beyond their means. 2 The second reason is that poorerhouseholds may depend, more so than richer households, upon the labour <strong>of</strong> their children in order tosupplement household income – either directly, on the farm or in the market place, or indirectly, by childrenundertaking household tasks which liberate adult labour for other remunerated work. For each, or both, <strong>of</strong>these sets <strong>of</strong> reasons, poor households may decide not to enrol some or all <strong>of</strong> their children in school.Quite separately, however, this outcome may arise from there not being schools sufficiently close athand, or from those which are accessible being <strong>of</strong> such poor quality that parents do not wish to use them.Although there is no compelling set <strong>of</strong> reasons why even the poorest States cannot provide their populationswith sufficient primary schools <strong>of</strong> reasonable quality, it remains the case that shortages <strong>of</strong> school places, <strong>of</strong>3
materials and <strong>of</strong> trained teachers, are much more prevalent in poorer than in richer countries, and that theytend particularly to affect the poorer households and communities within them.The above are the four main factors which link poverty, at the level <strong>of</strong> the State and at the level <strong>of</strong> thehousehold, to a circumstance where not all children in the eligible age group attend primary school. Thegendered characteristics <strong>of</strong> this under-enrolment are, however, determined by a further, more diverse, set <strong>of</strong>factors, which are broadly grouped together in Figure 1 under the heading ‘cultural practice’. These arephenomena which cause rationed enrolment opportunities to be unequally allocated between boys and girls.They operate in the domains <strong>of</strong> the household, the school, the labour market and the society as a whole.As regards the latter, gendered roles in society change the balance <strong>of</strong> incentives for girls and boys toattend school. In societies where the main leadership roles in local and national life are occupied by males,where marriage <strong>of</strong> girls occurs at a much younger age than <strong>of</strong> boys, where religious or customary beliefdiscourages social interaction between the sexes, or where conventional opinion encourages women to seetheir future as being centred on the home and the family, the incentives for girls to attend and to performwell in school are less than those for boys.The labour market has a critical influence upon the perceived benefits <strong>of</strong> schooling. Where many jobsare reserved – whether formally or informally – for males, where unemployment is high and the genderbalance <strong>of</strong> formal employment is strongly male, and where gender discrimination in the labour marketreduces the average earnings <strong>of</strong> women relative to men with similar abilities and qualifications, theperceived benefits <strong>of</strong> schooling will be greater for boys than for girls.The environment <strong>of</strong> the school may also be more conducive to the attendance and perfomance <strong>of</strong> boysthan <strong>of</strong> girls. Male teachers may not provide girls sufficient support, and they may even be sexuallythreatening. Toilet facilities for girls may be inadequate, and other facilities (such as a shortage or absence<strong>of</strong> chairs) may be unfriendly to girls. Harassment from boys may occur, and the journey to school may havegreater attendant risks for the safety <strong>of</strong> girls than <strong>of</strong> boys.Finally, much household behaviour is responsive to the broader contextual conditions <strong>of</strong> the societyand the labour market. However, the gendered division <strong>of</strong> labour within the household can sharply affect therelative chances <strong>of</strong> girls and boys attending school. Where girls are expected to perform household chores,and to look after younger siblings, the demands on their time may be greater than upon the boys, and theirschool attendance may be more affected. Where a girl’s allegiance after marriage is mainly to her futurehusband’s family, the balance <strong>of</strong> perceived benefits to parents are likely to favour the education <strong>of</strong> sons overdaughters. Where schooling decisions in families are mainly taken by men, the education <strong>of</strong> boys may againfind greater favour.4
In each <strong>of</strong> the above ways, custom and circumstance lead to a range <strong>of</strong> cultural practices which causethe outcomes <strong>of</strong> schooling to be less favourable for girls than for boys. This paper provides evidence for thediversity and strength <strong>of</strong> this adverse cultural practice. A key question is whether increasing income willchange such practice in ways which can facilitate the achievement <strong>of</strong> equal schooling outcomes. Theevidence presented suggests that more pr<strong>of</strong>ound changes are also likely to be required, if this goal is to beattained.3 <strong>IN</strong>TERNATIONAL TRENDSRapid expansion <strong>of</strong> educational systems has occurred in developing countries over the past forty years. Onaverage gross enrolment ratios at primary level have increased by about 25 per cent – to around 100 – acrossdeveloping countries as a whole. The expansion has been dramatic in some regions. GERs have increasedfrom less than 70 to around 100 in South Asia, and they have almost doubled to about 74 in Sub-SaharanAfrica over the period 1965-94 (Table 1).Table 1: Trends in primary GER by region and gender, 1965-1994SSAArab StatesLACSouth AsiaDevelopingcountriesmalefemaletotalmalefemaletotalmalefemaletotalmalefemaletotalmalefemaletotal1965 1980 1985 1990 199452 87 84 79 8131 68 68 66 6741 77 76 73 74n.a.n.a.n.a.999698835268846278926780106103105926177104859594728310810410698718510790999375841091051071037791106929994778611210811011085981059399NB: Group averages are population weighted.Source: UNESCO Statistical Yearbook, 1996Strong increases in enrolments have happened for both girls and boys. However, an aggregate gender gap inenrolments persists in all regions. Table 2 shows that the enrolment <strong>of</strong> girls at primary level in developingcountries as a whole is still less than 90 per cent <strong>of</strong> that <strong>of</strong> boys. Furthermore, in some parts <strong>of</strong> the worldthe gap remains very wide: in Sub-Saharan Africa (SSA), the Arab States and South Asia, girls’ enrolmentsare only about 80 per cent as high as those <strong>of</strong> boys.6
Table 2: Female enrolments at primary level in developing countries, relative to male enrolments (%)1980 1994Sub-Saharan Africa 78 83Arab States 73 82Latin America and Caribbean 97 96South Asia 66 77All Developing Countries 82 89Source: Calculated from Table 1.On the other hand, Table 2 shows that the enrolment gap between the sexes is narrowing: the female/maleenrolment ratio increased by about 10 percentage points in South Asia and in the Arab States over theperiod 1980-94, whilst in SSA the ratio between female and male enrolments increased at about half thatrate, from about 78 to 83 per cent over those years. Does this suggest, as some have argued (Knodel andJones1996), that gender inequalities are disappearing, and that we can expect the normal process <strong>of</strong>development to deliver gender equity? Unfortunately, even when confining our attention to this macrolevel, there are reasons to be strongly sceptical about this suggestion.First, the rate at which the gender gaps are closing is slow. In SSA, for example, if the rate at which thefemale/male enrolment ratio narrowed over the 14 years 1980-94 were maintained, it would take fully 42years for it to reach unity, the value at which equal enrolments between the sexes would be achieved. In thecases <strong>of</strong> South Asia and the Arab States, the interval would be 24 years in each case. 3 These time periodsare much greater than those adopted by governments in these regions as targets for the achievement <strong>of</strong>schooling for all (SFA). 4Second, it should be noted from Table 1 that the overall enrolment situation in SSA actuallydeteriorated over 1980-94. This was a period, in much <strong>of</strong> Africa, <strong>of</strong> declining per capita and householdincomes, and families experienced greater difficulties in sending their children to school. Thus, the apparentincrease in the female/male enrolment ratio over the period was not due to an improvement in the enrolment<strong>of</strong> girls. In fact it resulted from boys’ enrolment ratios falling substantially (the average male grossenrolment ratio (GER) for countries in Sub-Saharan Africa fell by about 8 percentage points over thedecade 1980-90), whilst girls’enrolment ratios fell to a much smaller extent (about 2 percentage points overthe same years). This is hardly a mechanism which, for the creation <strong>of</strong> greater gender equality, could, orshould, be universalized.Third, the argument which asserts a natural elimination <strong>of</strong> the gender gap as enrolments increaseconfuses the symptoms <strong>of</strong> a definitional necessity, as the move towards GERs <strong>of</strong> 100 occur, with those <strong>of</strong>reduced gender discrimination inside and outside schools and households. We know that the gender gaptends to be wider in countries with low GERs (Colclough with Lewin 1993:62). Figure 2 displays thepattern for SSA. The majority <strong>of</strong> countries have fewer girls than boys enrolled in school (a gender gapbelow unity on the vertical axis). However, it can be seen that the gap narrows as GERs rise to 100. Amoment’s thought will confirm that this is inevitable. Since the GER measures school enrolments relative tothe size <strong>of</strong> the school age-group for both sexes, GERs <strong>of</strong> 100 require 5 the enrolment <strong>of</strong> roughly equal7
numbers <strong>of</strong> girls and boys. So, the fact that the gender gap decreases as enrolment ratios rise isunremarkable. The questions are, first, whether adverse cultural practice is sufficiently strong as to slow thegrowth <strong>of</strong> enrolments (and, therefore, sustain gender inequalities), even where incomes rise. Secondly,whether significant gender discrimination remains – sufficient to affect schooling outcomes – even wherefemale/male enrolments tend towards equality.Figure 2: Relationship between GER and ratio <strong>of</strong> female/male GER in SSA, 1993/941.10LesothoBotswana1.00TanzaniaMalawiKenyaMauritiusNamibiaSouth AfricaCape Verdegender gap (female GER/male GER)0.900.800.70EthiopiaDjiboutiBurkina FasoMaliComorosMauritaniaSudanUgandaMozambiqueCongoSenegalCote d’IvoireCameroonNigeriaZimbabweTogoSwaziland0.60Niger0.50Guinea0.400 20 40 60 80 100 120 140primary GERSource: UNESCO Statistical Yearbook 1996Fourth, as shown in Figure 3, there is very high variation in gender gaps for given levels <strong>of</strong> GDP per capita.It can be seen, for example, that for African countries with per capita incomes <strong>of</strong> around $400, the ratio <strong>of</strong>female/male enrolments varies from around 0.5 to 0.95. Furthermore, although the relationships betweenper capita income, primary GER and reduced gender gaps in enrolments are positive and significant, there isconsiderable dispersion around the regression line with less than 60 per cent <strong>of</strong> the variance being explained(Colclough with Lewin 1993:Table 2.6c). Poverty, then, does not account for gender inequality. It isassociated with it, but there are many other things going on. It is, then, plausible that variations in culturalpractice could explain a good part <strong>of</strong> the variation in gender inequality, for given levels <strong>of</strong> per capitaincome. The idea that income growth alone will not be sufficient to eliminate gender inequality, asmeasured by female/male enrolment ratios, is consistent with these facts.Finally, it should be recognized that the achievement <strong>of</strong> equal enrolment ratios, where GER = 100,does not necessarily mean that the balance <strong>of</strong> disadvantage against the schooling <strong>of</strong> girls at primary level isremoved. A problem hitherto obvious in only quantitative terms may now be detected as a qualitativeproblem – or one that is perhaps more easily identified by analysing female/male progress at secondary or8
tertiary levels. Even if all children attend primary school, examination success for girls may be less, andcontinuation rates to secondary or higher levels may be lower than is the case for boys. Thus it is ironic thatFGER = MGER = 80 may indicate a higher level <strong>of</strong> gender equity in school performance than FGER =MGER = 100, precisely because for the former, but not for the latter, to occur, there is prima facie evidencethat at least some <strong>of</strong> the negative effects <strong>of</strong> adverse cultural practice have been assuaged. 6 Thus, wherediscriminatory forces are entrenched, we cannot assume they have disappeared merely because universalenrolment has been achieved. The latter is too blunt a criterion to be able to reveal what is happening.Accordingly the best way to judge the extent and importance <strong>of</strong> unequal opportunities between the sexes isto study them. This is done, for the cases <strong>of</strong> Guinea and Ethiopia, in the next section <strong>of</strong> this paper.Figure 3: The relationship between GNP per capita and the ratio <strong>of</strong> female/male GER, Africa 1990140120gender gap (fem ale GER/m ale GER)1008060402000 500 1000 1500 2000 2500GNP per Cap ita (US$)4 THE COUNTRY CONTEXTThe economic and social circumstances <strong>of</strong> Ethiopia and Guinea differ in important ways. Whilst Ethiopiahas the second largest population in sub-Saharan Africa (54 million in 1995), that <strong>of</strong> Guinea is small bycomparison (6.2 million in 1995). Their peoples are varied in terms <strong>of</strong> ethnicity and language, withapproximately 80 ethnic groups and languages in Ethiopia and 20 in Guinea. Almost two-thirds <strong>of</strong> thepopulation <strong>of</strong> Ethiopia is reported to be Orthodox Christian and one-third Muslim, whereas in Guinea thevast majority (87 per cent) <strong>of</strong> the population is Muslim, with the remainder being either Christian orAnimist. Partly as a result <strong>of</strong> Guinea’s mineral wealth (bauxite, diamonds, gold and iron), its GNP per capita($520 in 1994/5) is close to the SSA mean, and substantially higher than that for Ethiopia ( US$100 in thesame year), which is reported to be the second lowest in the world. However, notwithstanding Guinea’sgreater wealth, both countries have low levels <strong>of</strong> social and human development even compared with theaverages for both SSA and for the world’s least developed countries (Table 3).9
Table 3: Socio-economic indicators, 1993GDPpc(US$)LifeExpecatBirth(years)InfantMortalityRate(per 1,000live births)Adult literacyrate (%)Access to water, health andsanitation facilities(%)Male Fem drinkingwaterhealthfacilitiesEthiopia 100 48 118 44 24 25 46 19Guinea 520 45 133 48 20 55 80 21SSA 555 51 110 65 45 45 57 37Least DevelopedCountriessanitationfacilities210 51 70 58 36 52 50 31Source: United Nations Human Development Report, 1996Recent trends in enrolmentsBetween 1987 and 1992, Ethiopia was engulfed by civil war. Primary enrolments in the country had neverbeen high, but during the war they plummetted from around 35% to scarcely 20% <strong>of</strong> the age-group. Theenrolment <strong>of</strong> girls has lagged those <strong>of</strong> boys. However, during the war years, the gender gap in enrolmentsnarrowed substantially (Figure 4) because the enrolment <strong>of</strong> boys fell most, owing mainly to their wish toavoid conscription, the risks <strong>of</strong> which were greater for school attendees. With the end <strong>of</strong> the war and theinstallation <strong>of</strong> a new government, enrolments rose from 1993 onwards. However, the growth <strong>of</strong> girls’enrolments has recently been considerably slower than those <strong>of</strong> boys and the gender gap has widened again.In Guinea, enrolment trends have shown a different pattern. Having been stagnant during the 1980s,they began to increase from 1990 (Figure 5), when a number <strong>of</strong> educational reforms and systemimprovements were introduced. Here, too, the gender gap widened during this recent growth: girls’enrolments were only 34 per cent <strong>of</strong> the total in 1994/5, compared with 37 per cent in Ethiopia, in spite <strong>of</strong>Guinea’s substantially higher income and overall enrolment ratio. These national trends, however, maskrural/urban and regional differences which can sometimes be considerable. In general, the gender gap iswider in regions with lower enrolments and in rural areas, compared with urban areas (where, in bothcountries, enrolments <strong>of</strong> boys and girls are almost equal).10
Figure 4: Ethiopia, Primary GER, 1980 – 199450.0%45.0%40.0%35.0%30.0%25.0%20.0%15.0%10.0%5.0%0.0%1980 1981 1982 1983 1984 1985 1986 1987 1988 1989 1990 1991 1992 1993 1994malefemaleSource: Ministry <strong>of</strong> Education 1995; 1996Figure 5: Guinea primary GER 1980 –199470.0%60.0%50.0%40.0%30.0%20.0%10.0%0.0%1980 1981 1982 1983 1984 1985 1986 1987 1988 1989 1990 1991 1992 1993 1994malefemaleSource: MEPU-FP (various years)11
Gross enrolment rates in Ethiopia and Guinea are amongst the lowest in SSA, and both compare poorlywith the overall average for the region (Figure 6). In 1994/95 the GER for Ethiopia was 36 per cent for boysand 22 per cent for girls, compared with 61 per cent and 29 per cent, repectively, in Guinea. Net (ageadjusted) enrolment ratios are considerably lower than gross ratios in both countries because <strong>of</strong> high rates <strong>of</strong>over-age enrolment, repetition, and drop-out with later re-entry into the system. The disparity between grossand net enrolment ratios is, however, larger for boys than for girls in both countries, because girls are lesslikely to be in school when they reach the age <strong>of</strong> puberty, despite their having higher rates <strong>of</strong> repetition (seebelow).Figure 6: Primary GER by gender, 1994/95GER90%80%70%60%50%40%30%20%10%0%SSA Guine EthiopiboysgirlsSource: UNESCO Statistical Yearbook 1996; Ministry <strong>of</strong> Education 1996; MEPU-FP 1996The education systems in both countries suffer from severe internal inefficiency. In Guinea, 24 per cent <strong>of</strong>girls and 21 per cent <strong>of</strong> boys in primary school were repeaters in 1993/94, compared with 11 per cent andseven per cent, respectively, in Ethiopia. In the same year, 28 per cent <strong>of</strong> girls and 24 per cent <strong>of</strong> boysdropped out before completing the first grade <strong>of</strong> school in Ethiopia. In both countries, repetition and dropout rates are higher for girls than for boys in most primary grades. Cohort analysis, shown in Figure 7,reveals that, <strong>of</strong> 1,000 pupils starting school in 1993/94, 523 boys and 447 girls could be expected tocomplete grade six in Ethiopia within eight years, and that the comparable figures for Guinea would be 500boys and 373 girls. Although the repetition rates are high, they are not atypical for SSA, but the survivalrates indicated above are amongst the very lowest in world (see UNESCO 1998: 136-139).12
Figure 7: Cohort analysis <strong>of</strong> primary grade completion in Ethiopia and Guinea, 1993/94-1999/200010009008007006005004003002001000admission 1 2 3 4 5 6male - Ethiopia female - Ethiopia male - Guinea female - GuineaSource: Calculated from Ministry <strong>of</strong> Education 1995; and MEPU-FP 19955 EXPLANATIONS OF LOW ENROLMENTS AND <strong>GENDER</strong> GAPS <strong>IN</strong> ETHIOPIA ANDGU<strong>IN</strong>EAThis section compares the results <strong>of</strong> intensive school-based surveys undertaken at the school andcommunity levels in Ethiopia and Guinea in 1995. 7 The survey work focused on two areas within eachcountry 8using a combination <strong>of</strong> both quantitative and qualitative research tools. Qualitative methodsincluded focus group discussions and interviews with education <strong>of</strong>ficials, teachers, pupils, schoolcommittees, parents and community elders. These provided a more detailed understanding <strong>of</strong> the processesand issues explored in the quantitative work. The surveys were designed on the basis <strong>of</strong> purposive, ratherthan random sampling methods, and were intended to provide case-study information which could throwfresh light on the constraints affecting the participation and performance <strong>of</strong> girls and boys in school.The sampling procedure followed in each country involved the selection <strong>of</strong> two geographical regions,based on their differences in enrolment ratios and gender gaps in school enrolments, and in language,religion and economic conditions. Within each region, districts were selected which reflected the region’sbroader characteristics. Districts were stratified into rural and urban areas, where schools having sufficientpupils in the sixth grade were selected. Within the selected schools, random samples <strong>of</strong> grade 6 pupils forthe urban schools, and complete enumerations <strong>of</strong> such pupils in the rural schools, were undertaken.More emphasis was given to rural areas in each country since a larger proportion <strong>of</strong> the population inboth countries reside in these areas. The selected schools and their catchment areas provided the basis forthe fieldwork, and formed natural clusters <strong>of</strong> pupils, drop outs and non enrolees. Individual questionnaire-13
ased interviews were conducted with each <strong>of</strong> the respondents. Results are discussed below under the fivemain headings, representing constraints to primary schooling, identified earlier – namely direct costs,opportunity costs, the extent and quality <strong>of</strong> physical provision, and the presence <strong>of</strong> adverse culturalpractice.Direct costsAn inability to meet the direct costs <strong>of</strong> schooling was found, in the field surveys, to be one <strong>of</strong> the mostimportant causes <strong>of</strong> non-attendance in both countries. Those who had dropped out <strong>of</strong> school cited mostfrequently, as an important reason, a lack <strong>of</strong> money to pay for school expenses (Table 4). A similar pattern<strong>of</strong> reasons to that shown in the table was also given by those who had never attended school.Table 4: Reasons for dropping out <strong>of</strong> schoolEthiopiaGuineaMale Female Male FemaleNo. % No. % No. % No. %Lack <strong>of</strong> money to pay for school expenses 25 40 16 30 10 38 2 6Wanted to earn money 7 11 0 0 1 4 2 6Needed to work at home 3 5 14 26 1 4 6 17Needed to work on the farm 14 23 1 2 1 4 1 3Illness 3 5 8 15 3 11 6 18Family problems 3 3 5 9 1 4 5 15School problems 2 3 2 4 7 27 10 29Other 5 8 7 13 2 8 2 6Total 62 100 53 100 26 100 34 100Source: Field SurveysIn one <strong>of</strong> the Ethiopian regions surveyed, school fees had just been abolished. In the other region, fees werestill charged, and, during focus group discussions, parents claimed to find difficulty in paying them,especially since they became due in September, when family income was at its lowest prior to the harvest.Parents also complained that, because they were unable to buy exercise books, pens and the necessaryclothing for school, they were not able to enrol their children. 9 Some parents also mentioned that, evenwhen their children did enrol in school, they <strong>of</strong>ten had to drop out during the first grade because they foundit difficult to meet the direct costs involved.The problem <strong>of</strong> meeting the direct costs <strong>of</strong> schooling was found to be equally prevalent in Guinea.Even though tuition fees were not charged at the primary level, parents were expected to pay GF 2000 ($2)for registration, and to buy the necessary textbooks, exercise books, stationery, and the prescribed uniformsfor their children. In Guinea, textbooks were the most expensive item <strong>of</strong> direct costs, followed byuniforms. 10 In addition to making these payments, parents were obliged to produce certified true copies <strong>of</strong> achild’s birth certificate as a requirement for school admission. Acquiring these documents was sometimesexpensive, especially for parents in rural areas where administrative <strong>of</strong>fices providing such services do notexist.14
The costs <strong>of</strong> sending a child to school were not always predictable in Guinea. For example, in one <strong>of</strong>the schools visited, parents had been required to pay GF.16,000 ($16), to secure their child’s entry to Gradeone. A local contractor, who had recently finished building a government secondary school, had beeninformed that the government could not meet his costs. The Grade one levy was introduced by the districteducation authorities in order to allow the bill to be paid. Parents asserted, in the focus group discussions,that such levies (which had included contributions towards the construction <strong>of</strong> classrooms, the purchase <strong>of</strong>furniture, and other school equipment) undermine the ability <strong>of</strong> parents to send their children to school.To make up for parents’ inability to pay for schooling, some children undertake paid work to financetheir education. The surveys in both countries revealed that a larger proportion <strong>of</strong> boys than girls earnmoney to help pay for their school expenses (Table 5).Table 5: Pupils Working for Cash to Pay for their SchoolingEthiopiaGuineaRegion 1 Region 2Male Female Male Femaleno. % no. % no. % no. %Yes 39 55 17 38 23 40 5 13No 32 45 28 62 35 60 34 87Total 71 100.0 45 100.0 58 100.0 39 100.0Yes 36 41 8 21 17 23 2 7No 54 59 30 79 58 77 28 93Total 90 100 38 100 75 100 30 100Note: In this, and in subsequent tables, Region 1 is Jimma in Ethiopia and Forest Guinea in Guinea, and Region 2 is East Gojjam in Ethiopia andMiddle Guinea in Guinea.Source: Field surveys.In both countries, parents considered that the direct costs <strong>of</strong> schooling were similar for boys and girls. 11However, boys were more able to attend school because, to some extent, they could support themselves. Forexample, a father in Ethiopia noted that, because boys were involved in trading activities, they could buytheir own exercise books and pens. He noted that girls, on the other hand, were involved in householdchores and in some farm activities, which, he felt, did not help families so much in sharing the cost <strong>of</strong> theireducation. This suggests that, even though girls' labour directly assists the family economy, it may not berecognised as being as beneficial as that <strong>of</strong> boys, in cases where it does not directly generate cash income.Both boys and girls <strong>of</strong>ten engage in petty trading. In Guinea, for example, it is common in the villagesand towns to see young girls carrying large trays <strong>of</strong> groundnuts, fruits or other food items for sale. They alsohelp their parents in food stalls in the market place. Girls in both countries are sometimes withdrawn fromschool and sent to work in urban areas as housemaids. However, rather than being able to use the moneythey earn as a contribution towards school expenses, girls are usually obliged to give the income to theirparents.The ability to pay for children’s schooling depends on the income <strong>of</strong> parents or households. Measuringthis, in Africa, can be quite difficult, given that many rural households are hardly incorporated into the cash15
to work at home or on the farm accounted for 39 per cent <strong>of</strong> the replies from Ethiopian male drop-outs and28 per cent <strong>of</strong> those from girls (see Table 4). In Guinea, the relevant magnitudes were 12 per cent and 26per cent, respectively. However, the types <strong>of</strong> activities which are the source <strong>of</strong> these opportunity costsappear to differ sharply between the sexes. In both countries, the girls who dropped out for these reasons didso mainly in order to help the family in the home, whilst the boys who did so cited work on the family farm,or earning money as their main intent.Discussions with those who had dropped out <strong>of</strong> school revealed that, whilst some boys are able tocombine their income-earning activities and schooling, others find it difficult to do so, and eventually leave.Some <strong>of</strong> those interviewed in Guinea were disinclined to return to school because their current activitieswere more pr<strong>of</strong>itable in the short term. In Ethiopia, many children, <strong>of</strong> both sexes, who enrol in September,at the beginning <strong>of</strong> the school year, leave by November because demands on their labour during harvesttime are so great. In some cases, they re-enrol the following year in grade one but, again, are unable tocomplete the year.It is not possible to achieve accurate estimates <strong>of</strong> the duration <strong>of</strong> work undertaken by children for theirfamilies, using survey methods which are dependent upon recall by the children themselves. However, itproved possible, in our surveys, for children to indicate both the range <strong>of</strong> their different tasks, and thefrequency with which they undertook them. The responses to such questions allowed the construction <strong>of</strong> aweighted ‘household help’ index, based upon the frequency with which pupils, drop-outs and non-enroleesperformed certain chores – every day, every week, sometimes, or never. The results are presented in Table 7.Table 7: Average index <strong>of</strong> household helpRegion 1 Region 2Pupils Drop-outs Non-enrolees Pupils Drop-outs Non-enroleesEthiopia male 25.3 15.0 14.0 20.9 12.5 12.71(16.4) (6.5) (8.0) (14.0) (10.2) (8.0)female 44.9 25.6 25.5 41.1 26.7 23.9(18.0) (9.6) (6.8) (15.7) (9.0) (8.4)Guinea male 23.0 13.1 17.8 12.7 9.7 15.3(15.8) (8.2) (9.7) (10.8) (7.1) (10.0)female 34.3 28.9 24.7 31.1 28.1 23.7(14.8) (8.7) (8.1) (15.2) (8.9) (9.3)The major result which emerges from this exercise is that the household help index is, consistently,significantly higher for girls than for boys. This is true for each <strong>of</strong> the samples <strong>of</strong> pupils, drop-outs and nonenrolees,in both <strong>of</strong> the regions surveyed, in each <strong>of</strong> the two countries. It is important to note that this indexmeasures both the range <strong>of</strong> activities practised, and their frequency, but that it does not measure the duration<strong>of</strong> each activity. However, unless boys consistently spend longer working upon each activity than girls,these results strongly suggest that girls help their families more than boys, and that the opportunity costs <strong>of</strong>girls’ schooling may, accordingly, be greater. 13 The surveys also revealed evidence <strong>of</strong> a strongly gendereddivision <strong>of</strong> labour. Female pupils, in both countries, were generally more involved in household activitiessuch as looking after siblings, preparing and cooking food, cleaning the house and fetching water and17
firewood. Boys, on the other hand, were mainly involved in working on the family farm, ploughing andharvesting crops, looking after livestock and fetching firewood.No evidence is apparent from Table 7 that drop-outs and non-enrolees helped their families at homemore than pupils. Indeed, with the single exception <strong>of</strong> male pupils in Middle Guinea, the task-loads carriedby pupils in our surveys appear to have been greater than those <strong>of</strong> their peers who were not attendingschool. If the opportunity costs <strong>of</strong> schooling are high, one would expect the school drop-outs and the nonenrolledto be undertaking more, rather than less, tasks than their pupil colleagues. However, we know thatsome <strong>of</strong> those who were out <strong>of</strong> school were conducting economic activity on their own account – and,therefore, contributing to household income. Thus, the average value <strong>of</strong> both household and income-earningtasks, taken together, could have been substantially greater for those not at school than for pupils.Furthermore, we know that the families <strong>of</strong> pupils and <strong>of</strong> those who are out <strong>of</strong> school differ in terms <strong>of</strong> socioeconomicstatus, and other characteristics, which may be related to the incidence <strong>of</strong> opportunity costs.These inter-group comparisons could not, therefore, provide evidence for the relative levels <strong>of</strong> such costsunless such differences were taken into account in the analysis. Again, as was the case with pupils, a closeexamination <strong>of</strong> the data revealed that, for these groups, there was generally a distinctly gendered division <strong>of</strong>labour in the tasks performed.It is to be expected that the relative number <strong>of</strong> adults and children in a household would affect theopportunity cost <strong>of</strong> schooling. As regards the former, the more adults in the household the lower the demandfor children's labour might be, and the freer the children might be to attend school. 14 Furthermore, a largernumber <strong>of</strong> adults in the household provides greater opportunity to earn income to support the family. In bothcountries, however, the pattern appears to be mixed (Table 8). For boys, there appears to be no tendency forpupils to come from households with more adults than is the case for those who are not enrolled in school.However, for girls, pupils come from households with more adults than is the case for those not at school,in three <strong>of</strong> the four regions surveyed – the exception being Middle Guinea. However, the differences aresmall and too much significance should not be attached to these results.Table 8: Number <strong>of</strong> Adults in the HouseholdRegion 1 Region 2Pupils Drop-outs Non-enrolees Pupils Drop-outs Non-enroleesEthiopia male 2.9 2.3 2.3 2.6 2.5 2.6(1.6) (1.0) (1.0) (1.0) (1.2) (2.4)Female 3.0 2.0 2.3 2.7 2.3 2.6(1.6) (1.0) (1.0) (1.2) (1.1) (2.4Guinea Male 3.5 4.1 3.4 2.9 2.9 3.3(1.7) (2.3) (1.5) (1.3) (1.4) (1.4)Female 3.4 2.9 3.1 2.2 3.0 3.1(1.6) (1.5) (1.3) (0.9) (1.2) (1.2)The number <strong>of</strong> children in the household is also likely to affect the opportunity costs <strong>of</strong> schooling –although the direction <strong>of</strong> this impact is uncertain. On the one hand, the larger the number <strong>of</strong> children in thehousehold, the more household work there is likely to be (especially for girls) and, therefore, the higher will18
e the opportunity costs <strong>of</strong> their time. Direct costs also increase with sending each additional child toschool. On the other hand, a particular child from a larger household might have a higher probability <strong>of</strong>attending school because work is spread over a larger number <strong>of</strong> household members. Thus, the direct costs<strong>of</strong> schooling for all children taken together are greater in larger households, but the opportunity costs for atleast some <strong>of</strong> them are likely to be lower than for children with fewer siblings. The evidence from oursurveys on these points, summarized in Table 9, is ambiguous. In Guinea, there was no particularrelationship between the number <strong>of</strong> siblings and schooling status. However the table shows that, in Ethiopia,both male and female pupils, from both areas visited, came from larger families than those who were notattending schools, and that, as the above analysis would suggest, the differences in numbers <strong>of</strong> siblingsbetween pupils and non-pupils were greater for the girls than for the boys. This, then, is consistent with theview that children, and particularly girls, had a better chance <strong>of</strong> attending school if household work couldbe spread amongst a larger number <strong>of</strong> siblings (who themselves may or may not be in school).Table 9: Number <strong>of</strong> children in the householdRegion 1 Region 2Pupils Drop-outs Non-enrolees Pupils Drop-outs Non-enroleesEthiopia male 3.8 3.5 2.7 3.8 3.1 2.9(2.4) (2.3) (1.5) 1.3 (1.6) (1.7)female 3.9 3.7 2.9 3.3 3.3 2.8(2.2) (1.9) (1.2) 1.6 (1.8) (1.5)Guinea male 6.2 7.6 5.6 5.3 6.5 5.3(3.4) (3.6) (3.5) (2.9) (3.8) (4.9)female 6.5 6.8 6.2 5.5 5.5 4.5(3.4) (4.2) (4.2) (2.1) (2.8) (2.3)Physical ProvisionProblems <strong>of</strong> insufficient demand for primary schooling, owing to high direct and opportunity costs, arecompounded by an inadequate supply <strong>of</strong> schools, or <strong>of</strong> enough school places, in many countries. Ethiopiaand Guinea are both cases where the distribution <strong>of</strong> primary schools is very uneven. In both countries,schools are concentrated in urban areas, whilst rural areas remain under-served. Here, as elsewhere, thegreater is the distance from home to school, the less likely it is that a child will attend. 15 In our surveys, thedistance between home and school was estimated by drawing a map <strong>of</strong> the local village, showing keylandmarks and the location <strong>of</strong> children’s homes. In both countries, the boys and girls who were in schoollived relatively nearby (two kilometres from the school, on average, in Ethiopia, and less than onekilometre, on average, in Guinea). In both countries, however, the rural schools visited were serving homeswhich were widely dispersed, suggesting that many more children, than those who actually attended, shouldhave been in school. Although the length <strong>of</strong> the journey to school affects the attendance <strong>of</strong> both boys andgirls, the effects <strong>of</strong> distance are more severe for girls. During focus group discussions in both countries,parents expressed their reluctance to send girls to schools which were far from home. This was partlybecause girls were considered by parents to be weaker than boys, and unable to expend the energy required19
to walk to and from school. However, their reluctance was also due to parental concern for girls’ safety enroute and to their fear that their daughters may be subject to sexual harrassment.Inadequate school facilities also lead to non-enrolment. In Guinea, more than two thirds <strong>of</strong> ruralschools are incomplete, having only two or three grades. In such schools, admissions into the first grade arestaggered – happening once every two or three years. This means that some children are forced to startschool later than the <strong>of</strong>ficial starting age, bringing negative implications for children’s, and particularly forgirls’, chances <strong>of</strong> completing the primary cycle.The absence <strong>of</strong> latrines in schools, and particularly <strong>of</strong> separate latrines for girls, causes girls to beabsent from school, especially when they are menstruating (Brock and Cammish 1995). Only five <strong>of</strong> the 11schools visited in Ethiopia had latrines, and, <strong>of</strong> these, only one was separated for boys and girls.Furthermore, in most cases, the latrines were not in a suitable condition for use. In Guinea, only two <strong>of</strong> thesix schools surveyed had latrines. Some girls in both countries expressed their need for private facilities,which were <strong>of</strong>ten absent in their schools. The discomfort <strong>of</strong> not being able to clean themselves, and changeclothing at school during menstruation, provided an additional cause <strong>of</strong> absence, and <strong>of</strong> subsequent poorperformance or drop-out <strong>of</strong> girls. In Ethiopia, only 16 <strong>of</strong> the 84 girls interviewed in school had startedmenstruating. This relatively small proportion reflects the tendency for girls to drop out <strong>of</strong> school beforereaching puberty.Quality <strong>of</strong> ProvisionPoor school quality is associated with poor academic results, with higher levels <strong>of</strong> repetition and drop-outand with lower progression ratios to higher levels <strong>of</strong> the education system than is the case for better schools.Communities served by poor quality schools <strong>of</strong>ten recognize that they are likely to gain a more restrictedrange <strong>of</strong> benefits from schooling than people elsewhere. This therefore leads to lower demand, and to morechildren being out <strong>of</strong> school than in communities with high quality schools. Although it was not theintention, in our surveys, to measure and compare, in a strict quantitative sense, the differences between thequality <strong>of</strong> different schools, a number <strong>of</strong> aspects <strong>of</strong> school quality were shown to have an impact uponenrolment and performance outcomes.One <strong>of</strong> these concerned the health environment <strong>of</strong> the schools. In both countries, poor health, which isa consequence <strong>of</strong> either malnutrition or <strong>of</strong> common diseases, was found to be a constraint on schooling. Theillnesses found most commonly amongst pupils included malaria, stomach problems, headaches, colds/flu,wounds and diarrhoea. In Ethiopia, not only was poor health an impediment to school attendance, it wasalso found to be a barrier to enrolment, because some parents were afraid <strong>of</strong> their children catchingcontageous diseases at school. The prevalence <strong>of</strong> these illnesses was further compounded by the fact thatnone <strong>of</strong> the schools visited, in either country, had their own water source, and in most cases pupils had towalk to the nearest stream to fetch it. The conditions under which the water was stored and served were<strong>of</strong>ten unhygienic and could lead to diarrhoea. In Guinea, for example, in one <strong>of</strong> the schools visited, each20
classroom had a bucket <strong>of</strong> water for drinking at the front <strong>of</strong> the class. However, the buckets had no lids andall the children used the same cup.The distribution <strong>of</strong> female teachers has an important impact on school quality for female pupils. Theirpresence is important to provide girls with role models and to provide counselling, especially on issuesrelated to puberty. In fact, however, the proportion <strong>of</strong> female teachers varies widely between schools in bothcountries. In Ethiopia fewer than one-third <strong>of</strong> the teachers in five <strong>of</strong> the schools visited were female while inthe other six schools over two-thirds were female. In Guinea, in the schools visited, only one-third <strong>of</strong> theteachers were female. Some <strong>of</strong> the rural schools visited, in both countries, had no female teachers. Theimbalance <strong>of</strong> female to male teachers in rural schools derives partly from working conditions. Aftergraduating from teacher training colleges, female teachers in both Ethiopia and Guinea tend to be posted tourban schools which are more accessible by public transport, have better access to markets and other socialamenities, and bring fewer problems for those with partners working in towns.Within schools, female teachers in Guinea were generally assigned to teach in lower classes (grades 1-4) whereas male teachers were teaching the top grades. This unequal distribution <strong>of</strong> teachers tends to have anegative effect on girls in the last grades <strong>of</strong> primary school, who might be approaching or have attained theage <strong>of</strong> puberty. The problem <strong>of</strong> a lack <strong>of</strong> female teachers was evident from one school in Ethiopia in whichall the teachers were male. The teachers themselves were aware <strong>of</strong> the problems girls face when they reachpuberty. They noted that they were unable to provide guidance concerning menstruation because girls wereshy and they were afraid that girls might take it as sexual provocation. They were conscious, however, thatgirls stopped coming to school when they started menstruating. No school in either <strong>of</strong> the two countries hadmade provisions for guidance and counselling for girls. Each <strong>of</strong> these factors undoubtedly made it morelikely that girls would drop out <strong>of</strong> their primary course before reaching the final grade.Adverse Cultural PracticeThe above discussion <strong>of</strong> factors which lead to under-enrolment <strong>of</strong> school-age children – high direct costs,high opportunity costs, and the inadequate extent or quality <strong>of</strong> physical provision – has already alluded toaspects <strong>of</strong> cultural practice which lead to differentiated outcomes in school enrolments and performance forgirls and boys. The most important <strong>of</strong> these is the existence <strong>of</strong> a gendered division <strong>of</strong> labour within thehousehold, which has probably led, in Ethiopia and Guinea, to higher opportunity costs being associatedwith the schooling <strong>of</strong> girls relative to boys. There are, however, other aspects <strong>of</strong> cultural practice whichconspire systematically to reinforce such outcomes, and which have been revealed by our work. These arediscussed below, under the four headings – society, labour market, school and household – indicated inFigure 1.Factors related to cultural norms, traditional beliefs and practices can have a strong influence on girls’enrolment, persistence and performance in school. Some societies regard the pregnancy <strong>of</strong> unmarrieddaughters as culturally shameful. To avoid embarassment, parents, in some rural areas, give their daughtersin marriage as soon as they reach the age <strong>of</strong> puberty, and sometimes earlier. In one <strong>of</strong> the regions visited in21
Ethiopia, girls are married as early as the age <strong>of</strong> eight years. In this region, amongst those interviewed,almost half <strong>of</strong> the girls who had never enrolled in school, and one third <strong>of</strong> those who had dropped out, wereeither married or divorced. Their age <strong>of</strong> marriage varied between eight and 14 years. In many parts <strong>of</strong>Ethiopia early marriage is hardly voluntary. It was reported in one <strong>of</strong> the regions that girls sometimes get’kidnapped’ on their way to school, or even from within the school compound itself, by the parents <strong>of</strong> boys,for marriage to their sons. As a result <strong>of</strong> this risk, some parents refuse to send their daughters to school.Early marriage is also common in Guinea, and was mentioned in the groups as a constraint on the schooling<strong>of</strong> girls. 16In some societies, initiation ceremonies are performed when children reach the age <strong>of</strong> puberty, which isconsidered to be the onset <strong>of</strong> adulthood. During the ceremony, knowledge and values concerningprocreation, morals, sexual skills, birth control and pregnancy are passed on to the girls concerned. Boysundergo similar rituals preparing them for manhood. Where initiation ceremonies are socially obligatory, asin some areas <strong>of</strong> Guinea, they were found to be a constraint on primary schooling, but this was not the casein the areas visited in Ethiopia. In one <strong>of</strong> the survey areas in Guinea, these ceremonies were sometimesperformed during term-time and they could cause absenteeism from school for periods ranging from oneweek to one month – sometimes with withdrawal from school being the end result. The impact wasperceived to be greater for girls’ schooling because it is <strong>of</strong>ten considered shameful for them to return toschool after initiation, unlike the case <strong>of</strong> boys.As regards the labour market, in most countries, the tangible benefits <strong>of</strong> schooling are linked to theavailability <strong>of</strong> employment opportunities in the formal sector. In Ethiopia, the lack <strong>of</strong> opportunities for suchemployment, particularly so in the rural areas, and thus the absence <strong>of</strong> many school graduates who hadsucceeded in obtaining such employment, was a deterrent to parents sending their children to school. Infocus group discussions, some parents reported that they had lost confidence in the education system andthat the educated youth had become frustrated, sometimes leading school-leavers into crime. Some groupsnoted that high failure rates in the school certificate examination at grade 12, amongst those who proceededthat far, added to the difficulties <strong>of</strong> finding a job. This was particularly important for girls since there werejudged to be even fewer employment opportunities for them, and very few female role models. In oneregion, it was interesting to note that uneducated traders were <strong>of</strong>ten perceived to be more important rolemodels than teachers or other educated people, because <strong>of</strong> the larger amounts <strong>of</strong> money they were able toearn.As for the schools, the importance <strong>of</strong> achieving a better distribution <strong>of</strong> female teachers has alreadybeen mentioned as a means <strong>of</strong> securing higher quality schooling for girls. However, teachers’ attitudes,including those <strong>of</strong> both men and women, may merely reflect, rather than question, the gendered attitudesprevalent in the wider society. In some cultures, girls may be expected to be quiet, obedient, moresubmissive and less active in certain school activities than boys. This is also reflected in the tasks thatteachers expect girls and boys to undertake during school time. Both male and female pupils in Ethiopia andGuinea revealed that, in general, girls spent more time performing non-school activities during school hours,22
such as cleaning the classroom and <strong>of</strong>fices, cleaning the latrines (which in some cases in Ethiopia wasproposed by boys to be ‘girls work’), fetching water for the school, and undertaking tasks for teachers. Suchexpectations result in girls being timid and less self confident <strong>of</strong> their abilities. This feeling perpetuatesitself and manifests in their poor performance at school.Gender sensitivity <strong>of</strong> teachers can be inculcated via training. However, none <strong>of</strong> the teachers in Ethiopiaand less than one-fifth in Guinea had attended gender training courses. In the surveys, teachers were askedto give their views about pupils’ performance in school. The results, shown in Table 10, reveal that teacherattitudes were biased against girls. In Guinea, male teachers had more positive views about boys’participation and interest, whereas the much smaller number <strong>of</strong> female teachers tended to have morepositive views about girls than boys. However, in the Ethiopian surveys, the majority <strong>of</strong> both male andfemale teachers believed that boys were more intelligent, participated more in class, and were moreinterested in learning, than girls. Although schooling, in both countries, was considered by teachers to be <strong>of</strong>equal importance for boys and girls, it is not surprising that female pupils conform to the rather strongexpectations <strong>of</strong> their teachers that they will be less successful than their male peers.Table 10: Teachers’ attitudesWhom do you think is most intelligent?BoysGirlsboth the sameWho participates most in class?BoysGirlsboth the sameWho is more interested in learning?BoysGirlsboth the sameFor whom is schooling moreimportant?BoysGirlsboth the sameETHIOPIAGU<strong>IN</strong>EAMale Female Male Femaleno. % no. % no. % no. %50619703243102247646682593435713305986291143905294111735662328901166925216881261016481837242243213657142964112571479450360243153445603367022453315633Finally, as regards households, expectations <strong>of</strong> gender roles associated with the traditional image <strong>of</strong> womenas home-makers (wives and mothers) was also found to be an explanation for negative parental attitudes togirls’ schooling. In Ethiopia, some parents mentioned that after twelve years <strong>of</strong> schooling, their daughterswould be unable to perform housework and may not be able to find a husband, on account <strong>of</strong> being too old.Similar attitudes were expressed in Guinea, where some parents mentioned that primary schooling isirrelevant to girls’ future roles. Girls are traditionally expected to know how to prepare meals, to clean thehome, to do the laundry and care for young children, and to be obedient and submissive. To ensure thatthese skills are properly developed before the girls are given in marriage, some parents prefer to keep their23
daughters at home with their mothers. This is partly because parents believe that these skills are notproperly taught in school and partly because they are ignorant <strong>of</strong> the overall benefits <strong>of</strong> girls’ schooling.Some parents in Guinea also believed that daughters were not as intelligent as sons. Thus, sending them toschool was considered more likely to be a waste <strong>of</strong> time and money, because, in the end, they were judgedless likely to perform as well as boys.Cultural practice and the opportunity costs <strong>of</strong> schooling are closely linked to age. As children becomeolder, the more likely are they to be withdrawn from school. The chances <strong>of</strong> girls being withdrawn to helpwith work at home, or to be given in marriage, increase with age, as does the probability <strong>of</strong> boys droppingout <strong>of</strong> school to work on the farm or earn income. Girls in the schools visited were, on average, youngerthan boys, especially in Ethiopia (Table 11).Table 11: Pupil’s ageRegion 1 Region 2Ethiopia male 15.5 13.0(3.1) (1.2)female 14.1 12.6(2.1) (1.2)Guinea male 14.7 13.9(1.6) (1.5)female 14.3 13.4(1.6) (1.5)The differences in age between male and female pupils could be due to the fact that girls, in both countries,started school at an earlier age than boys (Table 12). However, it is important to note from the table that thestarting age <strong>of</strong> pupils in both countries was lower than that <strong>of</strong> drop-outs, which supports the view that agehas an effect on persistence in school, especially for girls. 17Table 12: Average school starting ageRegion 1 Region 2Pupils Drop-outs Pupils Drop-outsEthiopia male 8.3 9.4 7.1 8.7(2.0) (2.4) (2.0) (2.4)female 7.6 9.9 7.0 8.2(1.5) (2.0) (1.5) (2.0)Guinea male 8.0 8.4 7.3 8.0(1.7) (1.5) (1.4) (1.5)female 7.4 7.3 6.9 7.2(1.4) (1.2) (1.0) (1.4)The decision to enrol a child in school is determined by the perceptions that his/her parents hold about thebenefits <strong>of</strong> schooling (relative to the peceived costs <strong>of</strong> so doing). The perceptions <strong>of</strong> benefits are linked toexpectations <strong>of</strong> the child’s role when (s)he grows up. Male children, in most African cultures (including inEthiopia and Guinea), inherit the family’s assets – and continue to support their parents in old age –whereas female children become a part <strong>of</strong> their husbands’ families after marriage. Thus, investing in a girl’s24
education is <strong>of</strong>ten perceived as not being beneficial to her own family, because any benefits <strong>of</strong> hereducation will go to her future husband’s family, rather than her own. 18 Some <strong>of</strong> the group discussions inGuinea revealed that, compared with ten years ago, parents believed that many more <strong>of</strong> them are now aware<strong>of</strong> the broader benefits <strong>of</strong> girls' schooling, such as being able to read and write, earning incomes to helpthemselves and taking better care <strong>of</strong> their own families. In general, however, negative attitudes towardsgirls’ schooling, relative to that <strong>of</strong> boys, remain.6. CONCLUSIONSPoor households tend to have lower demand for schooling than richer households: whatever the benefits <strong>of</strong>schooling, the costs, for them, are more difficult to meet than is the case for richer households. Poor Statestend to allocate insufficient resources to provide sufficient schools <strong>of</strong> reasonable quality, so as to be able toaccommodate the entire primary age group. Both <strong>of</strong> these manifestations <strong>of</strong> poverty lead to the underenrolment<strong>of</strong> school-age children. The gendered outcomes <strong>of</strong> such under-enrolment are caused, however, byadverse cultural practice rather than by poverty itself. Such practice is found at the levels <strong>of</strong> the society,labour market, school and household, and comprises a powerful set <strong>of</strong> forces which impede the enrolment,persistence and performance, in school, <strong>of</strong> girls relative to boys.It follows that economic development, in the sense <strong>of</strong> achieving growth in national income per capita,is neither a necessary nor a sufficient condition for securing moves towards gender equity in schooling. Therelationship between poverty and low demand for schooling is such that merely increasing the supply <strong>of</strong>schooling <strong>of</strong> reasonable quality – which can be expected as development, defined as above, proceeds –would have little effect. For the development process per se to increase the effective demand for schooling,some particular distribution <strong>of</strong> the benefits <strong>of</strong> economic growth would also be implied. Householdperceptions that both the direct and the opportunity costs <strong>of</strong> schooling are high, which result in low levels <strong>of</strong>demand for schooling, are functions not only <strong>of</strong> the level <strong>of</strong> national per capita income, but also <strong>of</strong> itsdistribution.Even where economic growth proceeds, and where the benefits <strong>of</strong> that growth are widely spread –thereby allowing significant reductions in poverty at the household level – the relationship between it andchanges in cultural practice is extremely uncertain. We have shown that in Ethiopia and Guinea – both <strong>of</strong>which had low GERs and wide gender gaps in the early 1990s – the recent growth in enrolments has beenassociated with a widened gender gap, rather than the reverse. Moreover, more generally, the existence <strong>of</strong>poor countries with less than complete enrolment at primary level, yet with relatively low gender gaps, and<strong>of</strong> richer countries with higher enrolments, yet with larger gender gaps, both indicate that ‘cultural practice’has a causal relationship with gender equity in schooling which operates somewhat independently <strong>of</strong>poverty.This paper has documented something <strong>of</strong> the power and complexity <strong>of</strong> adverse cultural pratice in thesetwo African States. There is much that could be done to improve the availability <strong>of</strong> schooling to, and thedemand for education by, the poor in Ethiopia and Guinea. But we have shown that adverse cultural25
practice, in the domains <strong>of</strong> society, labour market, school and household, runs deep. Its removal – which isnecessary if gender equity in schooling is to be achieved – will require specific policy interventions, ratherthan merely waiting for the long sweep <strong>of</strong> history to do its work.26
NOTES123456789101112In some cases, the community is also an important locus, and grows in importance as more Statesdevolve responsibility for school provision to communities. But such circumstances are as yet aminority, and their addition to the framework shown in Figure 1 would provide little additional analyticinsight for present purposes.It is assumed here that, under the conditions specified, the incidence <strong>of</strong> benefits from primaryschooling would be independent <strong>of</strong> the income level <strong>of</strong> the parental household.These projections are calculated on the basis <strong>of</strong> the rates <strong>of</strong> change implied by the data in Table 2.SFA is defined as ‘the circumstance <strong>of</strong> having a school system in which all eligible children areenrolled in schools <strong>of</strong> at least minimally acceptable quality’. This would require gross enrolment ratios(GERs) <strong>of</strong> at least 100 per cent, unless repetition and over-age enrolment were significantly reduced(see Colclough with Lewin 1993:41).To the extent that there is over-age enrolment, caused by, for example, late enrolment and/or highlevels <strong>of</strong> repetition, significant gender gaps could remain even where GERs <strong>of</strong> 100 obtain. Thispossibility is illustrated by the case <strong>of</strong> Togo, shown in Figure 2. There will be an upper bound to thisphenomenon, however, and its incidence is reduced as school systems become more efficient.An example <strong>of</strong> such a case is Tanzania, where male and female enrolments have remained closelysimilar, even during many years <strong>of</strong> economic adversity and enrolment decline. The equal importance <strong>of</strong>schooling for girls and boys has been a strong theme <strong>of</strong> the ruling party since the 1970s, and is wellespoused by both rural and urban society. Not all <strong>of</strong> the effects <strong>of</strong> adverse cultural practice have beenremoved – but the country is closer to this goal than most in Africa (see Peasgood, et.al., 1997).Full presentations <strong>of</strong> the results <strong>of</strong> these surveys can be found in Rose et al. 1997 and Tembon et al.1997.The areas visited were East Gojjam and Jimma in Ethiopia and, in Guinea, Forest and Middle Guinea.Textbooks were provided free, or in return for a modest book rental charge.Earlier work in each country suggested that clothes for school in Ethiopia and school uniforms inGuinea were the highest direct cost items facing parents (USAID 1994; Sow 1994).In Ethiopia two earlier studies, which identified economic constraints as providing one <strong>of</strong> the mainreasons for not sending children to school, also found that the direct private costs <strong>of</strong> schooling weresimilar for girls and boys (USAID 1994; Yelfign et.al 1995). In Guinea, however, earlier work hadsuggested that the private direct costs <strong>of</strong> schooling were higher for boys than for girls, owing to theformer’s uniforms being more expensive.Each <strong>of</strong> these items were assigned a numeric value, and were totalled separately, for each <strong>of</strong> theindividuals included in the surveys. The data in Table 6 are simple averages <strong>of</strong> these values for each <strong>of</strong>the respondent categories shown.27
131415161718Earlier work which has examined gender differences in schooling in these two countries has alsosuggested that opportunity costs are higher for girls than boys. Girls have also been shown to beinvolved in a wider range <strong>of</strong> tasks than boys, many related to domestic work, which have contributed totheir absence, or to their arriving late at school. See Sow 1994; USAID 1994; Yelfign et.al 1995.For example, in one <strong>of</strong> the schools visited in Guinea, a girl aged nine had been withdrawn from schoolby her mother. When asked why this was so, the mother explained that she had no one else to help withthe numerous domestic chores she had to perform.In two earlier studies in Ethiopia (Anbesu and Junge 1988 and USAID 1994) the majority <strong>of</strong> pupilslived within 30 minutes’ walk <strong>of</strong> their schools, which, the authors argued, implied that enrolment wasinfluenced by school accessibility. These studies gave no clear indication that distance to school has agreater impact upon the enrolment <strong>of</strong> girls than <strong>of</strong> boys, although such an argument has been made inthe case <strong>of</strong> Guinea (Anderson-Levitt et.al. 1994).Some previous studies in the two countries have also acknowledged the impact <strong>of</strong> early marriage ongirls’ schooling. In Ethiopia, most <strong>of</strong> the studies mention that early marriage is an important reason forgirls not enrolling in, or dropping out <strong>of</strong>, school (Anbesu and Junge 1988; Asseffa 1991; USAID1995). The extent <strong>of</strong> the problem differs across the country with one study proposing that earlymarriage was not a problem in the district surveyed (Yelfign et al. 1996), and another suggesting thatparents believed that early marriage is a less important constraint than economic factors although it isseen as an important consideration in deciding between whether to send a boy or girl to school (USAID1994). Early marriage has also been highlighted as a constraint on girls’ schooling in Guinea(Kourouma 1991; Sow 1994). Sow reports that, in Guinea, where the lack <strong>of</strong> 'complete' schools resultsin higher grades being available at the expense <strong>of</strong> lower grades, the delay in the opportunity to enrolchildren discourages parents from sending their daughters to school because they would already havereached marriageable age before completing schooling.An earlier study in one region in Ethiopia also found that girls who started school at an early age werelikely to complete their schooling, whereas over-age children were more likely to drop-out, which, theauthors suggested, could be related to the onset <strong>of</strong> puberty (Anbesu and Junge 1988).Earlier studies have also confirmed these findings. In Ethiopia, parents perceived that their own returnsto investment in a son's education was greater than for daughters, because the son remained at homeafter marriage whereas the daughter was expected to move away so that "the investment in hereducation is lost to her family" (USAID 1994). Various studies have shown that societal expectations<strong>of</strong> gender roles result in negative parental attitudes towards sending girls to school (Long 1990 andKourouma 1991 in Guinea; Asseffa 1991 and Yelfign et al. 1996 in Ethiopia). It has been suggestedthat one reason for such attitudes is parental ignorance about education and that parents are more likely28
to send their children to school if they themselves are literate (USAID 1994; UNICEF 1995). A studyin one district <strong>of</strong> Ethiopia further suggested that mothers' education was positively related to girls’enrolment in school (Yelfign et al. 1996).29
REFERENCESAnbesu Biazen and Junge, B., 1988, Problems in Primary School Participation and Performance inBahir Dar Awraja, Addis Ababa: Ministry <strong>of</strong> Education and UNICEFAnderson-Levitt, K., Bloch, M., and Soumaré, A., 1994, Inside Classrooms in Guinea: Girls’Experiences, Washington DC: World BankAsseffa Beyene, 1991, Female Participation and Performance in Rural Schools in Ethiopia, AddisAbaba: ICDR, MOEBrock, C., and Cammish, N., 1997, ‘Factors Affecting Female Participation in Education in SevenDeveloping Countries’, Education Research Serial No. 9, DFID, LondonColclough, C. with Lewin, K., 1993, Educating All the Children: Strategies for Primary Schooling inthe South, Oxford: Clarendon PressKourouma, P., 1991, Étude portant sur les aspects socio-culturels et socio-économiques de la lascolarisation des filles au niveau du primaire: cas de la Guinée, Conakry: Ministère de l'EducationNationale, Secrétariat d'Etat à l'Enseignement Pré-UniversitaireKnodel, J. and Jones, G., 1996, ‘Post-Cairo Population Policy: Does Promoting Girls’ Schooling Miss theMark?’, Population Development Review, 22(4):683-702Long, L., 1990, Study <strong>of</strong> Girls’ Access to Primary Schooling in Guinea, Conakry: USAIDMEPU-FP (SSP), various years, Enseignement Primaire les Annuaire Statistique, Conakry: MEPU-FPMEPU-FP, 1989, Déclaration de Politique Educative, Conakry: MEPU-FPMinistry <strong>of</strong> Education, 1996, Education Statistics Annual Abstract, 1987 EC (1994/95), Addis Ababa:Education Management Information Systems, Ministry <strong>of</strong> EducationMinistry <strong>of</strong> Education, 1995, Education Statistics Annual Abstract, 1986 EC (1993/94), Addis Ababa:Education Management Information Systems, Ministry <strong>of</strong> EducationPeasgood, T., Bendera, S., Abrahams, N., and Kisanga, M., 1997, ‘Gender and Primary Schooling inTanzania’, IDS Research Report No 34, Brighton: IDS.Rose, P. and Al-Samarrai, S., 1997, 'Household constraints on schooling by gender: empirical evidence fromEthiopia', IDS Working Paper No 56, Brighton:IDSRose, P., Getachew Yoseph, Asmaru Berihun and Tegegn Nuresu, 1997, 'Gender and primary schooling inEthiopia', IDS Research Report No 31, Brighton:IDSSow, A., 1994, Enquête sur la Scolarisation des Filles en Milieu Rural: Rapport de synthèse, Conakry:Ministère de l'Enseignement Pré-Universitaire et de la Formation Pr<strong>of</strong>essionnelle, République deGuinéeStromquist, N., 1997, ‘Gender sensitive educational strategies and their implementation’, InternationalJournal <strong>of</strong> Educational Development, Vol 17, No 2, pp205-214Tembon, M., Diallo, I., Barry, D. and Barry, A., 1997, 'Gender and primary schooling in Guinea', IDSResearch Report No 32, Brighton:IDS30
Transitional Government <strong>of</strong> Ethiopia, 1994, Education and Training Policy, Addis Ababa: TGETransitional Government <strong>of</strong> Ethiopia, 1993, National Policy on Ethiopian Women, Addis Ababa: TGETransitional Government <strong>of</strong> Ethiopia, 1993, Population Policy, Addis Ababa: TGETransitional Government <strong>of</strong> Ethiopia, 1993, Social Policy, Addis Ababa: TGEUNDP, 1996, Human Development Report, New York: Oxford University PressUNESCO, 1996, Statistical Yearbook, Paris: UNESCOUNESCO 1998, World Education Report 1998, Paris: UNESCOUSAID, 1994, ’The demand for primary schooling in rural Ethiopia. A research study’, mimeo, AddisAbaba: USAIDWorld Bank, 1996, ‘Beyond poverty: How supply factors influence girls’ education in Guinea: Issues andstrategies’, Report No 14488-GUI, Washington DC: World BankWorld Bank, 1995, Developing Girls’ Education in Guinea. Issues and Policies World Bank Populationand Human Resources Division, Washington DC: World BankYelfign Worku et al., Primary School Female Participation and Performance in Cheha District, AddisAbaba: Ministry <strong>of</strong> Education31


