Backdating Executive Option Grants - Nanyang Technological ...
Backdating Executive Option Grants - Nanyang Technological ...
Backdating Executive Option Grants - Nanyang Technological ...
Create successful ePaper yourself
Turn your PDF publications into a flip-book with our unique Google optimized e-Paper software.
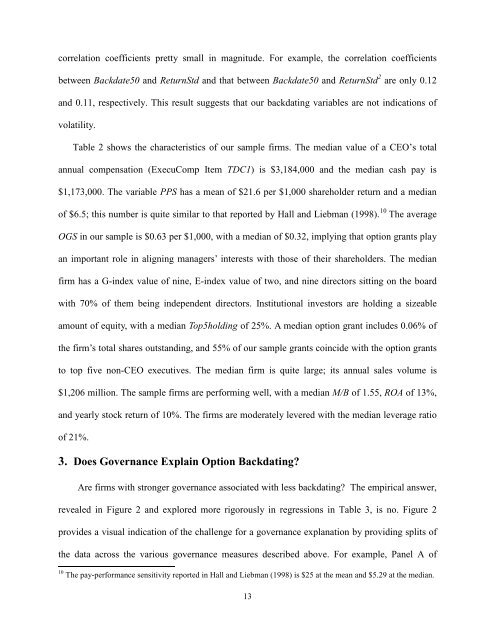
correlation coefficients pretty small in magnitude. For example, the correlation coefficientsbetween Backdate50 and ReturnStd and that between Backdate50 and ReturnStd 2 are only 0.12and 0.11, respectively. This result suggests that our backdating variables are not indications ofvolatility.Table 2 shows the characteristics of our sample firms. The median value of a CEO’s totalannual compensation (ExecuComp Item TDC1) is $3,184,000 and the median cash pay is$1,173,000. The variable PPS has a mean of $21.6 per $1,000 shareholder return and a medianof $6.5; this number is quite similar to that reported by Hall and Liebman (1998). 10 The averageOGS in our sample is $0.63 per $1,000, with a median of $0.32, implying that option grants playan important role in aligning managers’ interests with those of their shareholders. The medianfirm has a G-index value of nine, E-index value of two, and nine directors sitting on the boardwith 70% of them being independent directors. Institutional investors are holding a sizeableamount of equity, with a median Top5holding of 25%. A median option grant includes 0.06% ofthe firm’s total shares outstanding, and 55% of our sample grants coincide with the option grantsto top five non-CEO executives. The median firm is quite large; its annual sales volume is$1,206 million. The sample firms are performing well, with a median M/B of 1.55, ROA of 13%,and yearly stock return of 10%. The firms are moderately levered with the median leverage ratioof 21%.3. Does Governance Explain <strong>Option</strong> <strong>Backdating</strong>?Are firms with stronger governance associated with less backdating? The empirical answer,revealed in Figure 2 and explored more rigorously in regressions in Table 3, is no. Figure 2provides a visual indication of the challenge for a governance explanation by providing splits ofthe data across the various governance measures described above. For example, Panel A of10 The pay-performance sensitivity reported in Hall and Liebman (1998) is $25 at the mean and $5.29 at the median.13


