End-Tidal CO2 Measurement with CO2100C. - Biopac
End-Tidal CO2 Measurement with CO2100C. - Biopac
End-Tidal CO2 Measurement with CO2100C. - Biopac

Create successful ePaper yourself
Turn your PDF publications into a flip-book with our unique Google optimized e-Paper software.
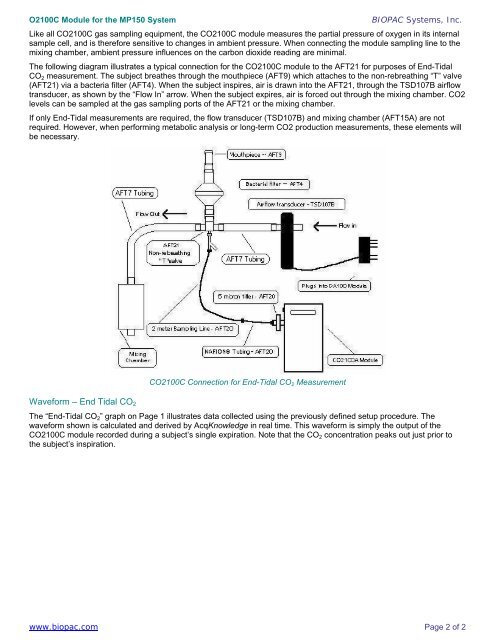
O2100C Module for the MP150 SystemBIOPAC Systems, Inc.Like all <strong>CO2</strong>100C gas sampling equipment, the <strong>CO2</strong>100C module measures the partial pressure of oxygen in its internalsample cell, and is therefore sensitive to changes in ambient pressure. When connecting the module sampling line to themixing chamber, ambient pressure influences on the carbon dioxide reading are minimal.The following diagram illustrates a typical connection for the <strong>CO2</strong>100C module to the AFT21 for purposes of <strong>End</strong>-<strong>Tidal</strong>CO 2 measurement. The subject breathes through the mouthpiece (AFT9) which attaches to the non-rebreathing “T” valve(AFT21) via a bacteria filter (AFT4). When the subject inspires, air is drawn into the AFT21, through the TSD107B airflowtransducer, as shown by the “Flow In” arrow. When the subject expires, air is forced out through the mixing chamber. <strong>CO2</strong>levels can be sampled at the gas sampling ports of the AFT21 or the mixing chamber.If only <strong>End</strong>-<strong>Tidal</strong> measurements are required, the flow transducer (TSD107B) and mixing chamber (AFT15A) are notrequired. However, when performing metabolic analysis or long-term <strong>CO2</strong> production measurements, these elements willbe necessary.<strong>CO2</strong>100C Connection for <strong>End</strong>-<strong>Tidal</strong> CO 2 <strong>Measurement</strong>Waveform – <strong>End</strong> <strong>Tidal</strong> CO 2The “<strong>End</strong>-<strong>Tidal</strong> CO 2 ” graph on Page 1 illustrates data collected using the previously defined setup procedure. Thewaveform shown is calculated and derived by AcqKnowledge in real time. This waveform is simply the output of the<strong>CO2</strong>100C module recorded during a subject’s single expiration. Note that the CO 2 concentration peaks out just prior tothe subject’s inspiration.www.biopac.comPage 2 of 2