Periodic HartreeâFock linear combination of crystalline orbitals ...
Periodic HartreeâFock linear combination of crystalline orbitals ...
Periodic HartreeâFock linear combination of crystalline orbitals ...

You also want an ePaper? Increase the reach of your titles
YUMPU automatically turns print PDFs into web optimized ePapers that Google loves.
J. Phys.: Condens. Matter 12 (2000) 7205–7222. Printed in the UK PII: S0953-8984(00)13909-8<strong>Periodic</strong> Hartree–Fock <strong>linear</strong> <strong>combination</strong> <strong>of</strong> <strong>crystalline</strong><strong>orbitals</strong> calculation <strong>of</strong> the structure, equation <strong>of</strong> state andelastic properties <strong>of</strong> titanium diborideC A Perottoni†, A S Pereira†‡ and JAHdaJornada§‖† Instituto de Física, Universidade Federal do Rio Grande do Sul, 91501-970,Porto Alegre—RS, Brazil‡ Escola de Engenharia, Universidade Federal do Rio Grande do Sul, 91501-970,Porto Alegre—RS, Brazil§ Inmetro, Instituto Nacional de Metrologia, Normaliza˜cao e Qualidade Industrial, CampusAvancado de Xerém, Rod. Washington Luiz, km 102.5, BR 040, Duque de Caxias—RJ, BrazilReceived 15 May 2000Abstract. We have performed all-electron ab initio calculations for TiB 2 in the athermal limitusing the CRYSTAL95 code. The lattice parameters <strong>of</strong> the AlB 2 -type structure were optimizedas a function <strong>of</strong> pressure. The fitting <strong>of</strong> a Murnaghan equation <strong>of</strong> state resulted in values <strong>of</strong>B 0 = 292±1 GPa and B 0 ′ = 3.34±0.03 for the bulk modulus and its first derivative at zero pressure.The values for the <strong>linear</strong> bulk modulus along the a-axis and the c-axis are B a0 = 1031 ± 3GPa(B a0 ′ = 10.6 ± 0.2) and B c0 = 675 ± 3GPa(B c0 ′ = 8.8 ± 0.2), respectively. All five independentelastic constants were calculated, and the analysis <strong>of</strong> the elastic behaviour <strong>of</strong> titanium diborideindicates that this compound is more isotropic than one would suppose from its crystal structure.The discussion on the nature <strong>of</strong> the chemical bonds and the electronic charge transfer in titaniumdiboride gives some insight into its mechanical properties, such as its high hardness, despite anapparent layered structure. In this sense, the analysis <strong>of</strong> the charge-density distribution shows a nonnegligibleinteraction between graphite-like boron planes along the c-axis, which increases withpressure, and suggests a three-dimensional picture for the TiB 2 structure, instead <strong>of</strong> the traditionalplanar description.1. IntroductionSince the advent <strong>of</strong> quantum mechanics in the first decades <strong>of</strong> this century, one <strong>of</strong> the biggestchallenges in physics has been the development <strong>of</strong> strategies to overcome the difficultiesarising in the calculation <strong>of</strong> the properties <strong>of</strong> many-body systems. Nowadays, the availability<strong>of</strong> sophisticated codes and powerful computers has made it entirely possible to undertakeab initio computer experiments. Among the many fields in condensed matter physics wherethis approach can be exploited, we have particular interest in the study <strong>of</strong> the pressure behaviour<strong>of</strong> very hard materials. Usually, extremely high pressures are needed for the study <strong>of</strong> suchmaterials in order to induce some significant change in their structures. At such high staticpressures, the production <strong>of</strong> hydrostatic conditions is not always possible and the samplesare necessarily very small. This imposes many restrictions on the kind and precision <strong>of</strong> theanalytical techniques which can be used to extract information from the sample under pressure.‖ On leave from: Instituto de Física, Universidade Federal do Rio Grande do Sul, 91501-970, Porto Alegre—RS, Brazil.0953-8984/00/327205+18$30.00 © 2000 IOP Publishing Ltd 7205
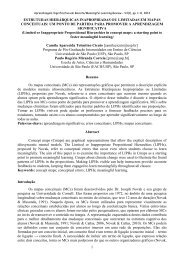
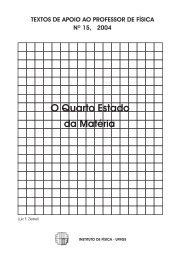
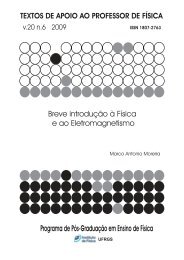
<strong>Periodic</strong> HF-LCCO calculations for titanium diboride 7207Figure 1. TiB 2 crystal structure. Large and small spheres represent titanium and boron atoms,respectively.understanding <strong>of</strong> the effect <strong>of</strong> the interaction between boron planes on the elastic properties<strong>of</strong> TiB 2 .In this context, in this paper we provide a set <strong>of</strong> physical properties for titanium diboride,calculated from first principles within the Hartree–Fock mean-field approximation. Ourfindings are compared with other theoretical and experimental results, in order to assess therelative merits <strong>of</strong> our approach. The main intent <strong>of</strong> this work is to provide a coherent picture forthe mechanical and bonding properties <strong>of</strong> TiB 2 , based on the analysis <strong>of</strong> its elastic behaviourand electronic charge-density distribution.This paper is organized as follows. In section 2 we present the computational procedureand the basis sets used to undertake the calculations. Section 3 presents the results obtained forthe equilibrium geometry and equation <strong>of</strong> state for TiB 2 at T = 0. In section 4 we deal withthe calculation <strong>of</strong> the single-crystal elastic constants and the Hill averages <strong>of</strong> the elastic modulifor an isotropic, homogeneous poly<strong>crystalline</strong> aggregate <strong>of</strong> titanium diboride. The resultsobtained are discussed and compared with other theoretical and experimental results availablein the literature. Electronic charge-distribution maps for TiB 2 are shown in section 5, where wediscuss some aspects regarding chemical bonding and its influence on the mechanical properties<strong>of</strong> titanium diboride. Finally, in section 6 we present the main conclusions <strong>of</strong> this work.2. Computational detailsThe all-electron ab initio periodic Hartree–Fock calculations were performed with theCRYSTAL95 code [15, 16]. The <strong>crystalline</strong> <strong>orbitals</strong> used as the basis for the wavefunctionexpansion were constructed from a <strong>linear</strong> <strong>combination</strong> <strong>of</strong> atom-centred Gaussian <strong>orbitals</strong> (HF-LCCO approximation). An 86-4113G basis set was chosen for titanium. The initial exponents
7208 C A Perottoni et aland coefficients for this basis set were taken from Saunders [17]. The exponents and contractioncoefficients <strong>of</strong> the valence <strong>orbitals</strong> were further optimized by minimizing the total energy for<strong>crystalline</strong> TiB 2 †. The optimal exponent <strong>of</strong> the outermost titanium 5sp orbital could not befound by minimizing the total energy <strong>of</strong> the <strong>crystalline</strong> compound, as the energy decreasesmonotonically with the sp exponent until a numerical catastrophe occurs [15]. Consequently,the adopted value represents a compromise between numerical convergence, minimal totalenergy and the computational resources needed to undertake the calculations. The resultingtitanium basis set used in this work is given in table 1. For boron, the basis set used wasthe standard 6-21G, with the external sp exponent set to 0.19 [18]. All the calculationswere performed in the athermal limit. To ensure convergence and high numerical accuracy,very tight tolerances were employed in the evaluation <strong>of</strong> the infinite Coulomb and exchangeseries: 10 −8 for the exchange overlap, Coulomb overlap, Coulomb penetration and the firstexchange pseudo-overlap; and 10 −14 for the second exchange pseudo-overlap tolerance [15].The Fock matrix has been diagonalized at 133 k-points within the irreducible Brillouin zone,corresponding to a shrinkage factor <strong>of</strong> 12 in the Monkhorst net [19]. Owing to the metalliccharacter <strong>of</strong> TiB 2 , a dense Gilat net [20] was defined with a total <strong>of</strong> 793 k-points in reciprocal† The valence exponents and contraction coefficients were optimized by sequential line minimization, with a Unixscript shell developed by M Towler (see http://www.tcm.phy.cam.ac.uk/˜mdt26/).Table 1. The titanium basis set. Exponents (in au) and coefficients <strong>of</strong> the s, p and d Gaussianfunctions.CoefficientsType Exponent s p ds 228000.0000 0.00022832450.0000 0.0019296888.6000 0.0111001802.4000 0.049990543.2000 0.170100187.4400 0.36916073.1900 0.40270030.4500 0.144500sp 553.4000 −0.005460 0.00853132.1800 −0.070400 0.0602143.6100 −0.117700 0.2133017.0200 0.245100 0.387107.2600 0.670800 0.402102.3760 0.286000 0.23900sp 28.3000 0.002700 −0.0271011.2400 −0.151500 −0.076704.6560 −0.744000 0.166501.8650 1.032000 1.31400sp 0.7138 1.000000 1.00000sp 0.1500 1.000000 1.00000d 6.0511 0.11611.4468 0.34290.3267 0.5250
<strong>Periodic</strong> HF-LCCO calculations for titanium diboride 7209space, corresponding to a shrinkage factor <strong>of</strong> 24. In order to reduce the numerical noise, allthe calculations were performed with the same set <strong>of</strong> indexed bielectronic integrals selectedfrom a reference geometry [15]. To improve the convergence, the Fock matrix (Finew )attheself-consistent-field cycle i was made equal toFi new = (1 − p)F i + pF i−1 (1)where p is a mixing parameter equal to 0.3 [15]. In general, some 20 to 30 SCF cycles weresufficient to achieve convergence in total energy to within 10 −6 to 10 −8 Hartree per primitivecell. A further increase in the cut-<strong>of</strong>f for the evaluation <strong>of</strong> bielectronic integrals as well as inthe shrinkage factors that define the Monkhorst and Gilat nets resulted in changes in the totalenergy smaller than 1 mHartree.3. TiB 2 equilibrium geometry and equation <strong>of</strong> stateThe total HF energy <strong>of</strong> TiB 2 was minimized as a function <strong>of</strong> the hexagonal lattice parametersusing the conjugate-gradient algorithm <strong>of</strong> Polak and Ribiere [21]. No constraints were imposedon the c/a ratio, i.e., both lattice parameters were optimized simultaneously. As can be seen intable 2, the resulting lattice parameters a and c are in excellent agreement with the experimentalvalues, differing from those <strong>of</strong> Post et al [22] by −0.1% and 0.3%, respectively. No correctionwas made to account for the temperature effect on the lattice parameters, which should bealmost negligible in any case.Table 2. Lattice parameters, bulk moduli (B 0 ) and pressure derivatives (B 0 ′ ) <strong>of</strong> titanium diborideat zero pressure.Reference a 0 (Å) c 0 (Å) V 0 (Å 3 ) B 0 (GPa) B ′ 0 B iso (GPa)Experimental aSilver and Kushida [24] 3.028 3.228 25.6Post et al [22] 3.030 3.230 25.7Gilman and Roberts [25] 399 436Spoor et al [26] 240 247Manghnani et al [27] 239 240Wright b 194 239Wright c 237 253TheoreticalThis work 3.027 3.240 25.7 292 3.34This work d 299 306Van Camp and van Doren e 3.023 3.166 25.1 270 273Van Camp and van Doren f 2.993 3.147 24.4 260 260Tian and Wang [6] 2.895 3.086 22.4 377a Bulk modulus calculated from measured single-crystal elastic constants.b Bulk modulus calculated from the Voigt estimate <strong>of</strong> the single-crystal elastic constants [28].c The same as above, but in the Reuss approximation.d As calculated from the elastic constants given in table 3, later.e Density functional theory (DFT) with ab initio norm-conserving pseudopotentials in the localdensity approximation (LDA) for the exchange–correlation contribution to the energy [13].f The same as above, but in the generalized gradient approximation (GGA).In order to provide some insight into the pressure behaviour <strong>of</strong> TiB 2 , the HF energy <strong>of</strong>titanium diboride was minimized as a function <strong>of</strong> the c/a ratio for selected values <strong>of</strong> theprimitive-cell volume. The dependence <strong>of</strong> the HF energy (E) on the volume <strong>of</strong> the TiB 2
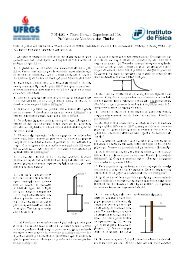
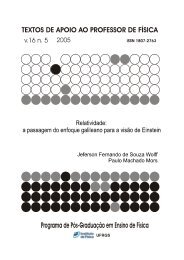
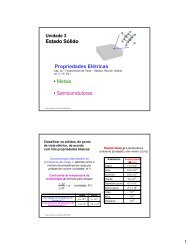
7210 C A Perottoni et alprimitive cell can be seen in figure 2(a). The solid curve in figure 2(a) represents the fittedMurnaghan equation <strong>of</strong> state:E = E 0 + B 0B0′ (V − V 0 ) −[ ( ) ]B 0 V 0 V 1−B ′0− 1B0 ′ (1 − B′ 0 ) V 0where V is the primitive-cell volume, B is the bulk modulus and B ′ its first pressure derivative.The zero index means the values at zero pressure. The fitting yielded B 0 = 292 ± 1GPa,B ′ 0 = 3.34 ± 0.03 and V 0 = 25.8 Å 3 . The quoted uncertainties refer to the standarddeviation <strong>of</strong> the fitted parameters. These values are compared in table 2 with those derivedfrom single-crystal elastic constants and other theoretical estimates taken from the literature.(2)300250(a)HF energy (GPa Å 3 )20015010050018 20 22 24 26 28 30 32Primitive cell volume (Å 3 )1.2(b)1.11.0V/V 00.90.80.7-60 -40 -20 0 20 40 60 80 100 120 140Pressure (GPa)Figure 2. (a) TiB 2 HF energy as a function <strong>of</strong> the primitive-cell volume. The solid curve is theresulting fit <strong>of</strong> the Murnaghan equation <strong>of</strong> state (2). (b) The pressure dependence <strong>of</strong> the TiB 2primitive-cell volume. The solid curve represents the Murnaghan equation (3) with the parameterstaken from the fitting in (a).
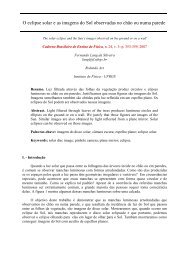
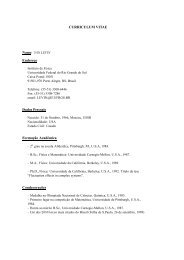
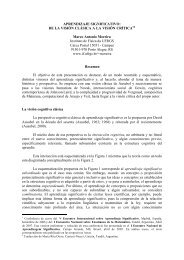
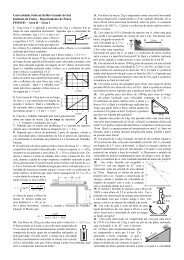
<strong>Periodic</strong> HF-LCCO calculations for titanium diboride 7211The primitive-cell equilibrium volume at zero pressure agrees within 0.1 Å 3 with the valueobtained from the unconstrained optimization <strong>of</strong> the TiB 2 structure (see table 2), revealing theconsistency <strong>of</strong> our calculations and the adequacy <strong>of</strong> the Murnaghan equation <strong>of</strong> state.From equation (2), the pressure acting on the system as a function <strong>of</strong> the primitive-cellvolume can be obtained through the thermodynamic relationship[P(V) =− dEdV = B (V0 ) ] B ′00 − 1B0′ . (3)VThe resulting pressure dependence <strong>of</strong> the TiB 2 primitive-cell volume is shown in figure 2(b).With the pressure calculated according to equation (3) and the optimized hexagonal c/aratio at each volume, we obtained the pressure dependence <strong>of</strong> the titanium diboride latticeparameters, as shown in figure 3. The <strong>linear</strong> bulk modulus at zero pressure B a0 and B c0 ,i.e., the inverse <strong>linear</strong> compressibility along the crystallographic axis, under isotropic stress,and their pressure derivatives, were obtained by fitting the Murnaghan equation (3) to thepoints in figure 3(a). Proceeding in this way, the values obtained were B a0 = 1031 ± 3GPa(Ba0 ′ = 10.6 ± 0.2) and B c0 = 675 ± 3GPa(Bc0 ′ = 8.8 ± 0.2). Both TiB 2 <strong>linear</strong> bulk modulirapidly increase with pressure, despite B c always being smaller than B a in the pressure rangeup to 115 GPa. The extremely high <strong>linear</strong> bulk modulus parallel to the boron planes has amagnitude comparable to that <strong>of</strong> the carbon planes in graphite, namely B a0 = 1250 GPa (withfixed Ba0 ′ = 1) [23]. Indeed, the TiB 2 <strong>linear</strong> bulk modulus B a will become even greater thanthat <strong>of</strong> a hypothetical graphite structure at pressures above 23 GPa (single-<strong>crystalline</strong> samples<strong>of</strong> graphite are stable just up to 14 GPa [23]). The TiB 2 <strong>linear</strong> bulk modulus B c0 is one order <strong>of</strong>magnitude higher than that <strong>of</strong> graphite, a true layered structure. In section 5 it will be shownthat the charge-density analysis for TiB 2 can shed some light on these interesting results.The equilibrium lattice parameters resulting from the fitting <strong>of</strong> the Murnaghan equation(3) to the points in figure 3(a), a 0 = 3.019 Å and c 0 = 3.257 Å, differ by −0.26% and 0.52%,respectively, from the values obtained by unconstrained structure optimization, as quoted intable 2.4. Elastic propertiesThe five independent elastic constants <strong>of</strong> titanium diboride were calculated by imposing a set <strong>of</strong>different deformations on the hexagonal lattice and following the dependence <strong>of</strong> the primitivecellenergy on the applied strain. The lattice deformations employed here were those suggestedby Fast, Wills, Johansson and Erikson [29]. They were chosen in such a way that the secondorderterm in the expansion <strong>of</strong> the strain energy as a function <strong>of</strong> the adimensional deformationparameter ε could be related to a particularly simple <strong>combination</strong> <strong>of</strong> the elastic constants. Theatomic coordinates were not optimized each time the lattice was distorted. This should notaffect the result for c 11 + c 12 and c 33 , as the site symmetries and the Bravais lattice remainunchanged for the particular lattice deformation involved in their estimate. On the other hand,the effect <strong>of</strong> the residual inner stress on the other elastic constants should not be greater thanabout 10% <strong>of</strong> the calculated values, as can be inferred from previous results in the literature (see,e.g., the results for MgF 2 [30]). The dependence <strong>of</strong> the strain energy on ε is shown in figure 4,for the five distinct lattice deformations. To reduce the influence <strong>of</strong> high-order terms in theexpansion <strong>of</strong> the strain energy, the maximum deformation amounts to ±2% <strong>of</strong> the equilibriumlattice parameters. Third-order polynomials were fitted to the data in figure 4, from whichthe elastic constants <strong>of</strong> TiB 2 were calculated according to equations (6) to (15) <strong>of</strong> reference[29]. The effect <strong>of</strong> introducing high-order terms in the polynomial fitting was negligible. Theresults are given in table 3. A further reduction <strong>of</strong> the maximum lattice deformation did not
7212 C A Perottoni et al3.6(a)3.4Lattice parameter (Å)3.23.02.82.6-60 -40 -20 0 20 40 60 80 100 120 140Pressure (GPa)1.121.11(b)1.10c/a ratio1.091.081.071.061.051.04-60 -40 -20 0 20 40 60 80 100 120 140Pressure (GPa)Figure 3. (a) The pressure dependence <strong>of</strong> the TiB 2 lattice parameters a (full circles) and c (opencircles). (b) The c/a ratio as a function <strong>of</strong> pressure. The solid curves in (a) show the fitting <strong>of</strong> theMurnaghan equation (3) for the lattice parameters.result in elastic constants significantly different from those quoted in table 3. The deviationfrom zero deformation <strong>of</strong> the minimum in the energy curve for the calculation <strong>of</strong> c 33 , seen infigure 4, just means that the algorithm used to search for the structure <strong>of</strong> minimum energy wasnot exhaustively iterated. In any case, the correction for the lattice parameters, owing to thisobserved deviation, should amount to only about 0.5%.Among the five elastic constants <strong>of</strong> TiB 2 , the value <strong>of</strong> c 44 was particularly difficult to obtain,since its calculation involves a triclinic deformation <strong>of</strong> the hexagonal unit cell, increasing bya factor <strong>of</strong> four the number <strong>of</strong> points needed to interpolate the wavefunction in the irreducibleBrillouin zone (keeping a shrinkage factor <strong>of</strong> 12 in the Monkhorst net).Despite the large discrepancies between the reported experimental single-crystal elasticconstants for TiB 2 , the analysis <strong>of</strong> the data in table 3 can reveal some trends in our results.
<strong>Periodic</strong> HF-LCCO calculations for titanium diboride 72130.00240.00200.00160.00120.00080.00040.0000cc 11+c 12 11+c 12c11 11 +c +c12 120.00160.00120.0008Strain energy (Hartree)0.00040.00000.00400.00320.00240.00160.00080.0000c 11-cc 1211-c 12c 11 -c -c12 12c 13 13c 11 +c 12 +2c 13 +c 33 /20.00120.00080.00040.0000c 33 33c 33 /20.00120.00080.0004c 442c 44440.0000-0.03 -0.02 -0.01 0.00 0.01 0.02 0.03Deformation parameter εFigure 4. The dependence <strong>of</strong> the strain energy on the adimensional lattice deformation parameterε. The inset in each panel shows the specific <strong>combination</strong> <strong>of</strong> elastic constants in the second-orderterm <strong>of</strong> the E(ε) expansion, from which the elastic constants were obtained [29].There is a good agreement between our values for c 13 and c 33 and those calculated by vanCamp and van Doren [13]. On the other hand, the value obtained by them for c 11 + c 12 isbetween 15 and 20% (depending on the particular functional used for the exchange–correlationcontribution to energy) smaller than our result. Our estimates for the elastic constants c 13 and
7214 C A Perottoni et alTable 3. Elastic constants <strong>of</strong> titanium diboride (GPa).Reference c 11 c 12 c 13 c 33 c 44ExperimentalGilman and Roberts [25] 690 410 320 440 250Spoor et al [26] 660 48 93 432 260Manghnani et al a 588 72 84 503 238Wright b 672 40 125 224 232Wright c 711 17 118 349 240TheoreticalThis work 786 127 87 583 271Van Camp and van Doren d 777 e 83 568Van Camp and van Doren f 730 78 572a TiB 2 poly<strong>crystalline</strong> elastic stiffnesses [27].b Voigt estimates <strong>of</strong> the single-crystal elastic constants calculated from the reported values <strong>of</strong>Manghnani, Fisher, Li and Grady [27] after correction for texture effects [28].c The same as above, but using the Reuss approximation.d DFT with ab initio norm-conserving pseudopotentials in the local density approximation (LDA)for the exchange–correlation contribution to the energy [13].e c 11 + c 12 .f The same as in note d, but in the generalized gradient approximation (GGA).c 44 <strong>of</strong> TiB 2 compare well with the values measured at room conditions by Spoor et al [26]. Theagreement is worse for c 11 , c 33 and c 12 . However, one should note the great variance among theexperimental results, mainly for c 12 . The DFT value for c 11 + c 12 is closer to the experimentalresults than the corresponding HF estimate <strong>of</strong> this work. However, both HF and DFT (in theLDA and GGA approximation) approaches lead to a value for c 33 somewhat greater than theexperimental one. This tendency <strong>of</strong> HF calculations to overestimate some elastic constantswas already pointed out by several authors (see, e.g., references [30–32]).From the general relationship between elastic compliances (s ij ) and bulk compressibility[33]1B = s 11 + s 22 + s 33 +2(s 12 + s 23 + s 31 ) (4)one obtains the bulk modulus at zero pressure for a single crystal with hexagonal symmetry(without constraints on the c/a dependence on lattice strain) as given byB 0 = c 33(c 11 + c 12 ) − 2c 2 13c 11 + c 12 − 4c 13 +2c 33. (5)With the elastic constants from table 3, the above equation yields B 0 = 299 GPa, only 2.4%higher than the value obtained from the fitting <strong>of</strong> the Murnaghan equation <strong>of</strong> state to the pointsin figure 2(a). This reveals that the whole set <strong>of</strong> calculated elastic constants is consistent withthe bulk modulus obtained through the analysis <strong>of</strong> the volume dependence <strong>of</strong> the primitive-cellenergy, as done in section 3.The elastic anisotropy <strong>of</strong> a TiB 2 single crystal can be best appreciated by plotting atridimensional representation <strong>of</strong> the directional dependence <strong>of</strong> Young and <strong>linear</strong> bulk moduli[33] (figure 5). The surface <strong>of</strong> revolution representing the directional dependence <strong>of</strong> the TiB 2bulk modulus, calculated from the set <strong>of</strong> elastic constants given in table 3, intercepts the a-axis at 1043 GPa and the c-axis at 700 GPa, in good agreement with the B a0 - and B c0 -valuesdetermined from the pressure dependence <strong>of</strong> the lattice parameters (section 3).The Young modulus surface <strong>of</strong> revolution intercepts the c-axis at 566 GPa and the a-axisat 756 GPa. In other words, the Young modulus parallel to the basal plane is about 30% higher
<strong>Periodic</strong> HF-LCCO calculations for titanium diboride 7215Figure 5. The directional dependency <strong>of</strong> the bulk (above) and Young (below) moduli <strong>of</strong> titaniumdiboride. The axis scales are given in GPa.than the one parallel to the c-axis. This plot can be directly compared to the experimentalresults given by Spoor et al [26].The effect <strong>of</strong> the anisotropic <strong>linear</strong> compressibility on the overall compressibility <strong>of</strong>titanium diboride can also be evaluated by calculating the isotropic bulk modulus (B iso ), i.e.,the bulk modulus obtained under the assumption that the c/a ratio remains unchanged whenthe lattice is subjected to an isotropic stress. B iso can be written in terms <strong>of</strong> the elastic
7216 C A Perottoni et alconstants as [29]B iso = 2 (c 11 + c 12 +2c 13 + c )33. (6)92With our set <strong>of</strong> elastic constants, the above expression yields B iso = 306 GPa, approximately2.3% above the value obtained from equation (5) when relaxing the c/a ratio. The c/a ratiodecreases by only about 2% from ambient pressure to 115 GPa (see figure 3(b)).There is a substantial amount <strong>of</strong> experimental work devoted to the determination <strong>of</strong> theelastic moduli <strong>of</strong> poly<strong>crystalline</strong> titanium diboride. To extend the comparison <strong>of</strong> our resultswith experiment, the calculated single-crystal elastic constants were used to estimate theaveraged elastic moduli <strong>of</strong> an isotropic poly<strong>crystalline</strong> aggregate <strong>of</strong> titanium diboride. Intable 4 we report the Hill averages [35] for the Young, shear and bulk moduli, as well asthe Poisson ratio for TiB 2 . The Hill averages represent the mean value between the Voigtand Reuss bounds on the elastic moduli. Our results are systematically higher than thosemeasured by Wiley, Manning and Hunter, after correction for porosity [26], a consequence <strong>of</strong>the overestimation <strong>of</strong> c 11 + c 12 and c 33 . The Poisson ratio agrees well with experiment.Table 4. Comparison between measured TiB 2 poly<strong>crystalline</strong> elastic moduli and Hill averagesderived from elastic constants. Young (E), shear (G) and bulk (B) moduli are all given in GPa.The Poisson ratio (σ ) is adimensional.Reference E G B σExperimental results with poly<strong>crystalline</strong> samplesAbbate, Frankel and Dandekar [37] 549 247 238 0.114Grady [38] 522 249 193 0.049Gust, Holt and Royce [36] 541 237 251 0.141Wiley, Manning and Hunter a 505 228 214 0.109Wiley, Manning and Hunter b 568 258 237 0.101Hill averages from single-crystal elastic constantsThis work 670 296 303 0.132Gilman and Roberts [25] 447 169 417 0.321Spoor et al [26] 579 262 244 0.105Wright c 539 240 238 0.122a Sample with 6% porosity [34].b The same as above, after correction for porosity [26].c Calculated from the single-crystal elastic constants estimated from the poly<strong>crystalline</strong> elasticstiffnesses <strong>of</strong> titanium diboride after correction for texture [28].One possible measure <strong>of</strong> the TiB 2 elastic anisotropy is given by the ‘percentageanisotropies’ in the compressibility and shear [26]. These quantities, defined asandA ∗ comp = B V − B RB V + B R(7)A ∗ shear = G V − G R(8)G V + G Rrange from zero (perfect elastic isotropy) to 100%, the maximum anisotropy. In the aboveexpressions, B and G are the bulk and shear moduli, as estimated from the Voigt (subscript V )and Reuss (subscript R) approximations. The ‘percentage anisotropies’ for titanium diboride,as derived from our set <strong>of</strong> calculated elastic constants, are given in table 5, where they arecompared to the values calculated from the single-crystal elastic constants measured by Gilman
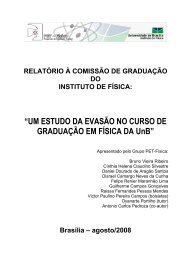
<strong>Periodic</strong> HF-LCCO calculations for titanium diboride 7217Table 5. Percentage anisotropy in the compressibility and shear for titanium diboride.Percentage anisotropyReference A ∗ comp (%) A∗ shear (%)This work 1.3 0.7Gilman and Roberts [25] 4.4 6.3Spoor et al [26] 1.3 1.5and Roberts [25] and Spoor et al [26]. As can be seen, a fair agreement is observed with theresults <strong>of</strong> Spoor et al, supporting their conclusion that TiB 2 is more isotropic than previouslysupposed.The analysis <strong>of</strong> the directional dependence <strong>of</strong> Young and bulk moduli (figure 5), thecomparison between fully relaxed and isotropic bulk moduli, as well as the ‘percentageanisotropies’ given in table 5, all suggest that titanium diboride is much more isotropic than onewould suppose exclusively on the basis <strong>of</strong> the usual description <strong>of</strong> its ‘planar’ crystal structure.In fact, it seems that the interactions between boron planes are not negligible at all and mustbe taken into account in order to better understand the origin <strong>of</strong> the mechanical properties <strong>of</strong>TiB 2 . In section 5, it will be shown how electronic charge-density maps give support to thisinterpretation.5. Electronic charge-density mapsFrom the crystal structure <strong>of</strong> TiB 2 depicted in figure 1, one could expect to find a substantialnon-uniformity in the bonding properties. This anisotropy can be appreciated in figure 6. Thebonding between in-plane boron atoms is strongly covalent, as evidenced by the maximumin the charge density at the bond middle point (figure 6(a)). Such localized bonding is notevident in the plane occupied by titanium. In contrast, the metallic character <strong>of</strong> the titaniumplanes can be appreciated in figure 6(b), which shows the titanium cores immersed in a sea <strong>of</strong>charge-density difference <strong>of</strong> about 0.005 e Bohr −3 .A charge transfer from the neighbourhood <strong>of</strong> the titanium atoms is clearly seen infigure 6(c), which maps the charge-density difference in the plane 110. Another feature<strong>of</strong> interest in this figure is the charge build-up along the line joining boron atoms in adjacentplanes. As can be seen in figure 6(d), as pressure increases to 115 GPa, there is also anincreasing <strong>of</strong> the charge transfer from the region between titanium atoms to an envelope<strong>of</strong> charge around boron atoms and also to a bimodal charge density accumulating betweenboron planes.Any particular criterion for the partition <strong>of</strong> the electronic charge among the components<strong>of</strong> a polyatomic system—a solid, in this case—will imply some degree <strong>of</strong> arbitrariness. Forinstance, the Mulliken population analysis [41], in particular, can yield very different resultsdepending, for instance, on small changes in the basis set employed in the calculations [39,40].In spite <strong>of</strong> that, we show in table 6 and table 7 the results <strong>of</strong> a Mulliken population analysis,including both valence shell and bond-overlap populations for TiB 2 at several pressures, asa complement to the electronic charge-density maps <strong>of</strong> figure 6. The Mulliken net chargesfor titanium and boron atoms at ambient pressure in TiB 2 are equal to q Ti = 0.376 andq B =−0.188, suggesting a charge transfer from titanium to boron. This result is in accordancewith a recent experimental finding confirming charge transfer from metal to boron in a similarcompound, namely TaB 2 [42], and also with other theoretical results, such as those <strong>of</strong> Tianand Wang [6] and Mizuno et al [43].
7218 C A Perottoni et al(a)(b)(c)(d)Figure 6. Charge-density difference maps. From the top to the bottom: planes parallel to thebasal plane, (a) occupied by boron and (b) by titanium, and plane 110, perpendicular to (a) and (b),containing both titanium and boron atoms, (c) at zero pressure and (d) at 115 GPa. The contour linesare drawn at intervals <strong>of</strong> 5 × 10 −3 e Bohr −3 . Continuous, dotted and dot–dash curves correspondto positive, zero and negative charge density relative to a pure superposition <strong>of</strong> atomic chargedensities. (These figures can be seen as colour maps at http://www.if.ufrgs.br/˜perott/tib2.htm. Atthis site there is also an animation illustrating the effect <strong>of</strong> pressure on the TiB 2 charge-densitydistribution.)Our results agree with the experimental charge-density distribution reported by Will andKirfel [44] as regards a charge excess at the middle point between in-plane boron atoms.However, the charge-density maps in figure 6 differ qualitatively, in at least one respect, from
<strong>Periodic</strong> HF-LCCO calculations for titanium diboride 7219Table 6. Dependency on pressure <strong>of</strong> the Ti and B net charge and valence shell population in TiB 2 .TiBP (GPa) q Ti (|e|) 4sp 5sp 3d q B (|e|) 2sp 3sp−21.7 0.492 4.757 1.729 2.105 −0.246 1.456 1.792−3.22 0.396 4.746 1.762 2.175 −0.198 1.533 1.6670 0.376 4.745 1.768 2.189 −0.188 1.542 1.64822.6 0.280 4.734 1.803 2.259 −0.140 1.619 1.52359.6 0.140 4.719 1.854 2.360 −0.070 1.713 1.359115 −0.030 4.701 1.919 2.480 0.015 1.818 1.169Table 7. Variation with pressure <strong>of</strong> the bond-overlap population in TiB 2 . Distances between atomsare quoted in ångströms. B ′ and Ti ′ stand for out-<strong>of</strong>-plane boron and titanium, respectively.P (GPa) Ti–Ti d Ti−Ti Ti–B d Ti−B B–B d B−B B–B ′ d B−B ′ Ti–Ti ′ d Ti−Ti ′−21.7 0.057 3.091 0.097 2.459 0.223 1.785 0.005 3.384 0.007 3.384−3.22 0.059 3.029 0.100 2.395 0.213 1.749 0.006 3.272 0.008 3.2720 0.058 3.027 0.101 2.383 0.210 1.748 0.007 3.240 0.009 3.24022.6 0.061 2.961 0.102 2.328 0.202 1.709 0.007 3.161 0.009 3.16159.6 0.063 2.886 0.102 2.259 0.188 1.666 0.009 3.050 0.009 3.050115 0.065 2.805 0.101 2.186 0.159 1.619 0.010 2.935 0.007 2.935those <strong>of</strong> Will and Kirfel. The Fourier synthesis <strong>of</strong> the electronic charge-density distributionon the 110 plane, as given in reference [44], shows a charge accumulation concentrated alongthe B–B bond, with the boron surrounded by a negative charge-density envelope. In contrast,our results show a broad, positive charge-density ‘wrapper’ around boron, that enlarges withpressure, as can be seen in figure 6(d). This positive charge density around boron actuallyoverflows along the c-axis, bridging the gap between the boron layers with a continuous,bimodal excess <strong>of</strong> electronic charge, running directly along the B–B lines perpendicular tothe basal plane, and not half-way between each pair <strong>of</strong> B atoms, as suggested in reference[44]. It is important to remark that both our results and those <strong>of</strong> Will and Kirfel show a nonnegligibleinteraction along the c-axis between stacking borons, a finding contrary to the usualassumption <strong>of</strong> a ‘planar’ structure for TiB 2 . As the result <strong>of</strong> DFT calculations, van Camp andvan Doren [13] found a fairly uniform charge density between the basal planes <strong>of</strong> titaniumdiboride. They did not reported any feature pointing to a particular interaction between boronplanes, in contradiction with our results. In this respect, it was recently shown that the exacttreatment <strong>of</strong> exchange in HF approximation is <strong>of</strong> primary importance in the description <strong>of</strong> thecharge build-up at the middle point <strong>of</strong> covalent bonds [14]. Consequently, it is not surprisingthat the bimodal charge accumulation along the line joining boron atoms from adjacent planeswas not revealed by previous DFT calculations, in which exchange was taken into accountonly approximately. Without some degree <strong>of</strong> directional bonding between boron planes, it issomewhat hard to explain the relative strength <strong>of</strong> titanium diboride along the normal to thebasal plane. It would be <strong>of</strong> great interest if further experimental work could verify to whatextent these subtle features in figure 6 are actually present in the electronic charge distribution<strong>of</strong> TiB 2 .Upon pressure increase to 115 GPa, the charge-density difference at the middle pointbetween in-plane borons increases by about 20%, while the bimodal charge build-up betweenboron layers grows by 50%. The comparison between the charge-density difference mapsat zero pressure and that at 115 GPa, shown in figures 6(c) and 6(d), respectively, can give
7220 C A Perottoni et alsome insight into the origin <strong>of</strong> the rapid increase <strong>of</strong> both <strong>linear</strong> bulk moduli B a and B c withpressure. Indeed, the main effect <strong>of</strong> the increasing pressure on the electron distribution inTiB 2 is to promote a charge transfer from the region around the titanium to the vicinity <strong>of</strong>the boron atoms. This occurs in apparent contradiction with the decrease <strong>of</strong> the B–B bondoverlappopulation (see table 7). In fact, the Mulliken population analysis indicates a growingpopulation <strong>of</strong> the Ti 5sp and 3d valence shells, and that <strong>of</strong> B 2sp, at the expense <strong>of</strong> a decrease<strong>of</strong> the boron diffuse 3sp shell population. However, the charge transferred to the outermostshells <strong>of</strong> Ti, and to the B 2sp shell, seems to concentrate in the neighbourhood <strong>of</strong> the boronatoms, with a consequent stiffening <strong>of</strong> B–B bonds, both those in the plane and those parallelto the c-axis. The net effect <strong>of</strong> this increase in charge transfer with pressure is the large valuesfound in section 3 for both <strong>linear</strong> bulk moduli pressure derivatives, Ba0 ′ and B′ c0. This alsohelps one to work out how the boron planes in TiB 2 can become stiffer than the carbon planesin graphite at high pressures.Therefore, the picture that emerges from the analysis <strong>of</strong> the charge-density distribution intitanium diboride, as calculated within the HF-LCCO approximation, is that the TiB 2 crystalstructure can be best viewed as a stacking <strong>of</strong> interacting boron planes forming cages, insidewhich rest the titanium atoms. These boron cages are connected together not only along thebasal planes, but also, to some extent, along the c-axis. This picture can help one to understandthe mechanical properties <strong>of</strong> titanium diboride, particularly its high hardness and the relativeisotropy <strong>of</strong> its elastic moduli.6. ConclusionsIn this work we were concerned with the structure, equation <strong>of</strong> state, elastic properties andelectronic charge distribution <strong>of</strong> TiB 2 . Our results are in good agreement with the availableexperimental data, mainly for the lattice parameters. Concerning the TiB 2 bulk modulus, thereis a considerable spread in both theoretical and experimental values, as was shown in table 2.Our result (B 0 = 292 GPa) seems to be quite reasonable for a hard material such as titaniumdiboride, and also agrees with the recently measured value for the homologous compoundVB 2 , whose preliminary analysis points to a value <strong>of</strong> B 0 around 330 GPa [45].This work also represents one more test <strong>of</strong> the suitability <strong>of</strong> the HF approximation, asimplemented in the CRYSTAL95 code, for the description <strong>of</strong> periodic systems with metalliccharacter [32,46,47]. In fact, the comparison <strong>of</strong> our results with experiment shows that, despitethe lack <strong>of</strong> any treatment <strong>of</strong> the electronic correlation, the periodic HF-LCCO approximationprovides good estimates for the structural parameters and reasonable values for the elasticmoduli <strong>of</strong> titanium diboride.The analysis <strong>of</strong> the charge-density distribution in TiB 2 showed a non-negligible, bimodalexcess charge accumulation running along the B–B lines perpendicular to the basal planes.Our results differ qualitatively from the early observations <strong>of</strong> Will and Kirfel [44], as well asthat <strong>of</strong> van Camp and van Doren [13], and suggest that the electronic charge distribution intitanium diboride should be subjected to further experimental investigation. The main effect <strong>of</strong>pressure on the electronic density maps is a continuous charge transfer from the neighbourhood<strong>of</strong> the titanium to a charge envelope developing around boron, and also to the bimodal chargebuild-up bridging the boron layers, a feature with increasing significance at high pressures.On the basis <strong>of</strong> the relative isotropy <strong>of</strong> the elastic properties <strong>of</strong> TiB 2 as well as the analysis<strong>of</strong> its electronic charge-density distribution, we suggest, in accordance with reference [44],that the crystal structure <strong>of</strong> titanium diboride can be best described as constituted by stackinglayers <strong>of</strong> boron, interacting in a non-negligible way along the c-axis and forming cages, insidewhich rest the titanium atoms. The metal cores, <strong>of</strong> course, also contribute to the overall
<strong>Periodic</strong> HF-LCCO calculations for titanium diboride 7221structural stability, but the direct interaction between borons along the c-axis should contributesignificantly to the rigidity <strong>of</strong> the titanium diboride structure. This represents a significantchange in the way <strong>of</strong> thinking about the TiB 2 crystal structure.AcknowledgmentsThis work was partially supported by CNPq, FINEP and FAPERGS (Brazil). Some <strong>of</strong> thecalculations were carried out at the Centro Nacional de Supercomputacao da UniversidadeFederal do Rio Grande do Sul—CESUP. The authors thank Dr J A C Gallas, who gave usaccess to his own computational resources, and Dr M Towler, for the Unix script shell used toperform the basis-set optimization.References[1] Cutler R A 1991 Engineering Properties <strong>of</strong> Borides (Engineered Materials Handbook vol 4) ed S J SchneiderJr et al (Metals Park, OH: ASM International)[2] The Encyclopedia <strong>of</strong> Advanced Materials 1994 vol 1, ed D Bloor, R J Brook, M C Flemings, S Mahajan andR W Cahn (Oxford: Elsevier Science) pp 287–92[3] Hagen A P (ed) 1991 Inorganic Reactions and Methods vol 13, (New York: VCH) p 84–245[4] Handbook <strong>of</strong> Chemistry and Physics 1989 70th edn, edRCWeast (Boca Raton, FL: Chemical Rubber CompanyPress)[5] Li X, Manghnani M H, Ming L C and Grady D E 1996 J. Appl. Phys. 80 3860[6] Tian D C and Wang X B 1992 J. Phys.: Condens. Matter 4 8765[7] Grechnev G E and Ushakova N V 1997 Low Temp. Phys. 23 217[8] Wang X B, Tian D C and Wang L L 1994 J. Phys.: Condens. Matter 6 10 185[9] Anishchik V M and Dorozhkin N N 1990 Phys. Status Solidi b 160 173[10] Armstrong D R 1983 Theor. Chim. Acta 64 137[11] Burdett J K, Canadell E and Miller G J 1986 J. Am. Chem. Soc. 108 6561[12] Guillermet A F and Grimvall G 1991 J. Less-Common Met. 169 257[13] van Camp P E and van Doren V E 1995 High Pressure Res. 13 335[14] Pere J, Gelizé-Duvignau M and Lichanot A 1999 J. Phys.: Condens. Matter 11 5827[15] Dovesi R, Saunders V R, Roetti C, Causà M Harrison N M, Orlando R and Aprà E 1996 CRYSTAL95 User’sManual University <strong>of</strong> Torino[16] Pisani C, Dovesi R and Roetti C 1988 Hartree–Fock Ab Initio Treatment <strong>of</strong> Crystalline Systems (Springer LectureNotes in Chemistry vol 48) (Heidelberg: Springer)[17] Saunders V R, unpublished[18] Causà M and Zupan A 1994 Chem. Phys. Lett. 220 145[19] Monkhorst H J and Pack J D 1976 Phys. Rev. B 13 5188[20] Gilat G and Raubenheimer J L 1966 Phys. Rev. 144 390[21] Press W H, Flannery B P, Teukolsky S A and Vetterling W T 1989 Numerical Recipes (Cambridge: CambridgeUniversity Press)[22] Post B, Glaser F W and Moskowitz D 1954 Acta Metall. 2 20[23] Hanfland M, Beister H and Syassen K 1989 Phys. Rev. B 39 12 598[24] Silver A H and Kushida T 1963 J. Chem. Phys. 38 865[25] Gilman J J and Roberts B W 1961 J. Appl. Phys. 32 1405[26] Spoor P S, Maynard J D, Pan M J, Green D J, Hellmann J R and Tanaka T 1997 Appl. Phys. Lett. 70 1959[27] Manghnani M H, Fisher E S, Li F and Grady D E, as discussed in reference [28][28] Wright S J 1994 J. Appl. Crystallogr. 27 794[29] Fast L, Wills J M, Johansson B and Eriksson O 1995 Phys. Rev. B 51 17 431[30] Catti M, Pavese A, Dovesi R, Roetti C and Causà M 1991 Phys. Rev. B 44 3509[31] Gale J D, Catlow CRAandMackrodt W C 1992 Modell. Simul. Mater. Sci. Eng. 1 73[32] Baraille I, Pouchan C, Causà M and Marinelli F 1998 J. Phys.: Condens. Matter 10 10 969[33] Nye J F 1964 Physical Properties <strong>of</strong> Crystals (London: Oxford University Press)[34] Wiley D E, Manning W R and Hunter O Jr 1969 J. Less-Common Met. 18 149[35] Hill R 1952 Proc. Phys. Soc. 65 349
7222 C A Perottoni et al[36] Gust W H, Holt A C and Royce E B 1973 J. Appl. Phys. 44 550[37] Abbate A, Frankel J and Dandekar D, as discussed in reference [28][38] Grady D E, as discussed in reference [28][39] Orlando R, Dovesi R, Roetti C and Saunders V R 1990 J. Phys.: Condens. Matter 2 7769[40] Szabo A and Ostlund N S 1996 Modern Quantum Chemistry (Minneola, FL: Dover) p 152[41] Mulliken R S 1955 J. Chem. Phys. 23 1833Mulliken R S 1955 J. Chem. Phys. 23 1841[42] Kawanowa H, Souda R, Otani S and Gotoh Y 1998 Phys. Rev. Lett. 81 2264[43] Mizuno M, Tanaka I and Adachi H 1999 Phys. Rev. B 59 15 033[44] Will G and Kirfel A 1986 Proc. Int. Conf. on the Physics and Chemistry <strong>of</strong> Boron and Boron-Rich Borides(Albuquerque, NM, 1985) (AIP Proc. No 140) (New York: AIP) p 87[45] Pereira A S, Haines J, Léger J M and da Jornada JAH,unpublished[46] Dovesi R, Pisani C and Roetti C 1983 Gazz. Chim. Ital. 113 313[47] Dovesi R, Pisani C, Ricca F and Roetti C 1982 Phys. Rev. B 25 3731