Clinical Outcome Report - The Royal Wolverhampton Hospitals NHS ...
Clinical Outcome Report - The Royal Wolverhampton Hospitals NHS ...
Clinical Outcome Report - The Royal Wolverhampton Hospitals NHS ...
Create successful ePaper yourself
Turn your PDF publications into a flip-book with our unique Google optimized e-Paper software.
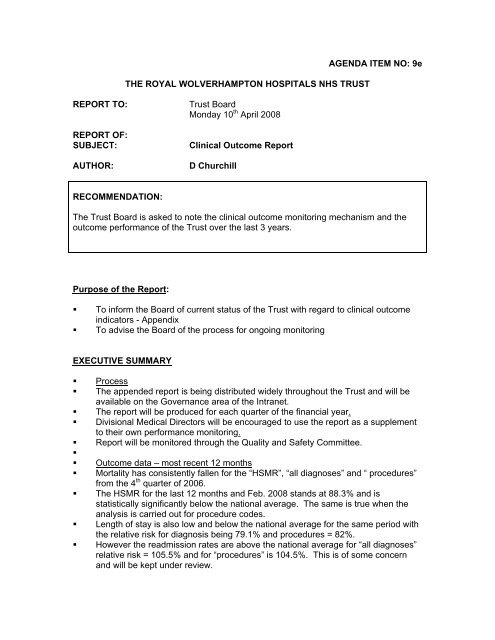
THE ROYAL WOLVERHAMPTON HOSPITALS <strong>NHS</strong> TRUSTAGENDA ITEM NO: 9eREPORT TO:REPORT OF:SUBJECT:AUTHOR:Trust BoardMonday 10 th April 2008<strong>Clinical</strong> <strong>Outcome</strong> <strong>Report</strong>D ChurchillRECOMMENDATION:<strong>The</strong> Trust Board is asked to note the clinical outcome monitoring mechanism and theoutcome performance of the Trust over the last 3 years.Purpose of the <strong>Report</strong>:• To inform the Board of current status of the Trust with regard to clinical outcomeindicators - Appendix• To advise the Board of the process for ongoing monitoringEXECUTIVE SUMMARY• Process• <strong>The</strong> appended report is being distributed widely throughout the Trust and will beavailable on the Governance area of the Intranet.• <strong>The</strong> report will be produced for each quarter of the financial year.• Divisional Medical Directors will be encouraged to use the report as a supplementto their own performance monitoring.• <strong>Report</strong> will be monitored through the Quality and Safety Committee.•• <strong>Outcome</strong> data – most recent 12 months• Mortality has consistently fallen for the “HSMR”, “all diagnoses” and “ procedures”from the 4 th quarter of 2006.• <strong>The</strong> HSMR for the last 12 months and Feb. 2008 stands at 88.3% and isstatistically significantly below the national average. <strong>The</strong> same is true when theanalysis is carried out for procedure codes.• Length of stay is also low and below the national average for the same period withthe relative risk for diagnosis being 79.1% and procedures = 82%.• However the readmission rates are above the national average for “all diagnoses”relative risk = 105.5% and for “procedures” is 104.5%. This is of some concernand will be kept under review.
Implications:Financial - None at present but in the future decisions will need to be made about thecontract with Dr Foster for provision of benchmarking servicesHuman Resources - NoneHealthcare - To improve the standard of care to the patients by improving outcomemeasuresPolicy - Integral Governance StrategyLegal -Standards for Better Health - Domain 1 patient safetyDomain 3 GovernanceOther
Dr Foster – <strong>Clinical</strong> <strong>Outcome</strong> <strong>Report</strong> (March 2008)This report covers the period April 2004 to December 2007.This and subsequent reports aim to provide information for all clinical staff in the Trust on the 4 outcomemeasures within the Dr Foster system and thus highlight the Trusts performance against the national benchmark.<strong>The</strong> data are presented in 4 ways:1. the trend over time – a 3 year period split into quarters (page 1);2. the average performance of the Trust over a three year period set against the national average (page 2);3. specialty outcome data for the top ten specialties by % volume of Trust activity;4. and a Divisional scorecard split by specialty.MortalityOverall Trust mortality for the HSMR and All Diagnoses has fallen from quarter 4 2006 and is significantlybelow the national average. <strong>The</strong> same can be said for mortality when measured by procedure codes, but this isnot statistically significant. For the three year period in total the Trust is around the national average formortality albeit with a slight excess in the number of deaths expected.Length of stay<strong>The</strong> position for length of stay is good when measured by the diagnosis but when measured by procedure thereare a significant number of patients who have a longer than expected length of stay. <strong>The</strong> first question to beasked is, are these patients being coded with all attributable co-morbidities. If not then they will have anartificially lowered risk assessment and the expected length of stay will be miscalculated.Specialty data is very individualistic but we hope that you will be able to use the data in the description of yourservice in the Divisional Governance reports. This will then feed into the Trust Governance agenda.This report will be up-dated and circulated on a quarterly basis and we hope that you will find it useful ingovernance terms.1 of 8 8-Apr-08
Trust wide mortality rates for the HospitalStandardised Mortality Ratio (HSMR). 56diagnosis that account for 80% of in hospitaldeaths.Shows relative risk as a percentage. 100%represents observed outcomes the same asexpected (casemix adjusted).Trust wide mortality rates forALL DIAGNOSIS included in the RTM toolShows relative risk as a percentage. 100%represents observed outcomes the same asexpected (casemix adjusted).Trust wide mortality rates forALL PROCEDURES included in the RTM toolShows relative risk as a percentage. 100%represents observed outcomes the same asexpected (casemix adjusted).2 of 8 8-Apr-08
Mortality rates for Apr 2004 to December 2007ExpectedDeathsNumber ofunexpecteddeathsSpells Actual DeathsRRHSMRDIAGNOSIS 109211 5428 5% 5394.9 5% 33.1 100.6ALL DIAGNOSIS 154870 5769 3.7% 5739.1 3.7% 29.9 100.5ALLPROCEDURES 91749 1071 1.2% 1085.9 1.2% -14.9 98.6Patients with a long length of stay Apr 2004 to December 2007Number of patientswith a Long Lengthof Stay (top 25%nationally) %Number of patientsexpected to have aLong Length of Stay(top 25% nationally) %Actual VExpectedSpellsRRHSMRDIAGNOSIS 109211 14412 13.2 16103.4 14.7 -1691 89.5ALL DIAGNOSIS 154870 21832 14.1 24262 15.7 -2430 90.0ALLPROCEDURES 91749 12812 14.0 12097.9 13.2 714.1 105.9Patients re-admitted within 28 days Apr 2004 to December 2007Spells Readmissions %Expectedreadmissions %ExpectedVObservedALL DIAGNOSIS 145859 12975 8.9 12878.6 8.9 96.4 100.7ALLPROCEDURES 87006 5051 5.8 4843.8 5.6 207.2 104.3Day Case Rates Apr 2004 to December 2007RRSpellsInpatientsDayCasesDay CaseRate %ALL Day Case Procedures 39599 10555 29044 73.3Healthcare CommissionProcedures 28174 8611 19563 69.4<strong>The</strong> healthcare commission basket is a group of 25 procedures. Providers are targeted to treat 75% of elective surgery as day cases.3 of 8 8-Apr-08
Highest volume specialties detailed analysisSpecialtyMortality Relative Risk % Length of stay (top 25%) Readmission within 28 days Day Case Rates (%)YTDYTDYTD(Apr(Apr -(Apr -- OctOctOct07) 04/05 05/06 06/07 07) 04/05 05/06 06/07 07) 04/05 05/06 06/07% of allactivity06/07 04/05 05/06 06/07GeneralMedicine 19.40% 101 113 106 99.4 88.2 92 81.3 78.7 92.4 92.2 93.5 83.2 0 558 324.7 0Obstetrics 10.30% 127 0 0 0 60.9 92 72.7 68.9 73.3 29 48.5 16 0 0 0 371.6Paediatrics 9% 84.8 15.3 40 26 48.7 45.7 29.8 22.8 108 107.2 105.2 98.8 99.9 301.7 280.3 279GeneralSurgery 8.90% 106 109.7 78.1 81 116 121 87.2 88 86 92.3 101.6 106.5 126.8 132 99.9 85.5<strong>Clinical</strong>Oncology 7.80% 84.7 123.2 63.3 22.4 113.8 161 67.6 54.8 103 108.7 129 147.1 0 527.1 0 0Trauma &Orthopaedics 7.20% 105 126.8 111 76.3 83 95.8 83.1 70.7 91.6 100.8 92.4 100.4 132 118 72.2 45.6Urology 5.20% 69 88.8 65.1 45.1 93.6 98.3 87.9 56.8 88.1 92.7 95.8 115 133.6 133 110.2 106.7Gynaecology 4.80% 69.9 62.2 136 92.1 87.3 86.5 64 59.8 119 132 122.9 143.7 144.4 131 81 76.2Ophthalmology 4.80% 66 0 0 0 11.8 11.5 13.5 18.9 98.7 101.8 41.3 146.4 229.9 191 141 111.3<strong>Clinical</strong>Haematology 4.60% 129 59.9 55.9 73.2 113.1 153 119 127.3 81.9 68.8 85.3 63.1 1025 438.6 558 1024.5YTD(Apr -Oct 07)It should be noted that due to the case mix adjustment the Dr Foster RTM tool only includes approximately 90% of all activity.4 of 8 8-Apr-08
Divisional ‘Score Card’ Apr ’06 to Mar ‘07SpecialtyMortalityRR %LonglengthofstayRR%readmissionwitin 28days RR%DayCaseRateRR%ALL 90.7 79.3 108.4 87General Medicine 104.3 79.5 90.9 N/A<strong>Clinical</strong> Oncology(previouslyRadiotherapy) 37.3 47.3 145.3 N/AGeneral Surgery 69.6 81.3 101.2 89.2Paediatrics 57.3 26.3 136.1 N/AWell Babies 92.1 89.4 309.9 N/ACardiology 46 49.8 88.3 N/A<strong>Clinical</strong> Haematology 59.2 117.2 65.2 N/AUrology 63.8 64 102.9 106.1Trauma &Orthopaedics 75.7 73.3 103.8 53Medical Oncology 26.1 34.2 136.1 N/AObstetrics 0 72.4 21.8 N/ACardiac Surgery 88.3 184.2 183.5 N/AGynaecology 102.8 56.8 146.3 80.2ENT 216.7 33.7 93.6 109.5Neonatology 1253.2 187.7 284.8 N/AOphthalmology 0 24.4 83.3 125.3Thoracic Surgery 56.7 113.1 126.3 N/APain Management 0 0 179.7 N/ARheumatology 0 447.5 0 543.1Geriatric Medicine 204.7 0 402.6 N/AOral Surgery 275.9 40.1 118.5 62.1Accident &Emergency 176.5 109.8 0 N/ANeurology 0 299.8 425.3 N/A5 of 8 8-Apr-08
All figures shown are Relative Risk scores comparing observed outcomes to expected outcomes (casemixadjusted). A score of 100% represents observed outcomes that are the same as the expected. A score below100% represents better observed outcomes and above 100% represents poorer observed outcomes.Dr Foster Real Time MonitoringDr Foster Real Time Monitoring aims to supply hospital managers and clinicians with critical information tosupport clinical governance. <strong>The</strong> system enables them to recognise where there is variation in activity oroutcomes in particular hospitals; to see whether or not that variation is statistically significant; to analysepatterns in terms of different patient groups, different hospital site or different clinician teams; and to see howpatterns of activity are changing over time.<strong>The</strong> information can be used for a range of purposes including:• <strong>Clinical</strong> safety: Tracking significant divergence in outcomes or activity in a hospital is a valuablemechanism for helping to identify if problems arise that affect patient safety.• Efficiency: Efficiency improvements can be identified by tracking use of hospital beds; the numbers ofpatients that have particular procedures; and the pattern of admissions and discharges either home or toother facilities.• Performance improvement: Tracking key measures of patient outcome and activity in close to real timecan help provide rapid feedback to identify whether restructuring of processes is having the desired resultand avoiding any unintended consequences.<strong>The</strong> Dr Foster system aims to meet the following criteria:• Comprehensive: <strong>The</strong> most comprehensive overview of the activity inside <strong>NHS</strong> hospitals in England.<strong>The</strong> system tracks patients from their admission to hospital, to the end of their journey through the <strong>NHS</strong>.• Intelligent: <strong>The</strong> most “intelligent” analysis using state-of-the art statistical analyses to benchmark thedata. Using appropriate adjustments and comparisons, the system discounts difference that are simplyexplained or which are of no statistical importance. It focuses on the differences that require explanation.• Timely: <strong>The</strong> system provides the most up-to-date analysis possible and uses analyses that provide theoptimal sensitivity and specificity over any time period.• Data quality: <strong>The</strong> system provides the most effective means to ensure the accuracy and completeness ofofficially recorded data<strong>The</strong> system currently uses a Common Data Set derived from inpatient records (issued either as the annualHospital Episode Statistics or as monthly release from the Nationwide Clearing Service) and 2001 census datafor population figures. ONS death records will be added to the system during the course of 2004.Monitoring analyses of these datasets is important because:6 of 8 8-Apr-08
• <strong>The</strong>y provide the most comprehensive information on healthcare in the UK (all inpatients in England).This creates to provide a statistically solid benchmark against which to understand variations in patternsof care between providers.• <strong>The</strong>y are also used to generate official performance indicators and are used in the calculation of resourceallocation. Ensuring the quality of these datasets is therefore a high priority. Also, it can help avoidunnecessary confusion and is more economically efficient if the internal monitoring and management ofhealthcare organisations is based on the same data as is used for external scrutiny.• <strong>The</strong>se Common Data Set is being developed and improved and with the introduction of the ICR willsignificantly expand. This data set will become of increasing importance over time.• <strong>The</strong> data set allows linkage of patient spells in one <strong>NHS</strong> facility to another and can provide a commonbasis for an information system for the whole health economy.2. <strong>The</strong> real time monitoring system – what does it do?• Highlight where the data show significant divergence from national benchmarks at the earliest possibleopportunity• Track whether measures of process and outcome are diverging from or converging towards benchmarks• Make appropriate adjustment for case mix using age, sex, method of admission, deprivation and selectdiagnostic subgroups• Allow comparison of performance data against national benchmarks and against any other selected trustin England.• Allow timely checking and correction of the underlying dataFormats: <strong>The</strong> system displays data in the following formats:• Alerts: <strong>The</strong> alerts display draws attention to where there has been significant divergence from expectedlevels. Users are able to adjust alert limits to suit local priorities and targets. Data is presented with rawnumbers, relative risk values and confidence intervals, with red and green icons to show significantnegative or positive divergence.• Statistical process control charts. <strong>The</strong>se track data over time and are designed to identify at the earliestopportunity a significant divergence in outcomes. Alerts are signalled when one is detected.This analysis is designed to draw managers and clinician’s attentions to those issues raised by the data.<strong>The</strong> system provides a way to track whether a hospital, department or consultant performance isconverging towards or diverging from the rest of the <strong>NHS</strong> over time given the patient mix. Alerts can becustomised to trigger at different levels.• Relative risk charts. <strong>The</strong>se allow comparative analysis of data over selected time periods and selectedpatient groups, both against national averages and against selected trusts.7 of 8 8-Apr-08
This more traditional analysis allows comparison of performance measures and enables users tounderstand in more depth factors that may be affecting relative performance measures.• Data tables and data detail. <strong>The</strong>se allow scrutiny of the underlying data in tables and down toindividual records. This can be used to highlight gaps or inconsistencies in the underlying data.By linking these to the data collection and recording systems we believe it is possible to greatly improvethe completeness and accuracy of the data.Measures: <strong>The</strong> system currently analyses the following measures:• In-hospital 30 day mortality rates• Length of stay (the percentage staying longer than 75 % of patients nationally)• Day case rates (compared to the national average and 75 th percentile rates of day case surgery)• Readmission rates (emergency readmission to any hospital within 28 days of discharge).Standardisation: <strong>The</strong> measures are standardised, within each year, as appropriate, for:• Age• Sex• Diagnosis• Method of admission• Deprivation• Diagnostic sub groups8 of 8 8-Apr-08


