Download the Presentation - Sidchapters.org
Download the Presentation - Sidchapters.org
Download the Presentation - Sidchapters.org
You also want an ePaper? Increase the reach of your titles
YUMPU automatically turns print PDFs into web optimized ePapers that Google loves.
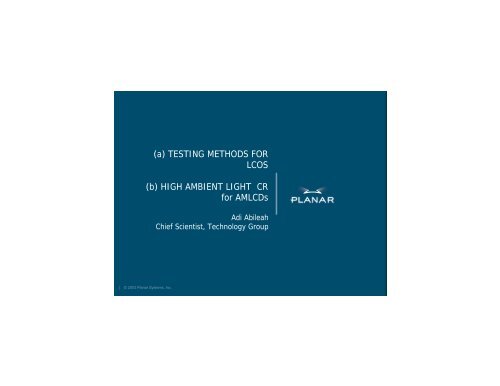
(a) TESTING METHODS FORLCOS(b) HIGH AMBIENT LIGHT CRfor AMLCDsAdi AbileahChief Scientist, Technology Group| © 2003 Planar Systems, Inc.
OUTLINETESTING METHOD for LCOS¨ Introduction¨ Display Assembly¨ Light source, Optics, and LCOS testing¨ Final testing (ATP)¨ SummaryHIGH AMBIENT LIGHT CR for AMLCDs¨ Displays tested¨ Methods tested¨ Test results¨ Analysis¨ Conclusions| © 2003 Planar Systems, Inc. Bay Area-SID, Adi - (21-Oct-03)
INTRODUCTION¨ This project conducted over 2 years ago, when¨ No commercial testing equipment was available¨ The application and <strong>the</strong> optical system is propriety¨ Generic description of <strong>the</strong> system:SystemopticsPolarizingbeam-splitterLEDs+mixerLCOS| © 2003 Planar Systems, Inc. Bay Area-SID, Adi - (21-Oct-03)
INTRODUCTIONChallenges:¨ Increase systembrightness (> x3)¨ Uniformity improvement,no fringes¨ Testing of miniaturedisplay¨ Find critical parametersto measureSolutions:¨ Propriety light mixer,brighter LEDs, o<strong>the</strong>r...¨ work with cellmanufacturer¨ Developed methodsdescribed below¨ Will be described| © 2003 Planar Systems, Inc. Bay Area-SID, Adi - (21-Oct-03)
DISPLAY ASSEMBLYLight Source(LED’s)Light MixerOpticsAssemblyLCOSLamination(board)Final Tests(ATP)| © 2003 Planar Systems, Inc. Bay Area-SID, Adi - (21-Oct-03)
DISPLAY ASSEMBLYLight Source(LED’s)Light MixerOpticsAssemblyLCOSLamination(board)Final Tests(ATP)| © 2003 Planar Systems, Inc. Bay Area-SID, Adi - (21-Oct-03)
LIGHT SOURCE TESTINGLight Source(LED’s)Light MixerReference driverPhotometer(PR-650)Tested data:Luminance (Lum)Colors CIE-(x, y)( for: W,R,G,B )| © 2003 Planar Systems, Inc. Bay Area-SID, Adi - (21-Oct-03)
Luminance (fL)LIGHT SOURCE TESTED DATALight Mixer Luminance of White1450014000135001300012500W12000115001100010500100000 10 20 30 40 50 60 70Light Mixer #26002400Light Mixer Luminance of RedRLuminance (fL)220020001800160014000 10 20 30 40 50 60 70Light Mixer #| © 2003 Planar Systems, Inc. Bay Area-SID, Adi - (21-Oct-03)
LIGHT SOURCE TESTED DATA1150011000Light Mixer Luminance of GreenGLuminance (fL)105001000095009000850080000 10 20 30 40 50 60 70Light Mixer #20001900Light Mixer Luminance of BlueBLuminance (fL)180017001600150014000 10 20 30 40 50 60 70Light Mixer #| © 2003 Planar Systems, Inc. Bay Area-SID, Adi - (21-Oct-03)
LIGHT SOURCE TESTED DATA0.9Light Mixer Chromaticity (CIE 1931)0.80.70.6CIE y0.50.40.30.20.100 0.1 0.2 0.3 0.4 0.5 0.6 0.7 0.8CIE x| © 2003 Planar Systems, Inc. Bay Area-SID, Adi - (21-Oct-03)
DISPLAY ASSEMBLYLight Source(LED’s)Light MixerOpticsAssemblyLCOSLamination(board)Final Tests(ATP)| © 2003 Planar Systems, Inc. Bay Area-SID, Adi - (21-Oct-03)
OPTICS TESTINGLight Source (LED’s)+ Light MixerMotorizedmechanical stageOpticsPhotometer(PR-650)Replace display with:(a) Mirror(b) 1/4 Wave/ mirrorTested data (5 pts):Luminance (Lum)Colors CIE-(x, y)( for: W,R,G,B, Blk )| © 2003 Planar Systems, Inc. Bay Area-SID, Adi - (21-Oct-03)
DEFINITION OF 5 POINTSyxWL(x, y) = ( ± 1/3*L , ± 1/3*W )| © 2003 Planar Systems, Inc. Bay Area-SID, Adi - (21-Oct-03)
OPTICS TEST RESULTSTypical test results in <strong>the</strong> center (cc):w/mirrorw/ 1/4 wave mirrorLum x y Lum x y CRCenter Lum-M x-M y-M Lum-W x-W y-W CRW Wcc 3.89 0.217 0.268 1265.0 0.229 0.310 325R Rcc 0.55 0.702 0.294 163.0 0.701 0.296 296G Gcc 3.06 0.206 0.727 1006.0 0.206 0.711 329B Bcc 0.53 0.135 0.057 150.0 0.135 0.065 283Measurements were done at 5 points (UL, UR, CC, BL, BR)| © 2003 Planar Systems, Inc. Bay Area-SID, Adi - (21-Oct-03)
OPTICS TEST RESULTS1800160014001200100080060040020001 2 3 4 5 6 7 8 9 10 119876543210Lum-WCRLum-MLum-W = 1/4 Wave+Mirror; Lum-M = Mirror;CR=Contrast ratio (left scale)Sample: 13 panels at center (cc)| © 2003 Planar Systems, Inc. Bay Area-SID, Adi - (21-Oct-03)
DISPLAY ASSEMBLYLight Source(LED’s)Light MixerOpticsAssemblyLCOSLamination(board)Final Tests(ATP)| © 2003 Planar Systems, Inc. Bay Area-SID, Adi - (21-Oct-03)
DISPLAY TESTINGTest structureCCD imaging(R, Blk)(Pogo-pins)Drive ElectronicsPhotometer(PR-650)Motorizedmechanical stageLCOSTest opticsTested data (5 pts):Luminance (Lum)Colors CIE-(x, y)( for: W,R,G,B, Blk )| © 2003 Planar Systems, Inc. Bay Area-SID, Adi - (21-Oct-03)
CCD IMAGE of PANELUsing <strong>the</strong> image processing tools we estimated<strong>the</strong> non-uniformity (partially related to <strong>the</strong>reference optics)| © 2003 Planar Systems, Inc. Bay Area-SID, Adi - (21-Oct-03)
DISPLAY TESTING (Template, 5 pts)Luminance and Chromaticity Uniformity MeasurementsSample: CR = Contrast Ratio = White/Black (inch) XDate: Nonuniformity = 100%(1-Min/Max) Upper Left -0.1260Image Source: ∆u'v' = SQRT((u'1-u'2)^2+(v' 1-v'2)^2) Upper Right 0.1260Photometer: PR-650 Center 0.0000Comments: dxx_xxxxx_red.bmp Lower Left -0.1260dxx_xxxxx_blk.bmp Lower Right 0.1260White in RGB ModeBlack in RGB ModeLum. (fL) CIE 1931 (x,y) CIE 1976 (u',v') Lum. (fL) CIE 1931 (x,y) CIE 1976 (u',v') RGB Mode measured Spot size:Location Lum-Wht x-Wht y-Wht u'-Wht v'-Wht Lum-Blk x-Blk y-Blk u'-Blk v'-Blk CR-RGB 1.396 mmUpper Left 0.000 0.000 0.000 0.000 #DIV/0! 0.0550 inchUpper Right 0.000 0.000 0.000 0.000 #DIV/0!Center 0.000 0.000 0.000 0.000 #DIV/0!Lower Left 0.000 0.000 0.000 0.000 #DIV/0!Lower Right 0.000 0.000 0.000 0.000 #DIV/0!Average #DIV/0! ###### ###### 0.000 0.000 #DIV/0! ###### ###### 0.000 0.000 #DIV/0!Minimum 0 0 #DIV/0!Maximum 0 0 #DIV/0!Nonuniformity #DIV/0! #DIV/0! #DIV/0!Max ∆u'v' 0.000 0.000R(avg) 0.000 0.000Each of 5 pts tested with W, Blk, R,G,B, fieldsCalculated: Average(Lum); Non-uniformity (1-Min/Max); maximum color shift (delta-u’v’);CR=contrast ratio;| © 2003 Planar Systems, Inc. Bay Area-SID, Adi - (21-Oct-03)
DISPLAY ASSEMBLYLight Source(LED’s)Light MixerOpticsAssemblyLCOSLamination(board)Final Tests(ATP)| © 2003 Planar Systems, Inc. Bay Area-SID, Adi - (21-Oct-03)
FINAL TESTS (ATP)¨ Packaging (Alignment) test¨ CCD image (R, Blk), including visual¨ Fully automated 5 points test> Luminance (Lum)> Colors CIE-(x,y)> for: W,R,G,B,Blk¨ Calculate:> Average (5 points) Luminance,> non-uniformity = 1 - Min/Max> Max color shift: D-u’v’=SQRT((u'1-u'2)^2+(v'1-v'2)^2)> Contrast Ratio (CR)¨ Match against specs| © 2003 Planar Systems, Inc. Bay Area-SID, Adi - (21-Oct-03)
ALIGNMENT TESTUsing <strong>the</strong> optical stage and CCD optics/ imagingwe measured <strong>the</strong> alignment accuracy(translation and rotation) to <strong>the</strong> meet <strong>the</strong>specs| © 2003 Planar Systems, Inc. Bay Area-SID, Adi - (21-Oct-03)
CCD TEST IMAGESony CCD with Macro-Zoom lensFrame grabber and image toolsallows profiles measuring| © 2003 Planar Systems, Inc. Bay Area-SID, Adi - (21-Oct-03)
CCD IMAGING - black field| © 2003 Planar Systems, Inc. Bay Area-SID, Adi - (21-Oct-03)
VISUAL INSPECTION¨ CCD camera support visual¨ Test patterns with grid to divide to regions¨ Each region has criteria (center most severe)¨¨¨¨BlemishesDark spotsWhite spotsFringe patterns| © 2003 Planar Systems, Inc. Bay Area-SID, Adi - (21-Oct-03)
CCD IMAGING - Red fieldImage showing defects, particles| © 2003 Planar Systems, Inc. Bay Area-SID, Adi - (21-Oct-03)
FINAL TESTING (ATP) SET-UPPhotometer PR-650 with Macro lens(Not shown - scanning stage with driver andcomputer control)| © 2003 Planar Systems, Inc. Bay Area-SID, Adi - (21-Oct-03)
PRILIMINARY ATP DATAPreliminary ATP data250200150100Lum-W(fL)Contrast5001 3 5 7 9 11 13 15 17 19 21 23 25 27 29 31 33 35 37Sample data helped to define specs:Average +/- 3*StDev| © 2003 Planar Systems, Inc. Bay Area-SID, Adi - (21-Oct-03)
COLOR DISTRIBUTION (CIE- u’,v’)CIE- u' v'0.7000.6000.5000.4000.3000.2000.1000.0000.000 0.100 0.200 0.300 0.400 0.500 0.600 0.700| © 2003 Planar Systems, Inc. Bay Area-SID, Adi - (21-Oct-03)
SUMMARY¨ Tests were done at component level¨ After assembly - Final ATP include:> Alignment> CCD imaging, visual> Fully automated 5 points Photometer measurements¨ Achieved good brightness, relatively poor CR,good colors, stable white balance¨ LEDs brightness improved much at that time¨ Sorry that I cannot detail about <strong>the</strong> optics andapplication...| © 2003 Planar Systems, Inc. Bay Area-SID, Adi - (21-Oct-03)
OUTLINETESTING METHOD for LCOS¨ Introduction¨ Display Assembly¨ Light source, Optics, and LCOS testing¨ Final testing (ATP)¨ SummaryHIGH AMBIENT LIGHT CR for AMLCDs¨ Displays tested¨ Methods tested¨ Test results¨ Analysis¨ Conclusions| © 2003 Planar Systems, Inc. Bay Area-SID, Adi - (21-Oct-03)
DISPLAYS TESTED¨ 3ATI AMLCD (Color)RGBW, 57.6 x 57.6 mm 2 ,High performing (very lowreflection)¨320x80 ELMonochrome (Amber)91.8 x 22.9 mm 2ICE (Internal AR) treatment ,no front AR| © 2003 Planar Systems, Inc. Bay Area-SID, Adi - (21-Oct-03)
METHODS TESTEDContrast Measurement Systems:¨ Military Standard (MIL-85762A)¨ VESA cooler¨ Globe - Integrating Sphere¨ Halogen Track Lights¨ HMI Lamp¨ CONOSCOPE (Eldim System)Purpose:Decide whichHigh ambientmethod to use| © 2003 Planar Systems, Inc. Bay Area-SID, Adi - (21-Oct-03)
MIL-85762A SET-UP (TOP VIEW)Slide ProjectorFiber OpticIlluminatorPhotometerDiffuser30° 30°Display| © 2003 Planar Systems, Inc. Bay Area-SID, Adi - (21-Oct-03)
MILITARY STANDARD (MIL-85762A)TopView| © 2003 Planar Systems, Inc. Bay Area-SID, Adi - (21-Oct-03)
MILITARY STANDARD (MIL-85762A)¨ Specular and diffuse reflectancemeasurements are independent¨ Specular source at 30° from <strong>the</strong> right is afully dimmable fiber optic illuminator behindtwo thin diffusers¨ Diffuse source at 5° vertical is a slideprojector that can be dimmed¨ Measurements are made from 30° left| © 2003 Planar Systems, Inc. Bay Area-SID, Adi - (21-Oct-03)
MILITARY STANDARD (MIL-85762A)SideView| © 2003 Planar Systems, Inc. Bay Area-SID, Adi - (21-Oct-03)
VESA - COOLER¨ A combination of diffuse and specularreflectance¨ Illuminated with halogen track lights inside awhite Styrofoam cooler¨ Measured from 8° off axis¨ Dimmable to ~2500 fC¨ CCT range from 1900 K to 3000 KdisplayCoolerPhotometer| © 2003 Planar Systems, Inc. Bay Area-SID, Adi - (21-Oct-03)
VESAVESA -White coolerwith 6halogen tracklights| © 2003 Planar Systems, Inc. Bay Area-SID, Adi - (21-Oct-03)
GLOBE - INTEGRATING SPHEREHalogenBulbsPhotometerFrontPortRearPortDisplayUnderTestHalogenBulbsDual Port Integrating Sphere| © 2003 Planar Systems, Inc. Bay Area-SID, Adi - (21-Oct-03)
GLOBE - INTEGRATING SPHERE¨ Purely diffuse light¨ Uniform angular illumination (5°~90°)¨ Display measured at normal¨ Almost no dimming capability (12~14 k-fC)¨ CCT ~ 2960 K¨ Significant display heating| © 2003 Planar Systems, Inc. Bay Area-SID, Adi - (21-Oct-03)
GLOBE - INTEGRATING SPHERE| © 2003 Planar Systems, Inc. Bay Area-SID, Adi - (21-Oct-03)
HALOGEN TRACK LAMPS¨ Diffuse reflectance system with halogen tracklights illuminating display from 30° right andmeasured at normal incidence¨ Fully dimmable up to 1000 fC¨ CCT range from 2300 K to 3000 K| © 2003 Planar Systems, Inc. Bay Area-SID, Adi - (21-Oct-03)
HALOGEN TRACK LAMPS (at 30° angle)| © 2003 Planar Systems, Inc. Bay Area-SID, Adi - (21-Oct-03)
HMI LAMP (1200 W)¨ Diffuse reflectance system with lamp oriented 30° to<strong>the</strong> right and 45° above <strong>the</strong> display and measuredfrom normal incidence¨ Non dimmable with an illuminance of approximately10,000 to 12,000 fC¨ Emission spectra resembles sunlight¨ CCT ~ 6380 K| © 2003 Planar Systems, Inc. Bay Area-SID, Adi - (21-Oct-03)
HMI LAMP (1200 W)| © 2003 Planar Systems, Inc. Bay Area-SID, Adi - (21-Oct-03)
CONOSCOPE (Eldim EZ Contrast 160D)¨ Conoscope measures all angles simultaneously (up to80°)¨ Illumination is from all angles, but brightest at normalincidence¨ Illuminance measured only 65 fC from 30°¨ CCT ~10,600 K| © 2003 Planar Systems, Inc. Bay Area-SID, Adi - (21-Oct-03)
CONOSCOPE (Eldim EZ Contrast 160D)| © 2003 Planar Systems, Inc. Bay Area-SID, Adi - (21-Oct-03)
TEST RESULTS¨¨Data of all methods was plottedData separated to two curvesAll Data plottedDiffuse Curve(All methods)Specular CurveSpecular Curve(All methods)| © 2003 Planar Systems, Inc. Bay Area-SID, Adi - (21-Oct-03)
Contrast Ratio1000100103ATI AMLCD DIFFUSE SOURCEHMI LampMilitaryGlobeTrack lights 30°10 5000 10000 15000Illumination Intensity (fC)| © 2003 Planar Systems, Inc. Bay Area-SID, Adi - (21-Oct-03)
EL 320.80.29 DIFFUSE SOURCES1000Contrast Ratio10010HMI LampMilitaryGlobeTrack lights 30°10 2000 4000 6000 8000 10000 12000 14000Illumination Intensity (fC)| © 2003 Planar Systems, Inc. Bay Area-SID, Adi - (21-Oct-03)
3ATI SPECULAR SOURCES1000Contrast Ratio10010EldimMilitaryVESA Cooler10 1000 2000 3000 4000 5000Illumination Intensity (fL)Note: The VESA measurement is a combination of diffuse and specular illuminance.| © 2003 Planar Systems, Inc. Bay Area-SID, Adi - (21-Oct-03)
EL 320.80.29 SPECULAR SOURCES1000Contrast Ratio10010EldimMilitaryVESA Cooler10 1000 2000 3000 4000 5000Illumination Intensity (fC)Note: The VESA measurement is a combination of diffuse and specular illuminance.| © 2003 Planar Systems, Inc. Bay Area-SID, Adi - (21-Oct-03)
EFFECT of CCT¨ Correlated Color Temperature (CCT) wasmeasured for each of <strong>the</strong> light sources¨ It was difficult to see a trend in <strong>the</strong> dataMethodIntegrating SphereMIL-Std-85762aVESA (cooler)Track (Halogen lamps)HMIELDIM 160 D-Refl.CCT2960 K2200 ~ 3000 K1900 ~ 3000 K2300 ~ 3000 K6380 K10,600 K| © 2003 Planar Systems, Inc. Bay Area-SID, Adi - (21-Oct-03)
ANALYSISWe will use Contrast Ratio (CR) computing for curvefitting:CR = (I on + I ref ) / (I(off + I refI on = Display brightness ONI off = Display brightness OFFI refI refref )ref = Intensity of light reflected from displayref = (%R diff × I diff ) + (%R spec × I spec )| © 2003 Planar Systems, Inc. Bay Area-SID, Adi - (21-Oct-03)
3ATI DIFFUSE TRENDLINESContrast Ratio100010010y = 2571.7x -0.5481Raw CR DataComputed Using ReflectanceTrendline (Power)10 2000 4000 6000 8000 10000 12000 14000Illumination Intensity (fC)| © 2003 Planar Systems, Inc. Bay Area-SID, Adi - (21-Oct-03)
EL DIFFUSE TRENDLINES1000Raw CR DataComputed Using ReflectanceTrendline (Power)Contrast Ratio10010y = 2325.2x -0.782810 2000 4000 6000 8000 10000 12000 14000Illumination Intensity (fC)| © 2003 Planar Systems, Inc. Bay Area-SID, Adi - (21-Oct-03)
3ATI SPECULAR TRENDLINESContrast Ratio100010010Raw CR DataComputed Using ReflectanceTrendline (Power)y = 724.42x -0.619310 500 1000 1500 2000 2500 3000 3500 4000 4500Luminance Intensity (fL)| © 2003 Planar Systems, Inc. Bay Area-SID, Adi - (21-Oct-03)
EL SPECULAR TRENDLINES1000Contrast Ratio10010Raw CR DataComputed Using ReflectanceTrendline (Power)1y = 177.68x -0.63390.10 500 1000 1500 2000 2500 3000 3500 4000 4500Luminance Intensity (fL)| © 2003 Planar Systems, Inc. Bay Area-SID, Adi - (21-Oct-03)
WHAT IF WE TAKE A HAZY DISPLAY?(e.g. AMLCD with AG)¨ We used a Toshiba Display (7”) with AGon <strong>the</strong> polarizer¨ We saw that <strong>the</strong> effect of Haze isincluded in <strong>the</strong> separate Specular &Diffuse measurements| © 2003 Planar Systems, Inc. Bay Area-SID, Adi - (21-Oct-03)
DIFFUSED MEASURED ANDCALCULATED (AMLCD with AG)AMLCD with AG (anti-glare)High Ambient CR - diffused, measured at 30° left10.0Contrast Ratio (CR)CR measuredCR calculated%Rd=1.71%1.00 2000 4000 6000 8000 10000 12000 14000Ambient - diffused (fL)| © 2003 Planar Systems, Inc. Bay Area-SID, Adi - (21-Oct-03)
SPECULAR MEASURED ANDCALCULATED (AMLCD with AG)Contrast Ratio (CR)10.0AMLCD with AG (Anti-glare)High Ambient CR - Specular (glare), measured at 30° leftCR measuredCR calculated%Rs=0.039%1.00 2000 4000 6000 8000Ambient specular (glare) fL| © 2003 Planar Systems, Inc. Bay Area-SID, Adi - (21-Oct-03)
VESA REFLECTANCE METHOD(AMLCD with AG)VESA Reflectance Measurement of HazeDisplayContrast Ratio20181614121086420CR0 500 1000 1500 2000 2500 3000Illuminance (fC)| © 2003 Planar Systems, Inc. Bay Area-SID, Adi - (21-Oct-03)
CR of AMLCD (AG) and EL DISPLAYSat HIGH AMBIENT DIFFUSE LIGHTContrast Ratio (CR)100010010Contrast ratio (CR) vs. AmbientDiffused LightAMLCD-AG atnormalEL-360-EP at30°left10 5000 10000 15000Ambient Light (diffused) fC| © 2003 Planar Systems, Inc. Bay Area-SID, Adi - (21-Oct-03)
3ATI HIGH AMBIENTCalculatedusing:Brightness =350 fLCR = 220:1%Rs = 0.80%%Rd = 0.05%Cointrast ratio (CR)1000100103ATI high ambient CR10 1000 2000 3000 4000 5000 6000 7000 8000 9000 10000diffusedspecularAmbient (diffuse-fC, specular-fL)| © 2003 Planar Systems, Inc. Bay Area-SID, Adi - (21-Oct-03)
3ATI HIGH AMBIENT (CR linear scale)Calculatedusing:Brightness =350 fLCR = 220:1%Rs = 0.80%%Rd = 0.05%Cointrast ratio (CR)2502252001751501251007550250diffusedspecular3ATI high ambient CR0 1000 2000 3000 4000 5000 6000 7000 8000 9000 10000Ambient (diffuse-fC, specular-fL)| © 2003 Planar Systems, Inc. Bay Area-SID, Adi - (21-Oct-03)
Calculatedusing:Brightness =350 fLCR = 220:1%Rs = 0.80%%Rd = 0.05%3ATI HIGH AMBIENT(combined diffuse & specular)CR2252001751501251007550250015003000450060007500900001400Ambientspecular (fL)200-225175-200150-175125-150100-12575-10050-7525-500-25Ambient diffused (fC)| © 2003 Planar Systems, Inc. Bay Area-SID, Adi - (21-Oct-03)
CONCLUSIONS¨ The MIL-85762ACR measurement systemallows independent measurement of bothspecular and diffuse reflectance.¨ It covers a wide range of illuminance forboth reflectance sources¨ It corresponds well with <strong>the</strong> o<strong>the</strong>r CRmeasurement systems evaluated¨ The system is simple and easy to use| © 2003 Planar Systems, Inc. Bay Area-SID, Adi - (21-Oct-03)
CONCLUSIONS (cont.)¨ CCT of light source does noteffect significantly¨ Hazy displays can be used aswell¨ Methods are generic for alloutdoor applications| © 2003 Planar Systems, Inc. Bay Area-SID, Adi - (21-Oct-03)
| © 2003 Planar Systems, Inc. Bay Area-SID, Adi - (21-Oct-03)


