Downloads - empirica
Downloads - empirica
Downloads - empirica

You also want an ePaper? Increase the reach of your titles
YUMPU automatically turns print PDFs into web optimized ePapers that Google loves.
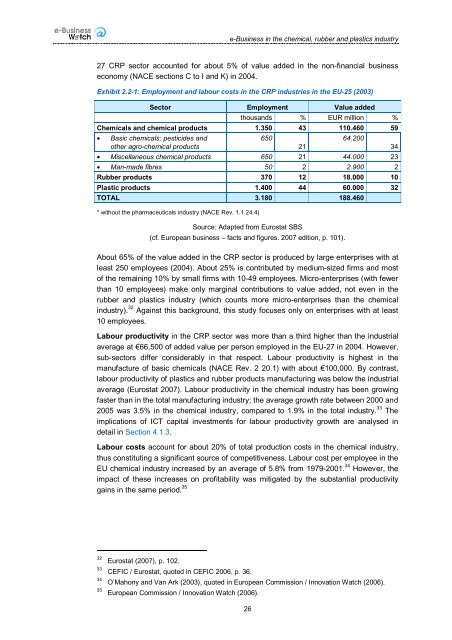
e-Business in the chemical, rubber and plastics industry27 CRP sector accounted for about 5% of value added in the non-financial businesseconomy (NACE sections C to I and K) in 2004.Exhibit 2.2-1: Employment and labour costs in the CRP industries in the EU-25 (2003)Sector Employment Value addedthousands % EUR million %Chemicals and chemical products 1.350 43 110.460 59• Basic chemicals; pesticides andother agro-chemical products6502164.200• Miscellaneous chemical products 650 21 44.000 23• Man-made fibres 50 2 2.900 2Rubber products 370 12 18.000 10Plastic products 1.400 44 60.000 32TOTAL 3.180 188.460* without the pharmaceuticals industry (NACE Rev. 1.1 24.4)Source: Adapted from Eurostat SBS(cf. European business – facts and figures. 2007 edition, p. 101).34About 65% of the value added in the CRP sector is produced by large enterprises with atleast 250 employees (2004). About 25% is contributed by medium-sized firms and mostof the remaining 10% by small firms with 10-49 employees. Micro-enterprises (with fewerthan 10 employees) make only marginal contributions to value added, not even in therubber and plastics industry (which counts more micro-enterprises than the chemicalindustry). 32 Against this background, this study focuses only on enterprises with at least10 employees.Labour productivity in the CRP sector was more than a third higher than the industrialaverage at €66,500 of added value per person employed in the EU-27 in 2004. However,sub-sectors differ considerably in that respect. Labour productivity is highest in themanufacture of basic chemicals (NACE Rev. 2 20.1) with about €100,000. By contrast,labour productivity of plastics and rubber products manufacturing was below the industrialaverage (Eurostat 2007). Labour productivity in the chemical industry has been growingfaster than in the total manufacturing industry; the average growth rate between 2000 and2005 was 3.5% in the chemical industry, compared to 1.9% in the total industry. 33 Theimplications of ICT capital investments for labour productivity growth are analysed indetail in Section 4.1.3.Labour costs account for about 20% of total production costs in the chemical industry,thus constituting a significant source of competitiveness. Labour cost per employee in theEU chemical industry increased by an average of 5.8% from 1979-2001. 34 However, theimpact of these increases on profitability was mitigated by the substantial productivitygains in the same period. 3532333435Eurostat (2007), p. 102.CEFIC / Eurostat, quoted in CEFIC 2006, p. 36.O’Mahony and Van Ark (2003), quoted in European Commission / Innovation Watch (2006).European Commission / Innovation Watch (2006).26