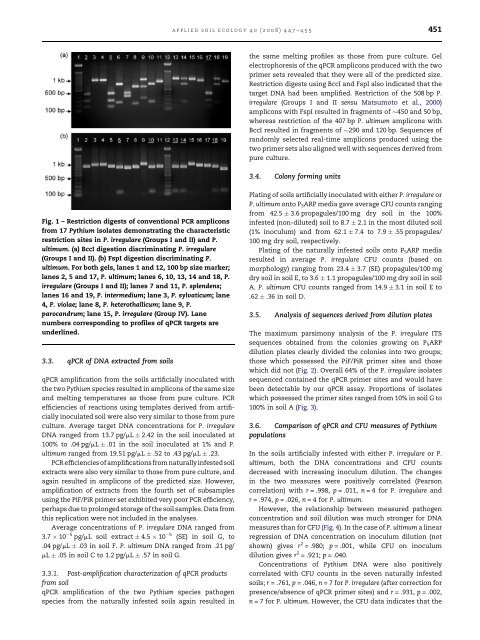
450applied soil ecology 40 (2008) 447–455reactions, temperature transition rates were 20 8C/s and thefluorescent signal was acquired at 72 8C. After cycl<strong>in</strong>g, melt<strong>in</strong>gcurves were generated by <strong>in</strong>creas<strong>in</strong>g the temperature from 65to 95 8C at a rate <strong>of</strong> 0.1 8C/s with cont<strong>in</strong>uous acquisition <strong>of</strong> thefluorescent signal.For the naturally <strong>in</strong>fested <strong>soils</strong>, qPCR was carried out as forartificially <strong>in</strong>fested <strong>soils</strong>, except that each crude DNA extract(one from each <strong>of</strong> four subsamples <strong>of</strong> each <strong>of</strong> the seven <strong>soils</strong>)was split <strong>in</strong>to three parallel extraction replicates after the firstcentrifugation and prior to purification and amplification. Thisallowed for <strong>in</strong>creased precision <strong>in</strong> situations with very lowlevels <strong>of</strong> target DNA.2.4.1. Post amplification characterization <strong>of</strong> qPCR productsqPCR products amplified from soil extracts were run onagarose gels and sta<strong>in</strong>ed with ethidium bromide to confirm theproduct size. For each soil sample which successfullyamplified us<strong>in</strong>g either primer set, one <strong>of</strong> the amplicons fromthe three parallel extractions for that sample was restrictedwith either FspI or Bcc I (as above), to further confirm theidentity <strong>of</strong> the amplified DNA. One real-time ampliconproduced with each primer set, was also randomly selectedand sequenced.2.4.2. Analysis <strong>of</strong> qPCR dataqPCR data generated by the light cycler was analyzed us<strong>in</strong>gL<strong>in</strong>RegPCR s<strong>of</strong>tware (Ramakers et al., 2003). For each set <strong>of</strong> PCRreactions (each Light Cycler carousel) the logarithms <strong>of</strong> the<strong>in</strong>itial fluorescence (N 0 calculated by L<strong>in</strong>RegPCR) for the serialdilutions <strong>of</strong> quantified reference DNA were plotted aga<strong>in</strong>st thelogarithms <strong>of</strong> their actual DNA concentrations. The equation<strong>of</strong> the result<strong>in</strong>g l<strong>in</strong>e was then used to estimate the <strong>in</strong>itialconcentration <strong>of</strong> target DNA templates from the soil samples.This approach does not require (or assume) equal PCRamplification efficiencies and accounts for any variation <strong>in</strong>amplification efficiency among sets <strong>of</strong> PCR reactions(Ramakers et al., 2003).2.5. Dilution plat<strong>in</strong>gThe number <strong>of</strong> colony form<strong>in</strong>g units per gram dry soil wasdeterm<strong>in</strong>ed for both artificially and naturally <strong>in</strong>fested <strong>soils</strong>us<strong>in</strong>g P 5 ARP soil dilution plates as described above, but us<strong>in</strong>gsoil:water agar dilutions <strong>of</strong> 1:10 and 1:100. Three 10 g aliquots<strong>of</strong> each soil were oven-dried at 104 8C for 3 days. Oven-dryweights were used to determ<strong>in</strong>e soil moisture; plate countdata were then adjusted to a CFU per g dry soil basis. Isolates <strong>of</strong><strong>Pythium</strong> spp. from each field were identified morphologicallyon the basis <strong>of</strong> Middleton (1952), Waterhouse (1967) and Vander Plaats-Niter<strong>in</strong>k (1981). Pearson correlations between theresult<strong>in</strong>g CFU data and the qPCR data were calculated <strong>in</strong> SPSSrelease 13.0 (SPSS Inc. Chicago, IL) us<strong>in</strong>g non-transformeddata.2.6. Sequenc<strong>in</strong>g <strong>of</strong> dilution plate coloniesDue to the presence <strong>of</strong> cryptic species <strong>in</strong> the P. irregularecomplex, not all <strong>of</strong> the isolates morphologically identified asP. irregulare possessed the PiF/PiR primer sites and wouldtherefore not be detected by our assay. In order to correlateour qPCR and CFU data sets from naturally <strong>in</strong>fested <strong>soils</strong>, itwas necessary to determ<strong>in</strong>e the proportion <strong>of</strong> colonyform<strong>in</strong>g units that possessed PiF/PiR primer sites and adjustthe qPCR data for P. irregulare from naturally <strong>in</strong>fested <strong>soils</strong>accord<strong>in</strong>gly. Representative dilution plate colonies morphologicallyidentified as P. irregulare were sequenced us<strong>in</strong>g theprimer sets ITS1/ITS4 or ITS5/ITS4 (White et al., 1990) asdescribed above. The 83 result<strong>in</strong>g ITS sequences were thenaligned with reference sequences from Genbank us<strong>in</strong>gClustal X (Thompson et al., 1997) and then manuallyadjusted us<strong>in</strong>g Bioedit (Ver. 5.0.6) (Hall, 1999). Maximumparsimony analysis was then performed us<strong>in</strong>g PAUP* version4beta 10 (Swafford, 1998) withPhytopthora c<strong>in</strong>namomi Randsas an outgroup, TBR branch swapp<strong>in</strong>g and 100 bootstrapreplications.3. Results3.1. Specificity <strong>of</strong> qPCR primersqPCR us<strong>in</strong>g the taxon specific primer pairs PiF/PiR and PuF/PuRon P. irregulare (PID008) and P. ultimum (PID095) DNA from purecultures (at between 100 and 1 pg/mL extract) producedamplicons with melt<strong>in</strong>g po<strong>in</strong>ts at 87.5 and 82.3 8C, respectively.The melt<strong>in</strong>g pr<strong>of</strong>iles <strong>of</strong> P. irregulare amplicons also<strong>in</strong>cluded a secondary peak at 82 8C, likely due to a highly ATrich region <strong>in</strong> the center <strong>of</strong> the amplicon (see Li et al., 2003).This melt<strong>in</strong>g pr<strong>of</strong>ile is also predicted by the analysis <strong>of</strong> P.irregulare ITS sequences us<strong>in</strong>g the Poland algorithm (Steger,1994). Post amplification gel electrophoresis also revealed thatall amplicons were <strong>of</strong> the predicted sizes. Average PCRefficiencies, calculated us<strong>in</strong>g L<strong>in</strong>RegPCR (Ramakers et al.,2003), were 1.51 and 1.68 (<strong>of</strong> a maximum possible value <strong>of</strong> 2.0)respectively.Test<strong>in</strong>g <strong>of</strong> the two primer pairs aga<strong>in</strong>st a range <strong>of</strong> relatedspecies <strong>in</strong>dicated that they were highly specific under theamplification parameters used. Only DNA from P. irregulare(Groups I and II) and P. ultimum resulted <strong>in</strong> qPCR ampliconsus<strong>in</strong>g PiF/PiR and PuF/PuR, respectively (Table 1). All DNAextracts tested produced conventional PCR products us<strong>in</strong>g thenon-specific primers ITS1/ITS4 (White et al., 1990), <strong>in</strong>dicat<strong>in</strong>gthe presence <strong>of</strong> amplifiable templates.3.2. Specificity <strong>of</strong> restriction digestsFspI and BccI digests <strong>of</strong> conventional PCR products generatedfrom 17 <strong>Pythium</strong> isolates us<strong>in</strong>g primers ITS1–ITS4 (Table 1)resulted <strong>in</strong> characteristic restriction fragment patterns for P.irregulare (Groups I and II) and P. ultimum, respectively. Therestriction patterns clearly dist<strong>in</strong>guished the two targetamplicons from each other and from those <strong>of</strong> all other <strong>Pythium</strong>species tested (Fig. 1).Although the taxon specific primers used for qPCRamplification <strong>of</strong> the target <strong>Pythium</strong> species (PiF/PiR and PuF/PuR) are <strong>in</strong>ternal to the ITS primers used for the conventionalPCR, one characteristic restriction site was still present <strong>in</strong> each<strong>of</strong> the qPCR amplicons, allow<strong>in</strong>g us to confirm targetamplification by digest<strong>in</strong>g the qPCR products with FspI andBccI.
applied soil ecology 40 (2008) 447–455 451the same melt<strong>in</strong>g pr<strong>of</strong>iles as those from pure culture. Gelelectrophoresis <strong>of</strong> the qPCR amplicons produced with the twoprimer sets revealed that they were all <strong>of</strong> the predicted size.Restriction digests us<strong>in</strong>g BccI and FspI also <strong>in</strong>dicated that thetarget DNA had been amplified. Restriction <strong>of</strong> the 508 bp P.irregulare (Groups I and II sensu Matsumoto et al., 2000)amplicons with FspI resulted <strong>in</strong> fragments <strong>of</strong> 450 and 50 bp,whereas restriction <strong>of</strong> the 407 bp P. ultimum amplicons withBccI resulted <strong>in</strong> fragments <strong>of</strong> 290 and 120 bp. Sequences <strong>of</strong>randomly selected real-time amplicons produced us<strong>in</strong>g thetwo primer sets also aligned well with sequences derived frompure culture.3.4. Colony form<strong>in</strong>g unitsFig. 1 – Restriction digests <strong>of</strong> conventional PCR ampliconsfrom 17 <strong>Pythium</strong> isolates demonstrat<strong>in</strong>g the characteristicrestriction sites <strong>in</strong> P. irregulare (Groups I and II) and P.ultimum. (a) BccI digestion discrim<strong>in</strong>at<strong>in</strong>g P. irregulare(Groups I and II). (b) FspI digestion discrim<strong>in</strong>at<strong>in</strong>g P.ultimum. For both gels, lanes 1 and 12, 100 bp size marker;lanes 2, 5 and 17, P. ultimum; lanes 6, 10, 13, 14 and 18, P.irregulare (Groups I and II); lanes 7 and 11, P. splendens;lanes 16 and 19, P. <strong>in</strong>termedium; lane 3, P. sylvaticum; lane4, P. violae; lane 8, P. heterothallicum; lane 9, P.parocandrum; lane 15, P. irregulare (Group IV). Lanenumbers correspond<strong>in</strong>g to pr<strong>of</strong>iles <strong>of</strong> qPCR targets areunderl<strong>in</strong>ed.3.3. qPCR <strong>of</strong> DNA extracted from <strong>soils</strong>qPCR amplification from the <strong>soils</strong> artificially <strong>in</strong>oculated withthe two <strong>Pythium</strong> species resulted <strong>in</strong> amplicons <strong>of</strong> the same sizeand melt<strong>in</strong>g temperatures as those from pure culture. PCRefficiencies <strong>of</strong> reactions us<strong>in</strong>g templates derived from artificially<strong>in</strong>oculated soil were also very similar to those from pureculture. Average target DNA concentrations for P. irregulareDNA ranged from 13.7 pg/mL 2.42 <strong>in</strong> the soil <strong>in</strong>oculated at100% to .04 pg/mL .01 <strong>in</strong> the soil <strong>in</strong>oculated at 1% and P.ultimum ranged from 19.51 pg/mL .52 to .43 pg/mL .23.PCR efficiencies <strong>of</strong> amplifications from naturally <strong>in</strong>fested soilextracts were also very similar to those from pure culture, andaga<strong>in</strong> resulted <strong>in</strong> amplicons <strong>of</strong> the predicted size. However,amplification <strong>of</strong> extracts from the fourth set <strong>of</strong> subsamplesus<strong>in</strong>g the PiF/PiR primer set exhibited very poor PCR efficiency,perhaps due to prolonged storage <strong>of</strong> the soil samples. Data fromthis replication were not <strong>in</strong>cluded <strong>in</strong> the analyses.Average concentrations <strong>of</strong> P. irregulare DNA ranged from3.7 10 5 pg/mL soil extract 4.5 10 5 (SE) <strong>in</strong> soil G, to.04 pg/mL .03 <strong>in</strong> soil F. P. ultimum DNA ranged from .21 pg/mL .05 <strong>in</strong> soil C to 1.2 pg/mL .57 <strong>in</strong> soil G.3.3.1. Post-amplification characterization <strong>of</strong> qPCR productsfrom soilqPCR amplification <strong>of</strong> the two <strong>Pythium</strong> species pathogenspecies from the naturally <strong>in</strong>fested <strong>soils</strong> aga<strong>in</strong> resulted <strong>in</strong>Plat<strong>in</strong>g <strong>of</strong> <strong>soils</strong> artificially <strong>in</strong>oculated with either P. irregulare orP. ultimum onto P 5 ARP media gave average CFU counts rang<strong>in</strong>gfrom 42.5 3.6 propagules/100 mg dry soil <strong>in</strong> the 100%<strong>in</strong>fested (non-diluted) soil to 8.7 2.1 <strong>in</strong> the most diluted soil(1% <strong>in</strong>oculum) and from 62.1 7.4 to 7.9 .55 propagules/100 mg dry soil, respectively.Plat<strong>in</strong>g <strong>of</strong> the naturally <strong>in</strong>fested <strong>soils</strong> onto P 5 ARP mediaresulted <strong>in</strong> average P. irregulare CFU counts (based onmorphology) rang<strong>in</strong>g from 23.4 3.7 (SE) propagules/100 mgdry soil <strong>in</strong> soil E, to 3.6 1.1 propagules/100 mg dry soil <strong>in</strong> soilA. P. ultimum CFU counts ranged from 14.9 3.1 <strong>in</strong> soil E to.62 .36 <strong>in</strong> soil D.3.5. Analysis <strong>of</strong> sequences derived from dilution platesThe maximum parsimony analysis <strong>of</strong> the P. irregulare ITSsequences obta<strong>in</strong>ed from the colonies grow<strong>in</strong>g on P 5 ARPdilution plates clearly divided the colonies <strong>in</strong>to two groups;those which possessed the PiF/PiR primer sites and thosewhich did not (Fig. 2). Overall 64% <strong>of</strong> the P. irregulare isolatessequenced conta<strong>in</strong>ed the qPCR primer sites and would havebeen detectable by our qPCR assay. Proportions <strong>of</strong> isolateswhich possessed the primer sites ranged from 10% <strong>in</strong> soil G to100% <strong>in</strong> soil A (Fig. 3).3.6. Comparison <strong>of</strong> qPCR and CFU measures <strong>of</strong> <strong>Pythium</strong><strong>populations</strong>In the <strong>soils</strong> artificially <strong>in</strong>fested with either P. irregulare or P.ultimum, both the DNA concentrations and CFU countsdecreased with <strong>in</strong>creas<strong>in</strong>g <strong>in</strong>oculum dilution. The changes<strong>in</strong> the two measures were positively correlated (Pearsoncorrelation) with r = .998, p = .011, n = 4 for P. irregulare andr = .974, p = .026, n = 4 for P. ultimum.However, the relationship between measured pathogenconcentration and soil dilution was much stronger for DNAmeasures than for CFU (Fig. 4). In the case <strong>of</strong> P. ultimum a l<strong>in</strong>earregression <strong>of</strong> DNA concentration on <strong>in</strong>oculum dilution (notshown) gives r 2 = .980; p = .001, while CFU on <strong>in</strong>oculumdilution gives r 2 = .921; p = .040.Concentrations <strong>of</strong> <strong>Pythium</strong> DNA were also positivelycorrelated with CFU counts <strong>in</strong> the seven naturally <strong>in</strong>fested<strong>soils</strong>; r = .761, p = .046, n = 7 for P. irregulare (after correction forpresence/absence <strong>of</strong> qPCR primer sites) and r = .931, p = .002,n = 7 for P. ultimum. However, the CFU data <strong>in</strong>dicates that the