The Pharmaceutical Price Regulation Scheme - Office of Fair Trading
The Pharmaceutical Price Regulation Scheme - Office of Fair Trading
The Pharmaceutical Price Regulation Scheme - Office of Fair Trading

Create successful ePaper yourself
Turn your PDF publications into a flip-book with our unique Google optimized e-Paper software.
<strong>The</strong> <strong>Pharmaceutical</strong> <strong>Price</strong><strong>Regulation</strong> <strong>Scheme</strong>An OFT market study
© Crown copyright 2007This publication (excluding the OFT logo) may be reproduced free <strong>of</strong> charge in any format or mediumprovided that it is reproduced accurately and not used in a misleading context.<strong>The</strong> material must be acknowledged as crown copyright and the title <strong>of</strong> the publication specified.
February 2007CONTENTSChapterPageExecutive summary 11 Introduction 92 Markets for prescription pharmaceuticals in the NHS 123 Drug prices and global investment incentives 374 Evaluation <strong>of</strong> current pricing and reimbursement arrangements 545 Options for reform 696 Recommendations and institutional framework 104
February 2007EXECUTIVE SUMMARYKey recommendations• We recommend that Government reform the PPRS, replacing current pr<strong>of</strong>it and pricecontrols with a value-based approach to pricing, which would ensure the price <strong>of</strong> drugsreflect their clinical and therapeutic value to patients and the broader NHS.• We believe this would provide major benefits to patients and innovative companies inthe short and long term:– value for money for the NHS: we have identified hundreds <strong>of</strong> millions <strong>of</strong> pounds <strong>of</strong>expenditure per year that could be used more cost effectively under value-based pricing,allowing patients greater access to drugs and other healthcare benefits they arecurrently being denied. In short, the same level <strong>of</strong> expenditure could be used to producegreater benefits for patients.– better incentives to invest: more value-reflective prices would give companies muchstronger incentives to invest in the drugs that are most beneficial to society, particularlyin areas <strong>of</strong> unmet patient need. Given the international importance <strong>of</strong> UK prices, thesebenefits would be felt not just in the UK, but globally.– a stable, sustainable system: these reforms would improve stability for Governmentand industry in the long run, by avoiding reliance on increasingly arbitrary pr<strong>of</strong>it and pricecontrols and ensuring instead that future pricing decisions are based on an informed,rational debate about how to make the best use <strong>of</strong> available NHS resources.• International experience shows that value-based pricing can work well in countries that havefewer resources than we enjoy in the UK but companies have highlighted key issues thatneed to be addressed in ensuring effective implementation. We believe we have met theseconcerns in developing options for reform that will provide a credible, practical pricingregime for the long term.<strong>The</strong> Role <strong>of</strong> the PPRSPrescription medicines help improve the lives <strong>of</strong> millions <strong>of</strong> patients in the UK. Newbreakthrough drugs are brought to market every year, such as those recently developed totreat various forms <strong>of</strong> cancer and severe forms <strong>of</strong> disabling arthritis. <strong>The</strong>se join moreestablished medicines such as aspirin, which still saves many thousands <strong>of</strong> lives per year inits applications in cardiovascular medicine and against life-threatening inflammations.<strong>The</strong> NHS spends about £11 billion a year on these treatments, £8 billion <strong>of</strong> which is onbranded drugs. This is a study <strong>of</strong> the <strong>Pharmaceutical</strong> <strong>Price</strong> <strong>Regulation</strong> <strong>Scheme</strong> (PPRS), one <strong>of</strong>the main instruments employed by the UK Health Departments to control NHS expenditureon these branded drugs.<strong>The</strong> aims <strong>of</strong> the scheme are to secure value for money for the NHS while providingpharmaceutical companies with the right incentives to invest in new and useful drugs for thefuture. <strong>The</strong> remit <strong>of</strong> this study, launched by the OFT in September 2005, is to assess whetherthe PPRS is effective in meeting its high-level objectives, or whether there is a case for reform.<strong>The</strong> workings <strong>of</strong> the scheme are complex, but at a broad level it comprises two main components:• pr<strong>of</strong>it controls, which set a maximum level for the pr<strong>of</strong>its that a company may earnfrom the supply <strong>of</strong> branded drugs to the NHS. Exceeding this level will require arepayment <strong>of</strong> excess pr<strong>of</strong>its to DH. <strong>The</strong> pr<strong>of</strong>it control also enables companies toincrease prices if their pr<strong>of</strong>its fall below a given minimum.1
<strong>The</strong> <strong>Pharmaceutical</strong> <strong>Price</strong> <strong>Regulation</strong> <strong>Scheme</strong>• price controls, which give companies freedom to set the initial price <strong>of</strong> new activesubstances but impose restrictions on subsequent price increases. <strong>The</strong>y also compriseprice cuts, which are agreed at the time <strong>of</strong> scheme renegotiations. A seven per centcut was imposed as part <strong>of</strong> the negotiation <strong>of</strong> the current PPRS scheme beginning in2005. Companies are given some flexibility in deciding which products to target incutting prices, a system known as price modulation.A major reason for the existence <strong>of</strong> a UK-wide drug pricing scheme is the difficulty theNHS has in ensuring drugs are prescribed in a way that delivers value for money.Informational and incentive problems result in a situation in which prescribers are <strong>of</strong>ten notsensitive to or even aware <strong>of</strong> the prices <strong>of</strong> the drugs they prescribe. This is particularly thecase in primary care, which accounts for some 75 per cent <strong>of</strong> pharmaceutical expenditure inthe NHS. Evidence we have collected from a survey <strong>of</strong> 1000 GPs suggests they have weakknowledge <strong>of</strong> the prices <strong>of</strong> some <strong>of</strong> the most widely-prescribed drugs in the UK.Moreover, under current arrangements, there are high levels <strong>of</strong> prescribing for some productsthat cost much more than available substitutes but deliver very similar benefits to patients.This raises a major question as to whether value for money is being secured. Neither arepatients price sensitive: they contribute through prescription charges to less than five percent <strong>of</strong> expenditure on prescription pharmaceuticals – a lower rate than in almost all othercountries in the world.<strong>The</strong>se demand side problems provide a compelling argument for some form <strong>of</strong> pricingscheme. In seeking to address them, the PPRS works in conjunction with a wide range <strong>of</strong>mechanisms and institutions designed to encourage cost effective prescribing behaviour at alocal and national level. Notable among these are the bodies charged with evaluating the costeffectiveness <strong>of</strong> drugs and other medical interventions in the UK: the National Institute forHealth and Clinical Excellence (NICE), which operates in England and Wales; the ScottishMedicines Consortium (SMC), which operates in Scotland; and the All Wales MedicinesStrategy Group (AWMSG), which operates in Wales.<strong>The</strong>refore, despite its name, we do not consider the scheme to be a regulatory mechanism inthe true sense <strong>of</strong> the word. It is best thought <strong>of</strong> as an attempt to exercise buyer power in thepurchase <strong>of</strong> prescription pharmaceuticals by the NHS across the UK, to meet the interests <strong>of</strong>patients both in the short run (through helping to maximise benefits from available resources)and the long run (through the continued supply <strong>of</strong> new and useful drugs in the future).Assessment <strong>of</strong> the <strong>Scheme</strong><strong>The</strong> scheme has been in place for almost fifty years. Many companies view it positivelycompared with alternatives that exist in a number <strong>of</strong> countries. In particular, they value therelative stability it affords them, since it insulates them to a degree from opportunistic behaviourduring the five year term <strong>of</strong> the scheme. This stability has been reduced in their eyes, however,by the arbitrary nature and increasing size <strong>of</strong> the price cuts implemented during PPRSnegotiations. <strong>The</strong> scheme also allows drugs to come onto the UK market rapidly without theneed for lengthy up front price negotiations. Again, this is <strong>of</strong>fset, however, by the fact that thesubsequent uptake <strong>of</strong> these drugs by prescribers is low by international standards.For the NHS, PPRS price cuts deliver savings in primary care. <strong>The</strong>se amounted to about £450million in the UK in 2005. <strong>The</strong> effect <strong>of</strong> the cut reduces over time as drugs that have beensubject to a cut are replaced by new drugs at uncontrolled prices. <strong>The</strong> effect <strong>of</strong> the cut onhospital prices is less clear – as the PPRS affects list prices rather than the transaction pricesat which hospitals purchase – and several trusts have given us evidence showing the 2005cut did not generate savings for them.2
February 2007<strong>The</strong> scheme is also light on direct administration costs for the public purse. <strong>The</strong> PPRS teamat the Department <strong>of</strong> Health (DH) is highly competent and pr<strong>of</strong>essional, and operates a verycomplex scheme with minimal resources.Pr<strong>of</strong>it and price controls do not reflect the value <strong>of</strong> drugsHowever, we have an overriding concern with the scheme as it is currently designed: neitherthe pr<strong>of</strong>it cap nor the price cut helps secure prices that reflect the therapeutic value <strong>of</strong> thedrugs companies are supplying to the NHS. For a scheme that sets out to deliver value formoney for the NHS and give companies the right incentives to invest, we consider this to bea major shortcoming, particularly in view <strong>of</strong> the demand side problems we have identified inthe rest <strong>of</strong> the NHS.Pr<strong>of</strong>it capIt is clearly right that the NHS should seek to constrain what it spends on drugs, but we believeregulating pr<strong>of</strong>its is a very indirect means <strong>of</strong> doing so, and one that is ill-suited to an innovativesector such as pharmaceuticals. <strong>The</strong> possibility <strong>of</strong> earning high (or low) pr<strong>of</strong>its provides a strongincentive to companies to produce valuable drugs for patients. Imposing maximum andminimum allowed levels <strong>of</strong> pr<strong>of</strong>its in a way that takes no account <strong>of</strong> the value <strong>of</strong> drugsproduced by a firm dulls those incentives. Our analysis has also identified a number <strong>of</strong> majorpractical difficulties in making meaningful pr<strong>of</strong>itability assessments in the pharmaceutical sector– not least the fact that companies have an increasingly global cost base and a high level <strong>of</strong>intangible capital, which is only indirectly recognised through the scheme.We have found that, perhaps as a result <strong>of</strong> these sorts <strong>of</strong> arguments, there has been asignificant reduction in the importance <strong>of</strong> pr<strong>of</strong>it controls within the PPRS in recent years.Cost allowances have been made more generous and the band between maximum andminimum allowed pr<strong>of</strong>it levels has been widened. As a result, pr<strong>of</strong>it repayments in the1999 – 2004 <strong>Scheme</strong> were negligible, with repayments representing only about 0.01 per cent<strong>of</strong> company PPRS revenues over the period. Pr<strong>of</strong>it controls are therefore not a bindingconstraint for most companies, although some small UK-based companies with high levels <strong>of</strong>R&D expenditure may potentially be adversely affected.<strong>Price</strong> cuts<strong>The</strong> one-<strong>of</strong>f price cuts imposed across a company's products similarly take no account <strong>of</strong> thevalue <strong>of</strong> these products to patients. Given freedom <strong>of</strong> pricing up front and demand sideproblems, one supplier may be producing drugs that are particularly cost effective whileanother may not. Under the PPRS both have to reduce their average prices by the samepercentage. Again, this is not consistent with value for money or good investment incentives.<strong>Price</strong> cuts may also affect smaller companies to a greater extent as they are less able tospread the effects <strong>of</strong> the cut over a broad portfolio <strong>of</strong> drugs.<strong>The</strong> overall level <strong>of</strong> the cut is unrelated to objective criteria. Since companies have freedomto set prices initially, the more price cuts become a regular feature <strong>of</strong> the PPRS, the morefirms are likely to anticipate them in setting initial prices (at the optimal price plus anticipatedpercentage price cut) particularly towards the end <strong>of</strong> a given PPRS period. If this continues,price setting risks becoming a strategic game in which firms attempt to guess the level <strong>of</strong>forthcoming price cuts and DH attempts to second guess this effect in setting the level <strong>of</strong>price cuts. We do not consider this to be a sustainable model <strong>of</strong> pricing for the future.3
<strong>The</strong> <strong>Pharmaceutical</strong> <strong>Price</strong> <strong>Regulation</strong> <strong>Scheme</strong>OutcomesDemand side problems in the broader NHS lead to prescribing that in some major cases isnot cost effective. In our view, the fact that existing PPRS controls do not take account <strong>of</strong> thetherapeutic value <strong>of</strong> drugs significantly undermines the extent to which they can addressthese problems and secure value for money for the NHS.Under current pricing arrangements, drugs that have very similar clinical effects can have widelydivergent prices – we have observed price differences <strong>of</strong> 500% or more for very closesubstitutes. Reviewing some major drug categories on an indicative basis we identified over£500 million <strong>of</strong> expenditure in 2005 that could have been put to more cost effective uses. Forone drug alone we estimate that the use <strong>of</strong> more value-reflective prices could potentially havesaved £350 million in that year for use on other drugs and treatments. For <strong>of</strong>f-patent brandswith chemically identical generics some £65 million could have been saved.Effect on patientsThis has major effects on patients. Where prices are out <strong>of</strong> line with value, the NHS is notmaking the best use <strong>of</strong> available resources to improve patient health. <strong>The</strong> effects <strong>of</strong> this arefelt by patients through reduced access to both drugs and other forms <strong>of</strong> healthcare. Forexample, if too much is spent on an existing drug, Primary Care Organisations may have tobalance their budgets by restricting access to new, innovative drugs or by reducing electivecare procured in hospitals for a given period.<strong>The</strong>se trade <strong>of</strong>fs are shown most clearly in the work <strong>of</strong> NICE, SMC and AWMSG. NICE, forexample, has recently rejected a number <strong>of</strong> new cancer drugs partly on the basis <strong>of</strong> cost tothe NHS. <strong>The</strong>se difficult choices are inevitable given the limited resources the NHS has at itsdisposal and we welcome the creation <strong>of</strong> NICE, SMC and AWMSG as important movestowards a fairer and more efficient system <strong>of</strong> deciding how to use NHS resources. Butwhere access is restricted on cost effectiveness grounds, it is vitally important that all drugs– old and new – are assessed on the same basis. This does not happen across the boardunder current arrangements because <strong>of</strong> the limited remits these bodies have been given.To restrict access to new treatments while ignoring inefficiencies in current expenditure isnot an efficient use <strong>of</strong> resources. Nor is it in the interests <strong>of</strong> patients.Effect on investmentWhen the prices <strong>of</strong> medicines are inefficient this will also distort the investment incentives <strong>of</strong>firms. Specifically, companies will not be given the right incentives to invest in drugs that aremost beneficial to society, including areas <strong>of</strong> unmet clinical demand. We have found that UKprices are likely to have a significant effect on incentives to invest since, although UKrevenues represent only about four per cent <strong>of</strong> global demand, other countries set many <strong>of</strong>their prices with reference to those in the UK. Together these countries account for around25 per cent <strong>of</strong> global demand. Furthermore, our international research has confirmed that UKprices are used in implicit price comparisons (that is, as part <strong>of</strong> company / countrynegotiations) even where they are not used in formal international reference price schemes.More value-reflective prices in the UK could therefore bring major gains over time as theydrive investment in areas <strong>of</strong> clinical need.Our focus in this study is not on whether aggregate expenditure on drugs in the UK is toohigh – this is a matter for central Government. Rather we believe that the NHS could makebetter use <strong>of</strong> the resources it has – the efficiency savings we have identified could be usedto improve access to and uptake <strong>of</strong> innovative and effective medicines that will have asignificant effect on patients’ lives. We note that DH analysis suggests that overall prices in4
February 2007the UK have historically been higher than the rest <strong>of</strong> Europe, but that the situation changedafter the 2005 price cut. UK prices in that year were not the highest in Europe but in theupper half <strong>of</strong> the range. In general, we would expect the effect <strong>of</strong> the price cut to bestrongest in the year in which it is introduced. <strong>The</strong>refore it is not clear whether this is atemporary or longer term realignment <strong>of</strong> prices. We are aware that price comparisons aresensitive to a range <strong>of</strong> factors, such as the choice <strong>of</strong> comparator products and exchangerates. <strong>The</strong>y also ignore the effect <strong>of</strong> rebates between companies and payers, which areparticularly important in the higher priced countries such as the US and Germany andtherefore will tend to overstate prices in those countries with reference to those in the UK.Several stakeholders have expressed to us the view that the scheme should be considered asan instrument <strong>of</strong> industrial policy (that is, as a means <strong>of</strong> attracting R&D investment into theUK). We have found that the scheme itself does not provide explicit incentives for companiesto invest in the UK (the R&D allowances under the scheme apply to R&D wherever in theworld it is undertaken, not just to R&D incurred in the UK). Furthermore, the scheme could notbe revised in the future to provide such explicit incentives. Any attempt to <strong>of</strong>fer firms betterprices if they located in the UK would almost certainly fall foul <strong>of</strong> EU legislation on state aidand the free movement <strong>of</strong> goods. <strong>The</strong> Government has much more effective instruments atits disposal for attracting investment into the UK, such as investing in the scientific skill baseor improving the environment for clinical trials. Examples <strong>of</strong> initiatives that do this, such as thecreation <strong>of</strong> the UK Clinical Research Collaboration, are to be welcomed.Options for reformWe have considered a number <strong>of</strong> options for reform in the course <strong>of</strong> the study. Some involveincremental changes to existing instruments, such as amendments to the pr<strong>of</strong>it cap toaddress the potential disadvantage to which small firms are put under current arrangements.This could include smoothing the assessment <strong>of</strong> pr<strong>of</strong>itability over time or allowing an R&Dallowance that is more commensurate with small companies’ global R&D / sales ratios.However, while such measures may bring small improvements, they would not address thefundamental concerns we have with existing arrangements. To ensure value for money fromNHS expenditure and give good, stable investment incentives to companies in the long run,there is a compelling case for reform <strong>of</strong> the scheme towards a value-based pricingsystem that would relate the prices <strong>of</strong> products to their clinical value relative to existingtreatments.For on-patent brands, this report sets out in detail the key principles that we think shouldguide reform and the many different design options that need to be considered. But it ispossible, at a high level, to identify two broad options.<strong>The</strong> first option – which we have called ex post value-based pricing – would involveretaining up front freedom <strong>of</strong> pricing for companies for new active substances but wouldreplace company-wide pr<strong>of</strong>it controls and price cuts with a series <strong>of</strong> ex post reviews <strong>of</strong> thecost effectiveness <strong>of</strong> individual drugs or drug classes. <strong>The</strong>se reviews would set a maximumprice for a product in accordance with the clinical benefits it delivers relative to an appropriatecomparator. <strong>The</strong> timing <strong>of</strong> reviews would be designed to coincide with major events (such asnew drugs entering the market, comparators going <strong>of</strong>f patent, or the results <strong>of</strong> Phase 4 trialsproviding new clinical information). <strong>The</strong> timing <strong>of</strong> reviews and principles to inform them couldbe set out in a PPRS-style framework agreement between industry and government.<strong>The</strong> second option – ex ante value-based pricing – would again replace PPRS pr<strong>of</strong>it andprice controls. In addition to the ex post reviews for existing drugs, it would involve a fasttrack ex ante assessment <strong>of</strong> a new drug’s cost effectiveness (starting during the licensing5
<strong>The</strong> <strong>Pharmaceutical</strong> <strong>Price</strong> <strong>Regulation</strong> <strong>Scheme</strong>process). Where there is sufficient cost effectiveness data to make a judgement, a rapiddecision could be made on the appropriate maximum price (again, reflecting the benefits <strong>of</strong> aproduct relative to those <strong>of</strong> an appropriate comparator) and a decision to reimburse or not.Where data at the time <strong>of</strong> launch is insufficient to take an informed view on costeffectiveness, then, in a limited number <strong>of</strong> cases, a risk sharing approach could be adopted.This would require the company and payer to agree a contract in which the drug isreimbursed, contingent on claims <strong>of</strong> clinical effectiveness being realised in practice. Thiswould be assessed through information on the use <strong>of</strong> the drug in clinical practice. If expectedoutcomes are not realised, prices would be changed and / or repayments made. Risk sharingarrangements could in principle be particularly relevant for the treatment <strong>of</strong> chronic (asopposed to acute) conditions, where final clinical outcomes may only become clear afterseveral years <strong>of</strong> use. However, challenges for implementation remain and risk sharing wouldbe the exception rather than the norm under an ex ante approach to pricing.<strong>The</strong> ex post approach is closer to current arrangements and the majority <strong>of</strong> companies wespoke to suggested it would be preferable to the ex ante pricing model, for fear that thelatter would lead to the protracted negotiations and delays that are seen in some countries.We understand these concerns but we do not think that delays are inevitable. Almost allcountries in the world with the exception <strong>of</strong> the UK and Germany involve systems in whichpayers negotiate prices up front before deciding to reimburse a drug. <strong>The</strong> US – <strong>of</strong>tencharacterised as an ‘industry-friendly market’ – is no exception to this. In the UK theexperience <strong>of</strong> SMC and NICE’s new STA (Single Technology Appraisal) assessment processsuggests that, with appropriate data, a rapid assessment can be made <strong>of</strong> a drug’s costeffectiveness. Delays in some other countries tend, rather, to be the result <strong>of</strong> the need tomake a “once and for all” decision on price and reimbursement, which makes negotiationsprotracted and contentious. Under the ex ante model we have set out, the facility to assesseffectiveness further down the line should allow a quick view to be taken up front.Furthermore, assessing cost effectiveness up front can have beneficial effects in terms <strong>of</strong>uptake – since some prescribers can feel more confident using a drug if they know it has beenassessed as being cost effective. This is particularly a phenomenon <strong>of</strong> secondary care and it isnoteworthy that one company producing drugs primarily for secondary care expressed apreference for ex ante value-based pricing on the basis that it would help them deal with theso-called problem <strong>of</strong> “NICE blight” (low uptake in the absence <strong>of</strong> a NICE assessment).Under either approach, we feel much could be achieved by allowing for more flexible pricestructures than at present such as price volume agreements and rebate systems. Thiswould be particularly useful for drugs for which cost effectiveness differs markedly byindication and patient subgroup. Where this is the case, a higher price could apply for aparticular volume <strong>of</strong> prescriptions, reflecting the patient subgroup for which the drug will beparticularly effective, and a lower price for volumes in excess <strong>of</strong> that. <strong>The</strong> same outcomecould be achieved through rebates between companies and payers and in practice, webelieve this may be the more practical solution.Allowing for a more flexible pricing structure would help address the concern that, undercurrent pricing arrangements, companies have incentives to incur marketing expenditure inan attempt to increase volumes prescribed beyond those for which the drug may be costeffective. Changes to the price structure would therefore help ensure the incentives <strong>of</strong> firmsare much more closely aligned with those <strong>of</strong> the NHS. Companies in turn could reallocate theresources saved towards demonstrating the cost effectiveness <strong>of</strong> the drug with the relevantpricing authority.For <strong>of</strong>f-patent brands with an exact generic equivalent, the principles <strong>of</strong> value-based pricingare clear. A central principle <strong>of</strong> reform is that price should be value-reflective to promote6
February 2007static and dynamic efficiency. In our view, there is no argument for excluding <strong>of</strong>f-patentoriginator brands from these principles. Indeed the arguments are if anything stronger whenapplied to <strong>of</strong>f-patent brands, since under current arrangements there are some extremeexamples <strong>of</strong> prices not reflecting value to patients.However, it is important to maintain the impetus for generic prescribing, hence retainingincentives for generics to enter the market. In the light <strong>of</strong> this, we would recommend thatoriginator brands be reimbursed up to 25 per cent above the generic price.Key challenges: principles, information and institutionsMost companies we have spoken to have recognised the merits <strong>of</strong> value-based pricing inprinciple but have had major concerns about how it has been applied in practice in a number<strong>of</strong> countries. If cost effectiveness assessment is not conducted properly, or is simply used asa veil for arbitrary cost cutting, investment incentives will be undermined. <strong>The</strong>y have stressedto us that, to make a compelling case for reform, we would need to set out in detail theprinciples, institutions and processes that would underpin any alternative scheme. <strong>The</strong>seconcerns are entirely legitimate and we are grateful for the constructive debate we have hadwith companies and key NHS stakeholders about how to address them. Some <strong>of</strong> the keyissues are addressed below.Principles for assessing cost effectivenessIn relation to the assessment <strong>of</strong> cost effectiveness, we fully subscribe to the view thatvalue-based pricing should take account <strong>of</strong> the incremental benefits drugs bring. Somecountries have implemented reference price schemes in which different drugs are groupedtogether and priced at a flat rate. If this ignores relevant patient benefits, we do not think it isconsistent with value for money or giving good incentives to invest. We are also sympatheticwith company views that the notion <strong>of</strong> therapeutic value should embrace not just benefits tothe patients themselves but to others who are affected by their condition, such as carers. Inrecent assessments, NICE has made some moves in this direction and this is to be welcomed.Some companies have also expressed to us the view that on-patent brands should not becompared against generics in considering cost effectiveness as this will reduce incentives toinvest in new drugs. We do not agree with this position. In our view, given the limitedresources the NHS has at its disposable, it cannot afford, on grounds <strong>of</strong> both efficiency andfairness to patients, to ignore relevant comparators on the grounds that they are ‘too costeffective’. If the best available treatment is a generic, then new treatments mustdemonstrate their benefits in relation to the generic to receive higher prices. In the long run,we agree this will have effects on incentives to invest, but we believe they will be entirelypositive, encouraging companies to target areas <strong>of</strong> unmet patient need.Informational requirementsAnother key consideration concerns the informational requirements <strong>of</strong> a value-basedapproach to pricing. We should first stress that adequate information on the clinical and costeffectiveness <strong>of</strong> a drug is an absolute prerequisite for rational prescribing behaviour, whetheror not a value-based pricing approach is adopted. Further, the experience <strong>of</strong> other countriessuch as Sweden shows that value-based pricing approaches are perfectly practicable withresources that are much more modest than those we currently enjoy in the UK. But werecognise also that companies need to be supported if they are to meet the requirements <strong>of</strong>a more value-conscious NHS. In this respect, we strongly support the recommendations <strong>of</strong>the recent Cooksey Review, which calls for a range <strong>of</strong> measures (such as public support for7
<strong>The</strong> <strong>Pharmaceutical</strong> <strong>Price</strong> <strong>Regulation</strong> <strong>Scheme</strong>early-stage health technology assessments) to help companies negotiate the ‘Critical Path’ <strong>of</strong>drug discovery, development and commercialisation.Institutional designUnder any value-based reform, the credibility <strong>of</strong> the institution carrying out the costeffectiveness assessment is key. Institutions need to work well and to be seen to work well.<strong>The</strong>y therefore need to be competent and credible in the eyes <strong>of</strong> key stakeholders. Whileindividual views inevitably differ, it is clear that the bodies that carry out health technologyassessments in the UK, particularly NICE and SMC, are among the most respected in theworld. We believe that they should play a central role in any value-based pricing scheme andhave set out some options for how this might work in the medium and long term.We recognise that there is case for improvement on some fronts to ensure companies arefully engaged in the process <strong>of</strong> assessment. For example, there should be earlier stageengagement with the bodies to help companies understand the sort <strong>of</strong> evidence they will berequired to produce. Here again, the recommendations <strong>of</strong> the Cooksey Review are to bewelcomed. This and – most importantly – the ability to reach more flexible solutions such asrisk sharing agreements should help improve trust and reduce the contentiousness <strong>of</strong>decision making.RecommendationWe recommend that Government work towards reforming the PPRS, replacing theexisting pr<strong>of</strong>it cap and price cuts with a value-based approach to pricing. We believethat both <strong>of</strong> the value-based pricing options we have identified would be a majorimprovement on current pricing arrangements, helping to secure value for money for theNHS and avoiding the increasingly arbitrary nature <strong>of</strong> PPRS controls.In the long run we believe the ex ante approach is to be preferred as it will do the mostto ensure efficient pricing and uptake <strong>of</strong> drugs. We recognise, however, that any newarrangements would need to be phased in appropriately. Major changes to the system shouldnot be rushed. <strong>The</strong> precise timetable for reform would be a matter for Government, indiscussion with industry, to consider.We have developed proposals for a revised institutional framework that could apply from2010. This would not entail wholesale institutional reform but would require greatercoordination between the existing cost effectiveness bodies. We think there is merit inconsidering whether to establish a fully independent pricing authority – a Medicines PricingCommission – although we recognise that this would be a longer-term option, as it wouldrequire primary legislation.If implemented, our recommendations will have significant implications, involving a majorreallocation <strong>of</strong> drug spend in the long run. <strong>The</strong>se changes will create winners and losers andwill clearly not be popular with some companies. But companies that are successful inproducing drugs that make major improvements to patients’ lives will prosper. In our view,that is the essence <strong>of</strong> effective competition.8
February 20071 INTRODUCTION1.1 Every year the NHS spends about £11bn on drugs prescribed in primary care and hospitals.About £8bn <strong>of</strong> this expenditure is on branded drugs. This is a study <strong>of</strong> the <strong>Pharmaceutical</strong><strong>Price</strong> <strong>Regulation</strong> <strong>Scheme</strong> (PPRS), one <strong>of</strong> the main instruments employed by the UK HealthDepartments to control NHS expenditure on these branded drugs.Remit <strong>of</strong> the study1.2 This study was launched on 13 September 2005. Its remit is to assess whether the PPRS iseffective in meeting its high-level objectives, or whether there is a case for reform. <strong>The</strong>objectives <strong>of</strong> the scheme are to:‘Secure the provision <strong>of</strong> safe and effective medicines for the NHS at reasonable prices,promote a strong and pr<strong>of</strong>itable pharmaceutical industry capable <strong>of</strong> such sustainedresearch and development expenditure as should lead to the future availability <strong>of</strong> new andimproved medicines, andencourage the efficient and competitive development and supply <strong>of</strong> medicines topharmaceutical markets in this and other countries.’1.3 While the objectives are discussed in more detail in the report, we interpret them to meanthat the scheme aims both to secure value for money for the NHS and to provide companieswith good incentives to invest in beneficial medicines in the future.1.4 In carrying out the study, we have benefited from constructive discussions with manystakeholders in Government, the NHS and the pharmaceutical industry, both in the UK andabroad. We are grateful for the time they have given us and the expertise they have shared.We are particularly grateful to <strong>of</strong>ficials at the Department <strong>of</strong> Health (DH) and the Association<strong>of</strong> the British <strong>Pharmaceutical</strong> Industry (ABPI), whom we have met on many occasionsthroughout the course <strong>of</strong> the study.1.5 <strong>The</strong> study reflects internal OFT analysis but has also been informed by advice from externalexperts on a number technical areas. 1Overview <strong>of</strong> the scheme1.6 <strong>The</strong> PPRS is an agreement between the UK Health Departments and the pharmaceuticalindustry represented by the ABPI. It is a ‘voluntary scheme’ under section 33 <strong>of</strong> the HealthAct 1999. 21.7 <strong>The</strong> PPRS itself has operated in various forms since 1957. In total there have been nineperiodic agreements under the PPRS and its predecessor, the Voluntary <strong>Price</strong> <strong>Regulation</strong><strong>Scheme</strong> (VPRS). In its present form the scheme has two main components:1 Dr Neal Maskrey (<strong>of</strong> the NHS National Prescribing Centre) and a number <strong>of</strong> other clinicians, pharmacologists andpharmacists advised us on the clinical efficacy and use <strong>of</strong> a number <strong>of</strong> medicinal products. Oxera developed theconceptual framework and carried out the financial modelling described in Annexe I. Oxera and Pr<strong>of</strong>essor Emmanuel <strong>of</strong>the University <strong>of</strong> Glasgow advised on aspects <strong>of</strong> the financial analysis, see Annexe H.2 Sections 33 – 38 <strong>of</strong> the 1999 Act provide the statutory basis to the PPRS. From 1 March 2007, those provisions will bereplaced by sections 261 to 268 National Health Service Act 2006. <strong>The</strong> legal framework for pharmaceutical pricing andrelated matters is discussed in Annexe G.9
<strong>The</strong> <strong>Pharmaceutical</strong> <strong>Price</strong> <strong>Regulation</strong> <strong>Scheme</strong>• pr<strong>of</strong>it controls, which set a maximum level for the pr<strong>of</strong>its that a company may earnfrom the supply <strong>of</strong> branded drugs to the NHS. <strong>The</strong> pr<strong>of</strong>it control also enables companiesto increase prices if their pr<strong>of</strong>its fall below a given minimum, and• price controls, which give companies freedom to set the initial price <strong>of</strong> new activesubstances but impose restrictions on subsequent price increases. <strong>The</strong>y also compriseprice cuts, which are agreed at the time <strong>of</strong> scheme renegotiations. A seven per cent cutwas agreed as part <strong>of</strong> the negotiation <strong>of</strong> the current PPRS scheme beginning in 2005.Companies are given some flexibility in deciding how to deliver savings from price cutsacross a portfolio <strong>of</strong> products, a system known as price modulation.1.8 <strong>The</strong>se controls are discussed in greater detail in Chapter 4 and Annexes H and J <strong>of</strong> this report.Report structure1.9 Chapters 2 and 3 <strong>of</strong> the report consider the role <strong>of</strong> the PPRS from two different perspectives.Chapter 2 focuses on the role <strong>of</strong> the PPRS in the UK. It examines competition within marketsfor prescription medicines in the NHS and considers features <strong>of</strong> supply and demand thatinfluence competitive processes in those markets. It shows how the need for a national levelpricing scheme is underpinned by demand side problems in other parts <strong>of</strong> the NHS andsuggests that the PPRS is best thought <strong>of</strong> not as a regulatory scheme but as a means <strong>of</strong>exercising buyer power in the purchase <strong>of</strong> prescription pharmaceuticals across the UK.1.10 Chapter 3 considers the impact <strong>of</strong> UK prices – and hence the PPRS – on incentives to investin pharmaceuticals. Given the cost structure <strong>of</strong> the industry, these incentives must beunderstood at a global level. Hence this Chapter focuses on the factors influencing globalinvestment decisions and the importance <strong>of</strong> the PPRS among them. UK prices are found tohave a particularly important effect on investment incentives, largely through the influencethey have on prices in other parts <strong>of</strong> the world.1.11 Together, these Chapters provide the necessary context for understanding the role <strong>of</strong> thePPRS. On this basis Chapters 4, 5 and 6 assess the effects <strong>of</strong> the scheme and the casefor reform.1.12 Chapter 4 takes forward the analysis with a more detailed assessment <strong>of</strong> PPRS price andpr<strong>of</strong>it controls, identifying the incentives that arise out <strong>of</strong> them and the extent to which theyhelp secure the scheme’s objectives.1.13 Chapter 5 sets out options for reform to the scheme, relating both to <strong>of</strong>f- and on-patentbrands. In relation to on-patent brands, consideration is given to options for incrementalreform to pr<strong>of</strong>it and price controls and the case for reform in the direction <strong>of</strong> pricing controlsbased on the therapeutic value <strong>of</strong> individual products.1.14 Finally, Chapter 6 presents our recommendations – centred on reform <strong>of</strong> the scheme in thedirection <strong>of</strong> value-based pricing – and sets out a proposed institutional framework toimplement our proposals.1.15 <strong>The</strong> issues addressed in this study are wide-ranging and in some cases complex. This reportis therefore supplemented by several detailed annexes that contain more in-depth analysis <strong>of</strong>a number <strong>of</strong> areas. Reference is made to these annexes at relevant points in the report.10
February 20071.16 This level <strong>of</strong> detail is motivated by the fact that a key objective <strong>of</strong> this study is to improve theterms <strong>of</strong> debate about pharmaceutical pricing and reimbursement, not just in the UK, butinternationally. Against the backdrop <strong>of</strong> increasing pressures on health budgets and everhigherdrug development costs, health policymakers around the world increasingly have tomake difficult decisions about the affordability <strong>of</strong> pharmaceuticals. Such decisions areunavoidable, but they need to be based on an informed, rational debate about how to makethe best use <strong>of</strong> available resources. We hope that the views set out in this report will be auseful contribution to that debate.11
<strong>The</strong> <strong>Pharmaceutical</strong> <strong>Price</strong> <strong>Regulation</strong> <strong>Scheme</strong>2 MARKETS FOR PRESCRIPTION PHARMACEUTICALSIN THE NHS2.1 This Chapter examines competition within markets for prescription medicines in the UK. 3It identifies the range <strong>of</strong> markets affected by the PPRS and considers the relevant features <strong>of</strong>supply and demand that influence competitive processes in those markets. As noted, thisanalysis is a prerequisite for understanding the role the PPRS, its likely effects (considered inChapter 4) and the case for reform <strong>of</strong> the scheme (set out in Chapters 5 and 6).2.2 A more detailed analysis <strong>of</strong> the issues set out here is provided in Annexes A, B and C.<strong>The</strong> NHS drugs bill2.3 In total, we estimate that the NHS spent about £11 billion in 2005 on pharmaceuticals acrossthe UK, reflecting both reimbursement <strong>of</strong> pharmacies for dispensing drugs in primary careand direct expenditure by hospitals. This is between 12 and 18 per cent <strong>of</strong> NHS expenditureon services in all four countries <strong>of</strong> the UK. Of this total, we estimate that about £8 billionwas spent on branded drugs and £3 billion on generics. PPRS price and pr<strong>of</strong>it controlsbetween them apply to almost all branded expenditure in the UK.2.4 Table 2.1 shows how this expenditure breaks down by country and into branded and genericsspend for the primary sector. Data are from 2005, which is the last year for which data areavailable across the UK.Table 2.1: Expenditure on prescription medicines in primary care in the UK, 2005£ millions England Wales Scotland N Ireland TotalGenerics 1,979 132 330 51 2,492Brands 5,522 402 554 286 6,764Total 7,501 534 884 337 9,256Total (minus clawback)* 6,800 500 800 300 8,300* Estimates quoted to nearest £100m.Source: prescriptions statistics 4 ; and OFT calculations. <strong>The</strong> figures may differ slightly from those quoted elsewhere. Totals maynot equal sum <strong>of</strong> constituents due to rounding.2.5 Table 2.1 shows that primary care expenditure at list / Drug Tariff prices totalled £9.2 billion in2005. 5 As explained later in this Chapter, the amount actually paid is somewhat less than thisdue to clawback <strong>of</strong> pharmacy margins (See Annex A). After allowing for clawback, totalexpenditure reduces to about £8.3 billion. On this basis, total primary care expenditure onbrands was about £6.1 billion in 2005.3 Here, as elsewhere in the report, the term ‘market’ should be understood in a general sense, as referring in broad termsto the processes by which companies compete to supply a particular component <strong>of</strong> demand. Unless otherwise stated inthe text, no inferences should be drawn from these statements as to the precise market definition that might apply in anyparticular Competition Act or merger investigation, as this will depend on the circumstances <strong>of</strong> the case and the particularhypotheses being considered.4 Prescription cost analysis (PCA) data provided by the Prescription Pricing Authority (England), Health Solutions Wales, theInformation Services Division Scotland and the Central Services Agency (Northern Ireland).5 <strong>The</strong>se are prices at which drugs are reimbursed in the NHS as explained in Annex A.12
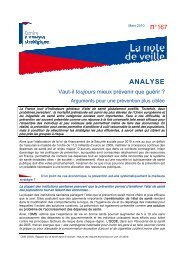
February 20072.6 Data is less readily available for hospitals but Table 2.2 provides our estimates <strong>of</strong> expenditurein the secondary sector.Table 2.2: Estimated expenditure on prescription medicines in secondary care in theUK, 2005£ millions England* Wales Scotland N Ireland† Total*Generics 400 24 43 8 500Branded 1,600 104 183 62 2,000Total† 2,000 128 225 70 2,400*Figures quoted to nearest £100m. † N. Ireland figures exclude VATSource: various 6 ; and OFT estimates. Totals may not equal sum <strong>of</strong> constituents due to rounding.2.7 <strong>The</strong> data for hospital expenditure are estimates <strong>of</strong> the amounts hospitals paid wholesalers (orsometimes the manufacturer directly) for drugs. Availability <strong>of</strong> these data varies from countryto country and in some cases we have had to make estimates <strong>of</strong> hospital branded andgeneric expenditure. In total, about £2.4 billion was spent in hospitals, <strong>of</strong> which we estimatethat roughly £2 billion was spent on branded drugs at manufacturers’ selling prices.Growth <strong>of</strong> prescribing expenditure2.8 Expenditure on prescription medicines has been rising at a steady rate, despite the sevenper cent price cut imposed across branded products in 2005, which led to a slight reductionin overall expenditure relative to 2004. <strong>The</strong> recent growth <strong>of</strong> expenditure in the community(where most <strong>of</strong> the drugs bill is incurred and data tend to be more comprehensive) isshown below.Table 2.3: Growth <strong>of</strong> the community drugs bill in the UK, 2000 to 2005England Wales Scotland N IrelandAverage annual growth (nominal) 7.3% 12.8% 7.0% 8.0%Source: see Table 2.1.2.9 DH analysis for England suggests that most <strong>of</strong> the increase (five per cent) has been due toan increasing number <strong>of</strong> prescriptions per head <strong>of</strong> the population rather than increases in thecost per prescription (1.7 per cent). Trends in the average cost per prescription reflect anumber <strong>of</strong> factors, including substitution <strong>of</strong> generics for more expensive branded drugs asdrugs go <strong>of</strong>f patent.2.10 <strong>The</strong> proportion <strong>of</strong> expenditure on generics has doubled over the last ten years. <strong>The</strong> situationin the community in England is depicted overleaf.6 See Annexe A for details.13
<strong>The</strong> <strong>Pharmaceutical</strong> <strong>Price</strong> <strong>Regulation</strong> <strong>Scheme</strong>Figure 2.1: Breakdown <strong>of</strong> drugs expenditure in the community, England9,0008,0007,0006,000GenericsBrands£ million5,0004,0003,0002,0001,000026.3% 26.4%23.7%21.6%19.9%18.2%17.8%12.9% 13.2%15.1% 15.4%1995 1996 1997 1998 1999 2000 2001 2002 2003 2004 2005Source: Department <strong>of</strong> Health ‘Prescriptions dispensed in the community: Statistics for 1994 to 2005 – England’; and OFTcalculations.<strong>The</strong> contribution <strong>of</strong> patients2.11 Prescription drugs, like most other NHS expenditure, are mainly funded from generaltaxation. <strong>The</strong> contribution made by patients is small.2.12 <strong>The</strong> prescription charge is collected in the community by pharmacies and remitted to centralgovernment. It is currently £6.65 in England, Scotland and Northern Ireland, and £4.00 inWales. Prescription charges are not levied on in-patients in hospitals.2.13 <strong>The</strong> majority <strong>of</strong> community prescriptions do not attract the charge due to exemptions (e.g. forthe elderly, young, unemployed) and the charge will be phased out altogether in Wales fromApril 2007. <strong>The</strong> part <strong>of</strong> the community drugs bill that was paid for by prescription charges in2004 is shown in Table 2.4 below.Table 2.4: Prescription charge receipts as a proportion <strong>of</strong> the community drugs bill, 2004England Wales Scotland N Ireland5.6% 3.2% 4.6% 3.6%Source: PPA, HSW, ISD Scotland and CSA Northern Ireland; and OFT calculations 72.14 <strong>The</strong>se are very low levels <strong>of</strong> contribution by international standards. Almost all countries in theworld have a higher proportion <strong>of</strong> patient contributions (an exception is the Netherlands). Thisfact is central in understanding the functioning <strong>of</strong> markets to prescribe and dispense drugs inthe NHS, which is the main focus <strong>of</strong> analysis in the following sections <strong>of</strong> this Chapter.7 In 2004 the prescription charge was £6.40 in all countries except for Scotland where it was £6.00. <strong>The</strong> table capturesrevenues from prepayment certificates (covering patients for all prescriptions needed during three-month and twelvemonthperiods) as well as charges levied at the point <strong>of</strong> dispensing in community pharmacies.14
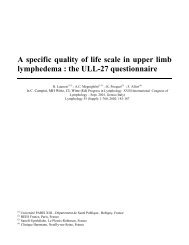
February 2007Demand for prescription medicines in the NHS and the role <strong>of</strong> the PPRS2.15 <strong>The</strong> NHS can be split up into primary (or ‘community’) care and secondary (or hospital) caresegments. 8 <strong>The</strong> process <strong>of</strong> supplying drugs to patients differs between these two segments.2.16 In primary care, GPs write prescriptions for drugs, which a patient then takes to a pharmacy.<strong>The</strong> pharmacy dispenses the drug in question, either at the flat prescription rate or, morecommonly, for free. Pharmacies are responsible for purchasing the drugs either directlyfrom manufacturers or through wholesalers. <strong>The</strong>y are reimbursed by the NHS for the cost<strong>of</strong> these drugs.2.17 In secondary care, a hospital clinician will prescribe a drug, which is then dispensed by thehospital pharmacy. Hospitals are responsible for purchasing the drugs they dispense. Unlikeprimary care pharmacies, however, they are not reimbursed directly for doing so – they mustdraw on the overall NHS revenues they receive for treating patients. Patients do not pay fordrugs supplied in hospitals.2.18 As these brief descriptions suggest, demand for drugs within the NHS (particularly in primarycare) is characterised by a complex set <strong>of</strong> principal-agent relationships, in which:• the person who consumes the drug (the patient) neither decides nor, in most cases, pays• the person who decides which drug should be used (the prescribing doctor) neither paysnor consumes, and• the institution that pays for the drug (the NHS / Government) neither consumes nor decides.2.19 <strong>The</strong> PPRS is a means by which one component <strong>of</strong> demand – the payer – seeks to constrainthe prices <strong>of</strong> branded prescription medicines. As discussed elsewhere in this report, theconstraints include a series <strong>of</strong> price controls and a cap on pr<strong>of</strong>its that companies can earn onthe sale <strong>of</strong> branded drugs to the NHS.2.20 <strong>The</strong>refore, despite its name, the PPRS is not truly a regulatory mechanism (that is, one thatconstrains commercial relations between two third parties). Rather, it represents an attemptto exercise buyer power in the purchase <strong>of</strong> prescription medicines across the UK. In thisregard it operates alongside numerous other demand-side controls and incentives at nationaland local levels <strong>of</strong> the NHS.2.21 Notable among these are the bodies charged with evaluating the cost effectiveness <strong>of</strong> drugsand other medical interventions in the UK: the National Institute for Health and ClinicalExcellence (NICE), which operates in England and Wales; the Scottish Medicines Consortium(SMC), which operates in Scotland; and the All Wales Medicines Strategy Group (AWMSG),which operates in Wales. <strong>The</strong> specific role <strong>of</strong> these bodies is discussed in greater detail inAnnexe B.<strong>The</strong> structure <strong>of</strong> NHS demand2.22 <strong>The</strong> diagram below provides an overview <strong>of</strong> financial flows and control mechanisms relatingto expenditure on branded pharmaceuticals in the NHS.8 <strong>The</strong>re is also tertiary care. This is specialised consultative care, usually on referral from primary or secondary carepersonnel, by specialists working in a center that has personnel and facilities for special investigation and treatment.Cancer treatment centres are an example.15
<strong>The</strong> <strong>Pharmaceutical</strong> <strong>Price</strong> <strong>Regulation</strong> <strong>Scheme</strong>Figure 2.2: Financial flows and controls relevant to the prescribing <strong>of</strong> brandeddrugs in the UKNational bodiesproducing guidanceNICE, SMC, AWMSG, NPC etc.Central GovernmentNeeds-basedfundingRegional advisory bodiesSHA, NPHSWPrimary Care OrganisationsIncentives andpaymentsGPsCommissioningvaries by countryPPRS<strong>Price</strong>controlsReimbursementPrescribeHospital TrustsPharmaciesPrescriptioncharge or freePatientsDrug purchases<strong>Price</strong>s constrained indirectly by thepr<strong>of</strong>it cap and price controlDrug purchasesKEY:Wholesalers /manufacturersWholesalers /manufacturersFinancial flowsGuidance /constraint2.23 <strong>The</strong> table overleaf identifies the main types <strong>of</strong> market relevant to the supply <strong>of</strong> prescriptionpharmaceuticals to patients in primary and secondary care. At each level, it shows theincentives <strong>of</strong> NHS agents in terms <strong>of</strong> how they are remunerated for prescribing or purchasingdecisions, the price they or the NHS pay and identifies the types <strong>of</strong> companies competing tosupply. PPRS price controls constrain the manufacturer’s list price, which is highlighted in thetable in bold.2.24 <strong>The</strong> remainder <strong>of</strong> the chapter assesses competition within these markets in primary andsecondary care.Competition in primary care to influence GPs2.25 <strong>The</strong> bulk <strong>of</strong> NHS expenditure on drugs is incurred in primary care. <strong>The</strong> role <strong>of</strong> GPs in decidingon which drugs resources should be spent is therefore key. This section reviews the nature<strong>of</strong> competition between drug manufacturers to secure a GP’s prescription. It considers thefactors that influence GP prescribing behaviour, presents the results <strong>of</strong> new research into GPprice sensitivity and assesses to what extent current prescribing practices lead to efficientoutcomes.16
February 2007Overview <strong>of</strong> prescribing within primary care2.26 In all four countries, the delivery <strong>of</strong> frontline healthcare, including medicines, is centred onprimary care organisations (PCOs), a general term for English Primary Care Trusts and whatare usually referred to as Health Boards in Wales, Scotland and Northern Ireland. Collectively,PCOs receive around 80 per cent <strong>of</strong> NHS funds and individually they manage the delivery <strong>of</strong>most health care to populations <strong>of</strong> 100,000 to 300,000. Each PCO’s share <strong>of</strong> available fundsis determined by the demographics and relative health needs <strong>of</strong> its local population, usingassessment methodologies that vary across the four countries.2.27 With regard to primary care prescribing, PCOs manage GPs under the terms <strong>of</strong> a UK-wideGeneral Medical Services (GMS) contract. PCOs seek to encourage GPs to prescribe costeffectivelythrough local incentive schemes and other arrangements.Relevant markets in primary care2.28 It is possible to identify three broad types <strong>of</strong> market <strong>of</strong> relevance to prescribing anddispensing in primary care. <strong>The</strong>se are shown in Figure 2.3.Figure 2.3: Markets relevant to prescribing and dispensing drugs in primary careActivityCompetitionDecision maker: GP issues a prescription.This is either written generically, or fora particular brand.Manufacturers <strong>of</strong> therapeutically similartreatments compete to secure GP’sprescriptionBranded Prescription a :Pharmacist dispenses abranded drug<strong>The</strong> branded manufacturer competes withparallel importers to supply pharmaciesGeneric Prescription b :Pharmacist dispenseseither a generic orbranded drug<strong>The</strong> branded manufacturer, genericmanufacturers and parallel importerscompete to supply pharmaciesa – or generic prescription when drug is on-patentb – providing generics are available2.29 At the upstream level in this supply chain, GPs make decisions on how to treat a particularcondition and can issue a prescription. Within this market, competition is from alltherapeutically similar treatments that the GP could prescribe. <strong>Pharmaceutical</strong> firms are activein this market in seeking to persuade GPs <strong>of</strong> the benefits <strong>of</strong> their products, to get themprescribed. Competition at this level is the focus <strong>of</strong> the rest <strong>of</strong> this section.2.30 Once the GP has written the prescription, there are two types <strong>of</strong> downstream markets in whichsuppliers compete to supply pharmacies to dispense drugs against this prescription. <strong>The</strong>se differdepending on whether the prescription written by the GP is for a branded drug, or whether it iswritten generically (that is, by chemical name) and also on whether generic versions <strong>of</strong> the drugin question are available (largely determined by whether the drug is on- or <strong>of</strong>f-patent). <strong>The</strong> nature<strong>of</strong> competition in these downstream markets is analysed later in this Chapter.17
<strong>The</strong> <strong>Pharmaceutical</strong> <strong>Price</strong> <strong>Regulation</strong> <strong>Scheme</strong>Table 2.5: Summary <strong>of</strong> competition in drugs markets in the UKAgent Share NHS How reimbursed for <strong>Price</strong> paid for Parties competingdemand pharmaceutical expenditure pharmaceuticals to supplyPrimary Care c. 75%PCOsGPsFormula based on populationcharacteristics produces unified budgetfrom which PCO apportions drug spendManufacturer’s list priceless average clawbackGPs do not pay for drugs and so are not reimbursed for drug spend. aSome contractual incentives relate to list price and Drug Tariff priceManufacturers <strong>of</strong> alltherapeutically substitutableproducts compete to secureGP’s prescriptionPharmacies(when GP hasprescribed a brandor on-patent drug)Pharmacies(when GP hasprescribed<strong>of</strong>f-patent druggenerically)List price less claw back based onvolumesDrug Tariff price (primarily Category M) cless claw backMarket but list priceimposes ceiling bMarket but list price<strong>of</strong> originator on patentexpiry imposes ceilingManufacturer <strong>of</strong> brand (eitherdirectly or through a wholesaler)competes with parallelimporters to supply pharmacySuppliers <strong>of</strong> all chemicallyidentical drugs (brand andgeneric manufacturers)compete to supply pharmacySecondary Care c. 25%Hospitals England – National Tariff for healthcareinterventions. W and NI – commissioningrevenues (no tariff). Sc – funds agreedwith AHB. DH pays for some high-costdrugs directlyMarket (but list priceimposes a ceiling)Manufacturers <strong>of</strong> alltherapeutically substitutableproducts (subject to cliniciancompliance with formulary)including parallel importersa – With the exception <strong>of</strong> Dispensing Doctors, who pay market prices and are reimbursed at list / Drug Tariff price, hence gaining from any margin.b – Pharmacies typically purchase domestically-sourced drugs from wholesalers at list price minus about 10.5%. <strong>The</strong> supply chain is described in Chapter 6.c – Drug Tariff Part VIII lists reimbursement prices for generic drugs (Categories M, A, B and C).18
February 2007Markets to secure a GP’s prescription2.31 To treat a given condition, GPs choose between groups <strong>of</strong> medicines that are therapeuticallysubstitutable. Depending on the patient’s medical history and condition, the range <strong>of</strong>appropriate medicines may be broad or narrow. Often, but by no means always, the list <strong>of</strong>products appearing in a relevant ‘Paragraph’ <strong>of</strong> the British National Formulary (BNF)represents the available scope for choice.2.32 BNF paragraphs can contain one or two, and up to sometimes ten or more, medicines withsomewhat different chemical actions, interactions, side-effects and evidence bases, andwhich may be on- or <strong>of</strong>f-patent. Members <strong>of</strong> the same BNF Paragraph are all designed totreat the same condition <strong>of</strong> a specific part or system <strong>of</strong> the body (though some may havealternative uses).2.33 A BNF paragraph can therefore in some cases be considered in broad terms to constitute a‘market’ for drugs to treat a given medical condition. However, it is important to note that inCompetition Act investigations or merger decisions, appropriate market definitions may bewider or narrower than the Paragraph according to the individual circumstances and thespecific question being addressed. This is discussed in the box below.Box 2.1: Market definitions relevant to prescribing behaviourA standard approach to defining markets for drugs (taken by the European Commission, forexample) is to use the Anatomical <strong>The</strong>rapeutic Chemical (ATC) classification devised by theEuropean <strong>Pharmaceutical</strong> Marketing Research Association (EphMRA). <strong>The</strong> World HealthOrganisation maintains a similar classification.Within the ATC system, drugs are grouped according to the organ or system on which they act –the first level <strong>of</strong> analysis – and their therapeutic, pharmacological and chemical properties – thesecond, third, fourth and sometimes fifth levels <strong>of</strong> increasingly specific classification. An examplefrom EphMRA is:NN6N6AN6A4Prozac®Nervous systemPsychoanaleptics excluding anti-obesity preparationsAnti-depressants and mood stabilisersSSRI anti-depressants(A branded product, chemical name: fluoxetine)<strong>The</strong> European Commission considers the third level <strong>of</strong> analysis – ATC3 – (in the above example‘C10A’) to be a suitable starting point for market definitions in competition cases. However, theCommission regularly carries out analyses at other ATC levels, or a mixture there<strong>of</strong>, recognisingthat relevant economic markets can be wider or narrower than ATC3, or do not fit neatly into one<strong>of</strong> the ATC levels. <strong>The</strong> guiding principle is that products should be included in the same market ifthey are substitutable for the same purpose.Often, markets are judged to be narrower than ATC3 or even ATC4. Even medicines with identicalactive ingredients may have distinct therapeutic uses according to their delivery technology, theirside-effects resulting from the presence <strong>of</strong> chemicals other than the active ingredient, theirreputation and other factors influencing their functional substitutability in the eyes <strong>of</strong> clinicians.<strong>The</strong> OFT took these factors into account in the Competition Act 1998 decision concerning Napppharmaceuticals. 9 <strong>The</strong>re, the market relevant to the undertaking’s brand was narrowly defined as‘sustained-release morphine tablets and capsules’. Other factors in addition to therapeuticsubstitutability will also inform market definition, such as price.9 Decision <strong>of</strong> the Director General <strong>of</strong> <strong>Fair</strong> <strong>Trading</strong> No CA98/2/2001, 30 March 2001, Napp <strong>Pharmaceutical</strong> Holdings Limitedand Subsidiaries. This decision was appealed to the Competition Appeal Tribunal on 29 May 2001. On 15 January 2002the Competition Appeal Tribunal upheld substantially the Director General <strong>of</strong> <strong>Fair</strong> <strong>Trading</strong>’s decision on liability.19
<strong>The</strong> <strong>Pharmaceutical</strong> <strong>Price</strong> <strong>Regulation</strong> <strong>Scheme</strong><strong>The</strong> analysis presented later in this annexe uses the British National Formulary, which organisesdrugs in a similar but not identical way to the EphMRA scheme. <strong>The</strong> BNF uses Chapters,Sections, Paragraphs and Sub-paragraphs that are equivalent to ATC levels 1 to 4 above.Generic prescribing2.34 It is important to note that GPs are encouraged to write prescriptions using the drug’schemical name, whether or not the product in question is out <strong>of</strong> patent, unless there arespecific clinical reasons not to. 10 This is typically known as ‘generic prescribing’ and isencouraged throughout a product’s life cycle2.35 This policy is motivated by both safety and cost concerns. <strong>The</strong>re are sometimes many brandnames for one medicine and possible confusion or mistakes are reduced if all doctors use thesame names when discussing and prescribing drugs. Also when a branded medicine’s patentexpires, generic equivalents that appear in the market are usually cheaper for the NHS but,for a pharmacist to be able to dispense a generic, a prescription must be written by a drug’schemical name.2.36 <strong>The</strong> chart below shows how generic prescribing increased in England from 1995 – 2005.In total, prescribing by chemical name accounted for about 70 per cent <strong>of</strong> primary careexpenditure in England in 2005, up from just over 40 per cent in 1995. <strong>The</strong> overall genericprescribing rate and breakdown are similar in Scotland and Wales but Northern Ireland has anoverall generic prescribing rate <strong>of</strong> only 45 per cent.Figure 2.4: Generic prescribing in the community, England 1995-2005100%90%Share <strong>of</strong> total expenditure80%70%60%50%40%30%20%10%0%1995 1996 1997 1998 1999 2000 2001 2002 2003 2004 2005Prescribed generically and generic availablePrescribed generically, only brand availablePrescribed, dispensed as brand10 <strong>The</strong> British National Formulary prints advice about generic prescribing with each drug entry.20
February 20072.37 Generic prescribing has increased markedly over the past ten years in the UK. However,there is still significant expenditure on <strong>of</strong>f-patent brands for which equivalent generics areavailable at much cheaper prices. This is taken up later in the Chapter.2.38 In conclusion, in each individual case, the market for a GP’s prescription will be definedaccording to concepts <strong>of</strong> substitutability: where products are considered substitutable, thiswill lead to a broader market definition. 11 <strong>The</strong> main form <strong>of</strong> competition is between suppliers<strong>of</strong> substitutable drugs in each market to influence GPs’ prescribing decisions. In the nextsub-section we consider the various influences on prescribing decisions.Factors influencing GP decision making2.39 <strong>The</strong> many influences that act on GPs’ prescribing decisions (and their assessments <strong>of</strong> costand clinical effectiveness) include:• the General Medical Services (GMS) contract which determines GPs’ working conditionsand provides a framework for their remuneration across the UK• guidance from national bodies such as NICE, SMC and SIGN, AWMSG and AWPAG, etc• local measures implemented by PCOs, including prescribing incentive schemes, localformularies and advice from prescribing advisers• peer pressure, informed by prescribing trend information made openly available withinthe NHS and the practice <strong>of</strong> hospital consultants• the marketing activities <strong>of</strong> pharmaceuticals manufacturers• their own, independent assessment <strong>of</strong> clinical evidence published in scientific journals, and• pressure from patients who may have an attachment to a particular brand.2.40 Incentives for dispensing doctors, who act as pharmacists to procure and dispense some <strong>of</strong>the medicines they prescribe, may also include pr<strong>of</strong>it.2.41 <strong>The</strong> relative weight <strong>of</strong> these influences is discussed in Annexe A. We found that the GMScontract is likely to exert the strongest financial influence on GPs’ prescribing behaviour.While the contract <strong>of</strong>fers many and varied financial rewards to GPs who meet certain clinicalstandards it provides limited incentives for cost containment. Its net effect is therefore likelyto dull GP price sensitivity.2.42 <strong>The</strong> influence <strong>of</strong> NICE, SMC and AWMSG on prescribing decisions is discussed in Annexe B<strong>of</strong> this report. <strong>The</strong> bodies have certainly helped improve awareness <strong>of</strong> the importance <strong>of</strong> costeffectiveness and in many cases their guidance has had an impact on prescriber behaviour.However, guidance is not always followed – indeed, prescribers are not required to do so.Evidence suggests that non-compliance may be more <strong>of</strong> an issue in primary care comparedwith secondary care. Implementation is not helped by the fact that in some cases guidance isnot reflected in incentives contained in the GMS contract, which, as discussed above, is amajor influence on GP behaviour. Furthermore, there are issues concerning drug coverage –NICE in particular does not look at all drugs.2.43 <strong>The</strong> technical expertise that these bodies bring to bear in conducting cost-effectivenessassessments is <strong>of</strong> world class standard. However, we believe better use could be made <strong>of</strong>this expertise in ensuring NHS resources are spent cost effectively. We discuss these issuesfurther in Chapters 4 and 5 <strong>of</strong> this report.11 It is primarily demand side substitutability that is relevant for GPs’ decision making. Supply side substitutability is onlylikely to be relevant in relation to <strong>of</strong>f-patent brands, for considering possible generic entry.21
<strong>The</strong> <strong>Pharmaceutical</strong> <strong>Price</strong> <strong>Regulation</strong> <strong>Scheme</strong>2.44 <strong>The</strong> responsibility for containing cost is largely left to PCOs to organise locally. Prescribingincentive schemes pay rewards to practices that contain their expenditure on drugs withinagreed annual budgets. <strong>The</strong>se have reduced in importance in recent years as the cost toPCOs <strong>of</strong> generating incentives to <strong>of</strong>fset the rewards in the GMS contract has becomeprohibitive. More informal methods, such as the advice <strong>of</strong> prescribing advisers and organisedpeer pressure are perhaps the most effective means by which PCOs can influence GPs. 12Other initiatives such as the use <strong>of</strong> local formularies have been used across the UK withvarying success.2.45 In short, there is considerable variation in the effectiveness <strong>of</strong> local arrangements toencourage cost effective prescribing behaviour. A forthcoming National Audit <strong>Office</strong> (NAO)study into value for money in primary care prescribing is expected to identify particular bestpractice examples <strong>of</strong> approaches used at a local level.2.46 Marketing expenditure by pharmaceutical companies also has an influence on GPs’ decisionmaking. Companies spent some £850 million on marketing activities in the UK in 2004. 13This has led to calls for such expenditure to be curbed. We do not agree that urgingcompanies to reduce such expenditure is the right response to this problem. Companies aresimply responding to the financial incentives they are given through current linear pricestructures, which give companies a constant return for every extra unit prescribed. As wediscuss in Chapter 5, we believe a better response to concerns about excessive marketingactivity would be to give them better incentives to incur productive expenditure through theuse <strong>of</strong> more flexible – and value-reflective – price structures.2.47 <strong>The</strong> awareness <strong>of</strong> and sensitivity to drug prices among GPs is determined by the balance <strong>of</strong>all their incentives and influences such as those outlined above. However, it is also importantto note that, even if GPs had appropriate incentives to take costs into account, there wouldstill be issues in terms <strong>of</strong> adequate access to information. GPs typically have insufficient timeto acquaint themselves with data on the relative cost and clinical effectiveness <strong>of</strong> differentdrugs. Work undertaken by the National Prescribing Centre to advise clinicians on theefficient use <strong>of</strong> information observes that the journal articles and NHS guidance pertaining toany individual clinical decision can run into many thousands <strong>of</strong> pages.2.48 Consistent with many <strong>of</strong> the above observations, previous studies have found GPs’ awareness<strong>of</strong> and sensitivity to drug prices to be low. In 2002, a joint study by DH and the Association <strong>of</strong>British <strong>Pharmaceutical</strong> Industries (ABPI) investigated GPs’ knowledge <strong>of</strong> the relative prices <strong>of</strong>drugs within five therapeutic classes. Overall, participants got around 50 per cent <strong>of</strong> pair-wisechoices between the prices <strong>of</strong> products in the same therapy class correct, which is consistentwith guessing. <strong>The</strong> same study also reported that, at the time, English GPs deemed cost to bea lower priority than clinical concerns.2.49 Since the last survey <strong>of</strong> GP price sensitivity was carried out, there have been some importantchanges that may plausibly affect GP price awareness, such as the bedding down <strong>of</strong> NICEand SMC and the onset in some areas <strong>of</strong> England <strong>of</strong> Practice-Based Commissioning. For thisreason, the OFT collaborated with the NAO to conduct an up-to-date survey, which issummarised in Box 2.3 below and described in more detail in Annexe C.12 It is clear from publicly available data if any one practice is putting strain on a local health economy, for example by ‘overprescribing’for particular conditions.13 Source: PPRS Annual Financial Returns, 2004.22
February 2007Box 2.3: Recent evidence on price awareness among GPsThis box describes the results <strong>of</strong> research into GPs’ knowledge <strong>of</strong> the prices <strong>of</strong> a number <strong>of</strong>commonly prescribed drugs. <strong>The</strong> results are taken from a survey <strong>of</strong> 1,000 English GPs conductedas part <strong>of</strong> ongoing research by the National Audit <strong>Office</strong> into value for money in primary care.<strong>The</strong> exercise outlined below is described in greater detail in Annexe C <strong>of</strong> this report.As part <strong>of</strong> its survey <strong>of</strong> GPs, the NAO kindly agreed to the inclusion <strong>of</strong> a test <strong>of</strong> price sensitivitydesigned by the OFT. We asked GPs to rank branded drugs within each <strong>of</strong> six therapeutic areasin order <strong>of</strong> price. <strong>The</strong> areas tested were:• proton pump inhibitors• statins• ACE inhibitors and angiotensin II receptor antagonists (considered together)• SSRI antidepressants• other antidepressants, and• non-steroidal anti-inflammatory drugs.<strong>The</strong>se groups were included because they are commonly prescribed and familiar to mostclinicians. Each group is a major expenditure area containing drugs that are widely agreed to bequite close therapeutic substitutes. Two <strong>of</strong> the groups – statins and proton pump inhibitors –account for respectively the most and second-most NHS expenditure <strong>of</strong> any chemical class.All <strong>of</strong> the six groups are consistently among the ten largest components <strong>of</strong> the drugs bill.Each <strong>of</strong> the groups contains numerous drugs in many presentations. We selected for inclusionthe most commonly prescribed branded drugs, forms, strengths and pack sizes, with a view toproviding GPs with a manageable list <strong>of</strong> around six highly recognisable products to rank in eachgroup. <strong>The</strong>re was no attempt to select items that would be especially easy or difficult to assessfor price.Looking at the exercise as a whole, GPs’ ability to rank branded drugs in order <strong>of</strong> price proved nobetter than chance. <strong>The</strong>re were, however, differences between the results for different groups: inseveral groups results were significantly better than would be expected by chance and in othersmuch worse.Across classes, it appeared that in groups where branded drugs had generic alternatives thissometimes contributed to the difficulty <strong>of</strong> making correct ranking assessments. <strong>The</strong> resultssuggest that GPs may have a systematic perception that <strong>of</strong>f-patent brands have the lowest prices<strong>of</strong> all brands in a therapeutic group – implying a belief that when a drug goes <strong>of</strong>f patent it lowersits price in response to generic entry. But in fact <strong>of</strong>f-patent brands <strong>of</strong>ten do not significantly fall inprice in this way.2.50 In conclusion, while there is likely to be variation between individuals and between products(discussed in Annexe A), awareness <strong>of</strong> and sensitivity to the relative price <strong>of</strong> some majorbranded drugs is fairly weak among primary care prescribers. This is one <strong>of</strong> the reasonssupplementary influences and controls such as the PPRS are required in other parts <strong>of</strong> the NHS.2.51 Of course, price is not the only criterion prescribers should take into account. Efficientprescribing behaviour requires a consideration <strong>of</strong> price relative to the benefits a drugproduces – that is, <strong>of</strong> its cost effectiveness. As suggested below, there is strong evidencethat current prescribing practices in the UK do not always meet this criterion.23
<strong>The</strong> <strong>Pharmaceutical</strong> <strong>Price</strong> <strong>Regulation</strong> <strong>Scheme</strong>2.52 It is important to note that, even if prescribers were fully aware <strong>of</strong> prices and incentivised torespond to them, there would be strong arguments for the centralisation <strong>of</strong> certain functionswithin the NHS, such as the assessment <strong>of</strong> cost effectiveness (these are economies <strong>of</strong> scalearising from the complexity <strong>of</strong> the analysis involved) and the negotiation <strong>of</strong> prices (in order tomake effective use <strong>of</strong> NHS buyer power).Static and dynamic competition2.53 <strong>The</strong> focus <strong>of</strong> this Chapter is on the demand side <strong>of</strong> pharmaceuticals markets in the UK.Chapter 3 considers features relevant to the supply side – that is, the process <strong>of</strong> developingand marketing drugs, the nature <strong>of</strong> the costs involved and companies’ global investmentincentives and pricing strategies. <strong>Pharmaceutical</strong>s markets are characterised by significantbarriers to entry, reflecting the high fixed costs required to develop a drug and intellectualproperty rights companies are granted to protect their investments.2.54 <strong>The</strong>refore, one would expect pharmaceuticals markets in most countries to be fairlyconcentrated (that is, individual companies will have fairly high market shares). Particularoutcomes in any one country will depend on both these supply side factors and keycharacteristics <strong>of</strong> demand, <strong>of</strong> the sort discussed above in the context <strong>of</strong> the NHS.2.55 This section provides an overview <strong>of</strong> evidence on concentration in markets to secure primarycare prescriptions in the UK. It begins with a static analysis – a snapshot <strong>of</strong> concentration at aparticular point in time – before looking at how prices and volumes <strong>of</strong> drugs change over timein response to events such as new entry and substitute products going <strong>of</strong>f patent.Static analysis2.56 As discussed above, the fundamental nature <strong>of</strong> competition at the GP level is that companiesseek to gain market share by convincing GPs that their products are more clinically effectivethan rival products for a particular condition (or, to the extent that GPs are price sensitive,more cost effective than rival products). Accordingly, drugs markets are routinely definedaccording to the principle <strong>of</strong> therapeutic substitutability.2.57 <strong>The</strong> table below shows one measure <strong>of</strong> concentration in UK drugs markets defined at thelevel <strong>of</strong> the BNF Paragraph. It is important to note that there are other measures <strong>of</strong>concentration and to reiterate that in many cases markets may be defined at very differentlevels to these. <strong>The</strong> analysis here is simply intended to give a broad brush overview <strong>of</strong> theextent <strong>of</strong> competition across all Paragraphs <strong>of</strong> the BNF.Table 2.6: Percentage <strong>of</strong> markets where a branded drug has a share above 40% inEngland, Scotland and Northern Ireland, 2005Country Market Value at % <strong>of</strong> market Number <strong>of</strong> % <strong>of</strong> marketsreimbursement value marketsprices £millionEngland 4,307 56.3 215 62.7Scotland 270 60.3 217 72.8Northern Ireland 107 61.0 235 85.5Note: Welsh data are not susceptible to this analysis.Source: PCA Data24
February 20072.58 Table 2.6 shows the number <strong>of</strong> BNF Paragraphs where a branded drug has a share exceeding40 per cent. Competition authorities <strong>of</strong>ten consider markets where a firm has a share <strong>of</strong> 40per cent or more <strong>of</strong> sales to be highly concentrated and, in a formal Competition Act 1998investigation, a firm is unlikely to be considered dominant if it has a share below 40 per cent<strong>of</strong> the relevant market. 142.59 Table 4.1 shows that across the UK between 62 and 86 per cent <strong>of</strong> ‘markets’ as definedabove feature a firm with a market share <strong>of</strong> greater than 40 per cent. <strong>The</strong>se markets accountfor between 56 and 61 per cent <strong>of</strong> NHS expenditure on prescription medicines. <strong>The</strong>senumbers have increased slightly since 2000.Dynamic analysis2.60 Given the innovative nature <strong>of</strong> the industry, one would expect market shares to change overtime, as new drugs enter markets, taking the place <strong>of</strong> older products. In Annexe A wediscuss trends in prices and volumes in four major markets: the proton pump inhibitors; theangiotensin II receptor antagonists (for high blood pressure); the selective serotonin reuptakeinhibitors (SSRIs, a class <strong>of</strong> antidepressants); and the statins (for cholesterol).2.61 <strong>The</strong> analysis suggests that:• typically brands are launched at a discount to the incumbent in a market• prices are closely bunched in each market, particularly in later years. <strong>Price</strong> differencesbetween the first and subsequent launches consistently erode over time, and• the general trajectory <strong>of</strong> prices in all markets is downwards. This reflects the mechanisms<strong>of</strong> the PPRS, in particular the price cuts and constraints on increasing the list price, asdiscussed in Chapter 4. <strong>Price</strong>s are reduced outside <strong>of</strong> the obligatory cuts only very rarely.2.62 <strong>The</strong> graphs below show the changes in prices and volumes <strong>of</strong> the statins over time. 15 <strong>The</strong>graphs show that volumes <strong>of</strong> originator brands – Zocor, for example – experience a significantdrop when a patent expires, in response to the entry <strong>of</strong> much cheaper and bioequivalentgeneric products. This is a commonly observed phenomenon and is a direct outcome <strong>of</strong> thepractice <strong>of</strong> generic prescribing discussed above. Usually, prescribing <strong>of</strong> the affected chemicalcontinues along the same trend as before patent expiry but dispensing <strong>of</strong> the brand issubstituted by dispensing <strong>of</strong> generics.2.63 However, in the graph prices for simvastatin fell when Zocor lost its patent protection in 2003and at the same time volumes rose markedly. <strong>The</strong>re are many factors that combine to explainthis outcome. Use <strong>of</strong> all statins has increased greatly in recent years as medical opinion hasbegun to reach a consensus about the therapeutic value <strong>of</strong> the class as a whole, for example.However, the example is also consistent with some degree <strong>of</strong> sensitivity to significant pricechanges in major drugs. This sensitivity is influenced by the variety <strong>of</strong> the factors discussedabove, such as prescribing advisers and national guidance bodies.14 Again, since this analysis is provided for illustrative purposes, no inferences can be drawn from it about how the OFT oranother competition authority might define the market or assess dominance in any particular case in the future. Such anassessment would need to reflect the individual hypotheses relevant to the case.15 <strong>The</strong> graphs show prices per unit and volumes <strong>of</strong> the most commonly prescribed strengths. In some cases, the mostcommonly prescribed strengths may have somewhat different potency but because the changes in price when a druggoes <strong>of</strong>f patent are so large this would not alter the conclusions. For example in February 2007, the Drug Tariff shows theprice <strong>of</strong> generic simvastatin 20mg was 7.2p, and 40mg was 12.6p, per tablet while the price <strong>of</strong> Lipitor (brandedatorvastatin) 10mg was 64.4p, and 20mg was 88p, per tablet. Thus, even comparing generic simvastatin 40mg withLipitor 10 mg, Lipitor was more than five times the price.25
<strong>The</strong> <strong>Pharmaceutical</strong> <strong>Price</strong> <strong>Regulation</strong> <strong>Scheme</strong>2.64 More significantly, however, Figures 2.5 and 2.6 do not show significant changes in price orvolumes <strong>of</strong> other on-patent statins when simvastatin and pravastatin lost patent protection. 16Competition between manufacturers did not lead to significant reductions in the price <strong>of</strong>substitute products, such as the other statins. Moreover, these substitute products retainedsignificant volume and market shares despite the very significant change in relative pricefollowing simvastatin going <strong>of</strong>f-patent. Given the very low prices at which generics areavailable, sustained prescribing <strong>of</strong> high-priced brands that may be therapeutic substitutes formany patients, raises potentially very significant concerns about the cost effectiveness <strong>of</strong>prescribing behaviour. While volumes <strong>of</strong> some on-patent statins may have fallen somewhatsince this analysis was undertaken, the extent <strong>of</strong> inefficiency remains significant. <strong>The</strong>seconcerns are taken up in the concluding section below.Figure 2.5: Dynamic competition in statins: prices1.81.61.4<strong>Price</strong> (£ per tablet or capsule)1.21.00.80.60.40.201991Q11992Q11993Q11994Q11995Q11996Q11997Q11998Q11999Q12000Q12001Q12002Q12003Q12004Q12005Q1Crestor_Tab 10mgLescol_Cap 40mgLipitor_Tab 20mgLipostat_Tab 40mgZocor_Tab 20mgSimvastatin_Tab 20mgPravastatin Sod_Tab 40mgSource: PCA data for England is used. <strong>Price</strong>s are on a per-unit (tablet, capsule) basis.16 A partial exception is Lescol, volumes <strong>of</strong> which fell gradually from 2003. <strong>The</strong> prices <strong>of</strong> two other brands fell in 2005 aspart <strong>of</strong> the implementation <strong>of</strong> the PPRS price cut. However, as noted in Annexe J, these were likely a competitiveresponse, at least in part, to parallel trade.26
February 2007Figure 2.6: Dynamic competition in statins: volumes80000Quantity (thousands <strong>of</strong> tablets or caps)7000060000500004000030000200001000001991Q11992Q11993Q11994Q11995Q11996Q11997Q11998Q11999Q12000Q12001Q12002Q12003Q12004Q12005Q1Crestor_Tab 10mgZocor_Tab 20mgLescol_Cap 40mgSimvastatin_Tab 20mgLipostat_Tab 40mgLipitor_Tab 20mgPravastatin Sod_Tab 40mgSource: PCA data for England. Volumes are in thousands <strong>of</strong> unitsOutcomes2.65 As noted, the above analysis does not take explicit account <strong>of</strong> perhaps the most importantdimension in competition between pharmaceuticals – that relating to the relative clinicalefficacy <strong>of</strong> the products concerned. In principle, the lack <strong>of</strong> a price or volume response to amajor price change in a substitute product might be understandable if the two products havevery different effects.2.66 However, analysis set out in Annexe M suggests that, under current arrangements,extremely close substitutes have very different prices. Since the products assessed areamong the largest selling in the NHS, this has major implications for value for money.We have identified hundreds <strong>of</strong> millions <strong>of</strong> pounds <strong>of</strong> expenditure that could be used morecost effectively – that is, in giving patients access to drugs and other treatments thatrepresent better value for money for the NHS but which are currently rationed. Changes tothe pricing regime could help address this.2.67 Arguments concerning therapeutic equivalence are even stronger in relation to an originatorproduct and a generic that is bioequivalent to it. Although here, as noted, there is a volumeresponse to generic entry (through the practice <strong>of</strong> prescribing by chemical name) pricedisparities between generics and originator products are such that we estimate that there isstill about £65m a year that could be used more effectively across the NHS through the use<strong>of</strong> more value-reflective prices for <strong>of</strong>f patent brands. 17 2717 DH has already issued a consultation document on the reimbursement <strong>of</strong> ‘standard branded generics’ on 20 January2005, suggesting that a range <strong>of</strong> branded generic products should be removed from the PPRS and reimbursed at thelesser <strong>of</strong> either the Drug Tariff price <strong>of</strong> the comparable true generic or the list price <strong>of</strong> the standard branded generic.DH then carried out a further round <strong>of</strong> consultation on this proposal, which closed on 24 October 2005. <strong>The</strong> consultationis on hold, pending the outcomes <strong>of</strong> this study.
<strong>The</strong> <strong>Pharmaceutical</strong> <strong>Price</strong> <strong>Regulation</strong> <strong>Scheme</strong>Competition in primary care to supply pharmacies2.68 NHS contractor pharmacies buy drugs from manufacturers and wholesalers, supply (or‘dispense’) them to patients with a GP prescription for a particular drug and are reimbursedfor doing so by the NHS.2.69 This section considers the process <strong>of</strong> competition to supply pharmacies. It first describes therole <strong>of</strong> pharmacies in primary care and the mechanics <strong>of</strong> pharmacy procurement andreimbursement before considering competition under two main scenarios: when GPs write aprescription for a brand (or when no generics are available for the pharmacy to dispense); andwhen GPs write a prescription using the chemical name (and generics are available).2.70 As discussed above, the nature <strong>of</strong> competition to supply pharmacies depends on how GPshave prescribed. When pharmacies are obliged to dispense a brand (either because a GPprescribed it or only that brand is available) they are reimbursed at the manufacturer’s listprice, which is controlled by PPRS. In such instances, it is suppliers <strong>of</strong> the branded productthat compete to sell to pharmacies. When pharmacies are able to dispense a generic, bycontrast, they have more supply options and are reimbursed at Drug Tariff prices.2.71 <strong>The</strong> first scenario accounts for about 75 per cent <strong>of</strong> community expenditure on drugs, whilethe second – prescriptions written and dispensed generically – accounts for about 25 per cent.2.72 Before looking more closely at competition in each scenario it is helpful to describe in moredetail the mechanics <strong>of</strong> pharmacy procurement and reimbursement that influence thecompetitive process. <strong>The</strong> situation is outlined in the diagram below.Figure 2.7: Financial flows relevant to primary care in the UKPrimary Care Organisations● Primary Care Trusts (England)● Local Health Boards (Wales)● Area Health Boards (Scotland)● Health & Social Security Boards (N Ireland)Mainly clinical incentivesGMSContractGPsClinical & cost-containmentincentivesBranded prescriptionfor on-patent drugPPRS<strong>Price</strong> controlsReimbursed at list priceminus clawbackFeesPharmacyContractReimbursed at DrugTariff price minus clawbackGeneric prescriptionfor <strong>of</strong>f-patent drug<strong>Scheme</strong> M etc.Generic pricingmechanismsPrescription formPharmaciesPrescriptioncharge or freePatientsWholesalersWholesalersPr<strong>of</strong>it controlsKEY:Manufacturers<strong>of</strong> brandeddrugsParallelimporters <strong>of</strong>branded drugsBranded andgenericmanufacturersFinancial flowsGuidance /constraint28
February 2007<strong>The</strong> mechanics <strong>of</strong> pharmacy procurement and reimbursement2.73 Pharmacies supply drugs to patients at the NHS flat-rate prescription charge (which isremitted to government), or for free, before being reimbursed each month by their PCO.Pharmacies’ payments and working conditions are governed by the national Pharmacycontract, negotiated in 2003 between the Department <strong>of</strong> Health and the <strong>Pharmaceutical</strong>Services Negotiating Committee (PSNC).2.74 Under the pharmacy contract, pharmacies in England received total Government funding <strong>of</strong>£1,766 million for 2005/06, a figure which has risen to £1,911 million for 2006/07.Contractually, £500 million <strong>of</strong> the funding comes through retained margin (that is, the marginbetween the price at which pharmacies buy drugs and the price at which they arereimbursed) 18 , and the remainder from pr<strong>of</strong>essional fees and other payments which dependon the level <strong>of</strong> service provided.Reimbursement prices2.75 <strong>The</strong> price at which prescriptions are reimbursed depends on whether they are written for abrand or a generic, and on the availability <strong>of</strong> true generics in the market. <strong>The</strong>re are twoscenarios to consider, which we call ‘reimbursing as a brand’ and ‘reimbursing as a generic’respectively.• reimbursing as a brand: For dispensing branded drugs against branded prescriptions (oragainst generic prescriptions where no true generic is available, for example when thechemical is still on patent 19 ) pharmacies are reimbursed at the manufacturer’s list priceless clawback, described below, and• reimbursing as a generic: For dispensing any drug (brand or generic) against a genericprescription where the chemical is <strong>of</strong>f patent and generic supplies are available,pharmacies are reimbursed at a price set down in the Drug Tariff, again less clawback.2.76 <strong>The</strong> pricing mechanism for controlling the manufacturer’s list price is the PPRS. Drug Tariffprices are set according to a variety <strong>of</strong> mechanisms, the most important <strong>of</strong> which is schemeM, where the price is based on quarterly surveys <strong>of</strong> transaction prices betweenmanufacturers, wholesalers and pharmacies.Clawback2.77 Pharmacies’ total reimbursements are arrived at after applying the clawback, which operatesdifferently around the UK. In England it is a sliding-scale deduction applied to pharmacies’total monthly payments, but elsewhere it is subtracted from reimbursements for individualitems. This is described in the table overleaf.18 As pharmacy purchase prices can not necessarily be forecast with perfect accuracy, the actual amount (measured frommargin surveys) may differ from the contractual amount. In the event, the retained purchase margin for 2006/07 was£650 million, rather than £500 million.19 Or when pharmacies can prove to the reimbursement processing authority that they were forced to dispense a brand dueto generics being unavailable.29
<strong>The</strong> <strong>Pharmaceutical</strong> <strong>Price</strong> <strong>Regulation</strong> <strong>Scheme</strong>Table 2.7: Clawback arrangements in the UKCountry Clawback on branded drugs 1 Clawback on generic drugs 2England and WalesBetween 5.63% and 11.5% <strong>of</strong> a pharmacy’s total monthly reimbursementdepending on size <strong>of</strong> claim less exempt items. According to the PSNC,nationally the deduction is about ten per cent <strong>of</strong> value at list prices.Average clawback (including zero discount products) is 9.2 per cent.Scotland 9.97% 13.5%Northern Ireland c. 9% c. 13%1 Dispensed to prescriptions for the brand or an on-patent chemical.2 Or branded drugs dispensed to prescriptions when generics are available.Note: slightly different clawbacks apply to dispensing doctors.2.78 <strong>The</strong> clawback was designed to share with the NHS the pr<strong>of</strong>its pharmacies can make bypurchasing drugs at below the price at which they are reimbursed. <strong>The</strong> sliding-scale systemin England and Wales, for example, assumes that the bigger pharmacies, making largerreimbursement claims, can obtain better discounts to list prices than small independents. <strong>The</strong>systems in Scotland and Northern Ireland assume that discounts are greater for generic drugs.Retained pr<strong>of</strong>it margin2.79 Pharmacy reimbursement in England includes £500 million retained pr<strong>of</strong>it margin. Inconsultation with the PSNC, DH regularly measures the margin actually obtained by a sample<strong>of</strong> pharmacies. This covers brands (including parallel imports) and generics and involvesauditing all the invoices <strong>of</strong> the sampled pharmacies for a particular month. <strong>The</strong> audited margin<strong>of</strong> the sample <strong>of</strong> pharmacies is then aggregated to the whole market for England. <strong>The</strong> PSNCtold us that, from next year, margin analysis would be carried out every month. Hitherto, ithas been done less frequently.2.80 <strong>The</strong> results <strong>of</strong> the margin analysis are used to ensure that pharmacies receive the retainedpr<strong>of</strong>it margin <strong>of</strong> £500 million. This is achieved by adjusting the margin when setting prices forCategory M drugs.Competition to supply pharmacies when a drug is reimbursedas a brand2.81 When a product is reimbursed as a brand, the suppliers competing to sell into the supplychain are the brand manufacturer and parallel importers. <strong>The</strong> reimbursement price is themanufacturer’s list price less claw back. For most products dispensed as a brand, the listprice is constrained by the PPRS price control (see Annexe J).Supply chain2.82 Manufacturers distribute their products either directly or through wholesalers. <strong>The</strong>re are twotypes <strong>of</strong> wholesalers: full-line (which carry the entire 25,000 product lines recognised by theNHS); and short-line (which carry only a small proportion <strong>of</strong> the NHS product list).30
February 20072.83 <strong>The</strong> PPRS price control constrains manufacturers’ list prices. It does not directly constrainmanufacturers’ net prices to wholesalers, nor wholesalers’ prices to pharmacies. However,we understand that, under the traditional model <strong>of</strong> supply through wholesalers, pricesthrough the supply chain are broadly as follows:• by traditional custom and practice, manufacturers sell to wholesalers at a 12.5 per centdiscount to list price• wholesalers sell to pharmacies at discounts depending on volume, with wholesalers’discounts averaging perhaps 10.5 per cent, and• pharmacies are reimbursed by the NHS at list price less clawback (which averages9.24 per cent <strong>of</strong> list price across all drugs). Assuming pharmacies buy at 10.5 per centbelow list price, this implies average pharmacy margin on drugs <strong>of</strong> around 1.26 per cent<strong>of</strong> list price.2.84 As noted above, the level <strong>of</strong> pharmacies’ aggregate retained margin in England is set in thepharmacy contract and does not depend on actual aggregate margins. Each individualpharmacy’s margin will however depend on the actual price at which it purchases fromwholesalers or manufacturers and on its individual clawback (which depends on its monthlyreimbursement total. Each individual pharmacy therefore has the incentive to purchase at thecheapest price.Parallel imports2.85 Pharmacies are reimbursed at list price, whether they dispense a brand sourced fromdomestic suppliers or from parallel importers. Thus, pharmacies have a strong incentive topurchase parallel imports if they are available more cheaply than supplies sourced directlyfrom the manufacturer.2.86 Parallel traders legally export brands from lower-priced to higher-priced countries in theEuropean Union (but to go on to sell them in the UK they must be licensed by the MHRA).When a product is dispensed as a brand, parallel trade is the only source <strong>of</strong> price competitionto manufacturers. UK prices are on average high relative to those in the rest <strong>of</strong> Europe,making the UK a major destination for parallel trade. In 2005, parallel imports supplied about18 per cent by value <strong>of</strong> branded drugs prescribed in UK primary care, or about £1.25 billion atlist prices.Summary and conclusions on reimbursing as a brand2.87 <strong>The</strong> NHS reimburses pharmacies at manufacturer’s list price (which is constrained by thePPRS price control) less clawback (which depends on the pharmacy’s monthly reimbursementtotal). Each pharmacy’s reimbursement price is not affected by what it actually pays for thebrand, and hence pharmacies are motivated to purchase from the cheapest source <strong>of</strong> supply.<strong>The</strong> cheapest source <strong>of</strong> supply may be direct from the manufacturer or from a wholesalerwhich may itself source from parallel imports or the manufacturer.2.88 We have not had access to information on pharmacies’ actual margins but rough estimatessuggest that the average margin on UK-sourced supplies is about 1 to 1.5 per cent <strong>of</strong> list price.31
<strong>The</strong> <strong>Pharmaceutical</strong> <strong>Price</strong> <strong>Regulation</strong> <strong>Scheme</strong>Competition to supply pharmacies when a drug is reimbursedas a generic2.89 When GPs write generic prescriptions for an <strong>of</strong>f-patent chemical, a range <strong>of</strong> suppliers competeto sell to pharmacies. Competing suppliers include the manufacturer <strong>of</strong> the originator brand,makers <strong>of</strong> all bioequivalent generics (including branded generics) and parallel importers.2.90 <strong>The</strong> supply chain for generics is similar to that for branded drugs, involving manufacturers,wholesalers (short line and/or full line) or direct supply and pharmacies. Competition betweengeneric manufacturers tends to be vigorous, and consequently for most products they havelittle ability to sell at higher prices in the UK than other EU countries. Hence, parallel imports<strong>of</strong> generics tend to be unimportant.2.91 Individual pharmacies’ reimbursement prices for generic drugs do not depend on what theyindividually pay for the drug. Again, therefore, pharmacies are strongly motivated to purchasefrom the cheapest supplier. We discuss some aspects <strong>of</strong> competition to supply pharmacies inthe following sections. We consider first competition between generic manufacturersthrough <strong>Scheme</strong> M and second competition between branded and generic suppliers.Competition between generic manufacturers: <strong>Scheme</strong> M2.92 Around 90 per cent <strong>of</strong> generic medicines (by value) are listed under Category M <strong>of</strong> the DrugsTariff. <strong>Price</strong>s for drugs in Category M are set by DH and are based on a calculation thatincorporates the volume-weighted average prices charged by generics manufacturers in the UK. 202.93 <strong>The</strong> use <strong>of</strong> average prices among manufacturers aligns the reimbursement <strong>of</strong> generic drugswith the market conditions in which they are sold. This process maintains the incentives forindividual pharmacies to procure generic drugs efficiently, as reimbursement is based onaverage prices and pharmacies can negotiate with suppliers to secure a better than averageprice. Rules governing this system are set out in an agreement known as <strong>Scheme</strong> M.2.94 <strong>Scheme</strong> M has led to strong competitive pressure on generics prices, with UK prices held tobe among the lowest in Europe. <strong>The</strong> system is considered to be a well managed and efficientform <strong>of</strong> pricing generics, which has worked well to ensure that competition between genericmanufacturers delivers savings for the NHS. <strong>The</strong>re was, initially at least, some concern aboutthe volatility <strong>of</strong> generics prices, although these have now largely been addressed.2.95 However, under the current arrangements, drugs dispensed as generics contribute the bulk<strong>of</strong> the £500 million retained pharmacy margin under the pharmacy contract, and pharmacies’average margin on generics is considerably higher than on brands. While margins ondomestically sourced brands are generally about 1 to 1.5 per cent, we understand thatmargins on some generics, in particular some category M drugs, are much higher –sometimes over 50 per cent.2.96 <strong>The</strong> reimbursement regime is very different for on-patent brands, which are currently pricedunder PPRS. <strong>The</strong> very different level <strong>of</strong> margin attached to generic and brandedreimbursement is a potential source for concern. This can be a source <strong>of</strong> considerableadvantage to branded manufacturers competing with generics, since it allows them to markettheir products to GPs and PCOs as cheaper than generics and yet still to sell to pharmaciesat a much higher price. This has the potential to distort competition between brands andgeneric equivalents in the market for GP prescriptions.20 <strong>The</strong> average is a volume-weighted average factory-gate price charged by generic manufacturers, which are obtained fromquarterly surveys. A stochastic element is added to the calculations each quarter, to avoid gaming.32
February 2007Branded and generic competition: brand equalisation2.97 Generic prescriptions can be filled by either branded or generic versions <strong>of</strong> the drugprescribed. A number <strong>of</strong> branded drug manufacturers compete with generics in supplying thepharmacy against a generic prescription.2.98 One approach, known as brand equalisation, involves the brand manufacturer <strong>of</strong>fering apharmacy a single blended price for the supply <strong>of</strong> the branded drug to be dispensed againstboth branded and generic prescriptions. <strong>The</strong> blended price may provide the pharmacy with agreater margin than stocking both branded and generic drugs. This is pr<strong>of</strong>itable formanufacturers as long as the lower prices are still above the costs <strong>of</strong> supply. Estimates fromthe British Generic Manufacturers Association (BGMA) suggest that brand equalisation mayaccount for on average 10 to 15 per cent <strong>of</strong> the total supply <strong>of</strong> generic prescriptions.Conclusion on competition to supply pharmacies2.99 This section has assessed the nature <strong>of</strong> competition to supply pharmacies. This willprovide a basis for an assessment <strong>of</strong> the effects <strong>of</strong> the PPRS and options for reform lateron in the report.2.100 When a drug is reimbursed as a brand (as is the case for reimbursement <strong>of</strong> on-patent drugsand branded prescriptions), competition is between the branded manufacturer and parallelimporters to supply the pharmacy. When a drug is reimbursed as a generic, competition isprimarily between generic manufacturers through <strong>Scheme</strong> M, but may also come frombranded suppliers, for example through brand equalisation deals, and, to a lesser extent,parallel importers. In both cases, pharmacies are strongly incentivised to negotiatecompetitive prices with suppliers, delivering savings to the NHS providing these are pickedup through margin analysis.2.101 However, differences in the method <strong>of</strong> calculating reimbursement prices between brands andgenerics mean that the levels <strong>of</strong> margin earned on dispensing as a brand (at least, fordomestically-sourced supply) are much lower than those earned on dispensing as a generic.This can be a source <strong>of</strong> considerable advantage to branded manufacturers competing withgenerics, since it allows them to market their products to GPs and PCTs as cheaper thangenerics and yet still to sell to pharmacies at a higher price. This also increases costs to the NHS.Hospitals2.102 Hospitals across the UK purchase their own drugs, negotiating purchase prices that are <strong>of</strong>tenbelow manufacturer’s list or Drug Tariff prices. Hospitals can also control prescribing withmore certainty than primary care organisations. Hospital doctors are employees so adherenceto formularies, or guidance put out by internal Drugs and <strong>The</strong>rapeutics Committees, can bemade a contractual term <strong>of</strong> employment.Incentives to procure drugs2.103 In general NHS hospitals have sharper incentives to contain drug costs than PCOs and GPs.This is mostly due to how hospitals are funded and is especially true in England, where hospitalscompete for business from PCTs in an internal market for healthcare interventions. Under thissystem <strong>of</strong> ‘Payment by Results’ (PBR) most services delivered by hospitals are subject to aNational Tariff, set according to the average national cost <strong>of</strong> delivering it, though regional33
<strong>The</strong> <strong>Pharmaceutical</strong> <strong>Price</strong> <strong>Regulation</strong> <strong>Scheme</strong>variations in the costs <strong>of</strong> inputs such as land and wages do lead to slightly different Tariff pricesaround the country. Hospitals that cannot deliver services at or below Tariff prices run intodeficit. But hospitals that obtain inputs to services more cheaply than the Tariff can make pr<strong>of</strong>itsover time. <strong>The</strong> commercial pressure that the Tariff applies is likely to be fairly strong since policyin England appears to be that financially failing hospitals will be allowed to fail.2.104 Hospitals are not subject to the internal market model elsewhere in the UK. Instead, hospitalsnegotiate and agree their funding with either their local primary care organisation or centralauthorities. In Scotland, hospitals are explicitly jointly-funded with Area Health Boards by theScottish Executive Health Department. In Wales and Northern Ireland, hospitals are stillnominally funded by a process <strong>of</strong> PCOs choosing between them to commission services.2.105 Despite the differences in their funding, hospitals all around the UK purchase their owninputs and stand to gain directly from doing so, conferring incentives to purchase drugsefficiently. Like pharmacies in primary care, hospitals endeavour to beat a reimbursementsystem that is based in some way on average costs. <strong>The</strong> difference is that when hospitalsare successful savings accrue directly to the NHS, whereas savings made by pharmaciesneed to be recovered through the clawback.Procurement methods2.106 Because clinician compliance with hospital formularies, while variable, is relatively strong,hospitals have a greater potential to exploit buyer power than in primary care. Further,because they realise immediate benefits from purchasing drugs efficiently they have strongincentives to do so. As a result, joint procurement arrangements have sprung up around theUK, between hospitals at local, regional and sometimes national levels.2.107 In England, the NHS Purchasing and Supplies Agency (PASA) arranges National FrameworkAgreements for the purchase <strong>of</strong> generic drugs for hospitals and has begun overseeing 14regional Pharmacy Service Groups that procure branded drugs. National FrameworkAgreements are not legally binding contracts but, rather, negotiated templates <strong>of</strong> terms andconditions serving as the basis for local contracts. <strong>The</strong>y do quote national prices.2.108 <strong>The</strong> Pharmacy Service Groups employ variable approaches in comparison. Some concentrateon securing volume discounts for specific branded drugs. Others put out therapeutic tendersto which all suppliers <strong>of</strong> products relevant to a given clinical intervention are invited to bid, thatis, manufacturers, wholesalers and parallel importers <strong>of</strong> broadly therapeutically substitutabledrugs. Procuring brands is more fraught for groups <strong>of</strong> hospitals than procuring genericsbecause hospitals can disagree on the clinical merit <strong>of</strong> competing on-patent products whichare necessarily different from one another. By comparison, once a decision has been made togo with a particular <strong>of</strong>f-patent chemical it is relatively easy to focus on cost.2.109 In Wales, Scotland and Northern Ireland, much the same issues are encountered. In Wales,the All-Wales Drugs Contracting Committee (AWDCC) organises centralised tenders for bothbranded and generic drugs, though Welsh hospitals also make some purchases unilaterally. InScotland the Scottish Pharmacologistics Group (SPG) and National Procurement Organisationtogether award national contracts for generic drugs, whilst branded medicines are jointlyprocured by regional groups <strong>of</strong> hospitals. In Northern Ireland, the Regional Supplies Service(RSS) contracts on behalf <strong>of</strong> hospitals for a large number <strong>of</strong> drugs, both branded and generic.34
February 2007Savings in the hospital sector2.110 We calculated the discount obtained by hospitals on the fifty drugs on which they spent themost in the calendar year 2005. <strong>The</strong> data used was provided by PASA from their Pharmexdatabase that has recorded all drugs transactions made by over 150 English hospital trustssince 2003.2.111 Approximately a third (£550 million) <strong>of</strong> hospital expenditure on brands in England was spenton the fifty most costly drugs (hospital expenditure on all drugs was £1.6 billion in 2005). <strong>The</strong>total discount obtained by hospitals on this expenditure (below the price listed in the BNF)was about £77 million (or 12.3 per cent). This is only about two per cent higher than thediscount typically secured by a pharmacy on its purchases <strong>of</strong> branded drugs. Indeed,inasmuch as hospitals purchase direct from manufacturers, this figure is broadly comparableto the 12.5 per cent discount at which manufacturers typically sell branded products towholesalers. Assuming the same percentage discount is obtained on the remaining drugs,the total value <strong>of</strong> discounts to hospitals would be approximately £230 million.2.112 However, there is variation in the discounts obtained across drugs. Various factors mightexplain this. For example, hospitals’ ability to negotiate discounts (for example throughtherapeutic tendering) may in part be determined by the therapeutic closeness <strong>of</strong> availablesubstitutes, as this would be expected to strengthen their bargaining positions.2.113 In order to examine whether the existence <strong>of</strong> close therapeutic substitutes is an importantfactor in determining hospital discounts, we calculated the discounts obtained for eight drugswith no other drugs in the same BNF Paragraph (using BNF Paragraph as a proxy forsubstitutability <strong>of</strong> alternative drugs). 21 <strong>The</strong> average discount obtained on these drugs was 9.5per cent (ranging from three per cent to 11 per cent). <strong>The</strong> average is thus lower than for thefifty drugs <strong>of</strong> highest expenditure, and with a smaller range.2.114 <strong>The</strong>n we looked at three on-patent drugs (in various forms and pack sizes) used to treatcommon conditions <strong>of</strong> the cardiovascular system. As a result, each therapeutic area withinthe cardiovascular system (statins for cholesterol, calcium-channel blockers for hypertension,etc) has attracted several broadly substitutable products with somewhat distinct chemicalaction. For data as <strong>of</strong> early 2005, we found that hospitals achieved discounts to PPRS listprice ranging from seven per cent to 37 per cent. This contrast suggests that the existenceor not <strong>of</strong> therapeutic substitutes is important in whether hospitals are able to negotiatefavourable deals on drugs.2.115 One estimate <strong>of</strong> the savings in the hospital sector comparable to primary care wasundertaken by the NAO Wales in 2003. Of particular interest in this report was the findingthat, ‘<strong>The</strong> All Wales Drugs Contracting Committee prices were, on average, 50 per centlower than those obtained in primary care’. 222.116 While we were unable to obtain sufficient data to control simultaneously for all effectsrelevant to hospital discounts, our results do at least confirm empirically that, by one meansor another, hospitals can induce reasonable competition among suppliers when real choicesexist. In particular, the closeness <strong>of</strong> therapeutic substitutes was found to be an importantfactor in determining the size <strong>of</strong> discounts, suggesting that hospitals are able to usetherapeutic tendering effectively to obtain greater discounts.21 <strong>The</strong> vast majority <strong>of</strong> drugs do have substitutes in the same Paragraph (48 out <strong>of</strong> the top 50 by hospital expenditure).22 <strong>The</strong> report also notes that, ‘Only a minority <strong>of</strong> primary care medicines are covered by All Wales Drugs ContractingCommittee prices: some 500 out <strong>of</strong> 14,000 items.’ Source: ‘<strong>The</strong> procurement <strong>of</strong> primary care medicines’ – Report by thenational Audit <strong>Office</strong> Wales on behalf <strong>of</strong> the Auditor General for Wales, March 2003.35
<strong>The</strong> <strong>Pharmaceutical</strong> <strong>Price</strong> <strong>Regulation</strong> <strong>Scheme</strong>Conclusion2.117 <strong>The</strong> PPRS is best thought <strong>of</strong> as a means <strong>of</strong> exercising buyer power in the purchase <strong>of</strong>prescription pharmaceuticals across the NHS. A strong justification for some form <strong>of</strong> UK-widepricing scheme is the need to ensure money spent on prescription drugs represents value formoney. While there is variation at a local level, prescribers in primary care generallydemonstrate low price sensitivity. Under current arrangements, some products with veryclose clinical effects but wide disparities in price achieve high prescribing volumes, raising amajor question as to whether value for money is being secured.2.118 In relation to competition to supply pharmacies, very different methods are used to setreimbursement prices for brands (PPRS) and generics (a variety <strong>of</strong> mechanisms butpredominantly <strong>Scheme</strong> M). In both cases, pharmacies are strongly incentivised to negotiatecompetitive prices with suppliers, delivering savings to the NHS providing these are pickedup through margin analysis. However, these methods allow pharmacies to secure muchhigher margins on generics than on brands. Where <strong>of</strong>f-patent brands are in competition withgenerics, this is a source for concern, since it gives branded manufacturers a strongcompetitive advantage, allowing them to market their products to GPs and PCOs as cheaperthan generics and yet still to sell to pharmacies at a much higher price.2.119 We explore potential options to address these concerns in Chapter 5.36
February 20073 DRUG PRICES AND GLOBAL INVESTMENT INCENTIVESIntroduction3.1 This Chapter considers UK pharmaceutical prices in a global context. Its main purpose is toconsider to what extent UK prices – and hence a UK pricing scheme – can affect incentivesto invest in pharmaceuticals.3.2 It begins with a global overview <strong>of</strong> the pharmaceutical sector, before reviewing availableevidence on the cost structure <strong>of</strong> pharmaceuticals – in particular considering what proportion<strong>of</strong> costs are international, in the sense that they can be incurred anywhere in the world forsupply to a particular country. This provides a basis for considering the two central questions<strong>of</strong> this Chapter:• whether UK prices can affect incentives to invest in drugs, and• whether UK prices can have an effect on the location <strong>of</strong> internationally mobilepharmaceutical investments and, in particular, be used to attract such investmentsto the UK.3.3 <strong>The</strong> first question unambiguously relates to one <strong>of</strong> the central objectives <strong>of</strong> the PPRS. Somestakeholders also regard the second as one <strong>of</strong> the scheme’s implicit aims, although there isdisagreement over this point. Finally, a brief comparison is made <strong>of</strong> UK drug prices and thosein other countries, before conclusions are drawn.3.4 More detailed analysis <strong>of</strong> the issues addressed in this chapter is provided in Annexes D, Eand F.Global overview <strong>of</strong> pharmaceuticals3.5 <strong>Pharmaceutical</strong>s is a global business. This section provides a brief overview <strong>of</strong> globalexpenditure by country and by product and describes the various stages <strong>of</strong> a drug’s lifecycle,before reviewing available evidence on the cost structure <strong>of</strong> pharmaceuticals.Global expenditure3.6 IMS estimates suggest that 2005 global pharmaceutical sales totalled US $602 billion, agrowth <strong>of</strong> seven per cent from the previous year (sales US $ 550 billion). As shown in Figure3.1 below, the market has grown rapidly in recent years, with growth rates varying betweenseven and twelve per cent per annum. Total sales are projected by IMS to continue to growbetween five and eight per cent over the next few years.3.7 <strong>The</strong>se figures include sales <strong>of</strong> both branded drugs and generics. Brands continue to accountfor the bulk <strong>of</strong> global sales by value.37
<strong>The</strong> <strong>Pharmaceutical</strong> <strong>Price</strong> <strong>Regulation</strong> <strong>Scheme</strong>Figure 3.1: Global pharmaceutical sales (US $billion)6506005505004504003503002501998 1999 2000 2001 2002 2003 2004 2005Source: IMS, ‘Global <strong>Pharmaceutical</strong> Perspectives 2005’, IMS Health Total Market Estimates and Global Pharma Forecasts(total sales include IMS audited figures and IMS estimates for unaudited markets);3.8 Figure 3.2 below shows global sales in 2005, broken down by world regions. North Americaaccounts for the largest proportion <strong>of</strong> the world market (46.8 per cent). <strong>The</strong> UK on its ownaccounts for circa 3.45 per cent <strong>of</strong> world pharmaceutical sales, down from an estimated 3.9per cent in 2004. Europe as a total (including the UK and Germany) accounts for 30.6 percent <strong>of</strong> total sales.Figure 3.2: Breakdown <strong>of</strong> pharmaceutical sales by value by region in 2005North America,46.8%Latin America,4.24%Asia / Africa /Australia,8.20%Japan,10.66%Rest <strong>of</strong> Europe,20.9%UK,3.45%Germany,5.62%Source: IMS, ‘Global <strong>Pharmaceutical</strong> Perspectives 2005’ (world audited market) and OFT calculations. 2323 Rest <strong>of</strong> Europe (all other European Countries except the UK and Germany)38
February 20073.9 Figure 3.2 shows that the UK accounts for less than four per cent <strong>of</strong> global pharmaceuticalsales. It might be inferred from this that UK pricing policy can have only very limited effectson the pharmaceutical industry as a whole. However, as discussed in more detail below, thisis not the case.3.10 Table 3.1 shows the top ten brands and the top ten therapeutic classes by global sales in2005. <strong>The</strong> best-selling products are those which treat chronic conditions, where the patienttakes medicine on an ongoing basis. <strong>The</strong> best-selling drugs in 2005 were Lipitor and Plavix,the first treating high levels <strong>of</strong> cholesterol, and the second preventing hearth attacks andstrokes by targeting blood platelets. <strong>The</strong> two biggest selling drugs in 2004 were Lipitor andZocor, both <strong>of</strong> which are cholesterol-reducing drugs. <strong>The</strong> patent <strong>of</strong> Zocor has now expired inmost countries.Table 3.1: <strong>The</strong> top ten brands by global pharmaceutical sales 2005 and 2004Leading brands (2005) Type <strong>of</strong> drug Global Sales Global Sales2005 2004$bn % $bn %1 Lipitor (atorvastatin) Cholesterol-regulating drug 12.9 2.3 12.0 2.32 Plavix (clopidogrel) Antiplatelet drug 5.9 1.0 5.0 1.03 Nexium (esomeprazole) Ulcer-healing drug 5.7 1.0 4.8 0.94 Seretide/Advair Bronchodilator /corticosteroid(fluticasone+salmeterol) 5.6 1.0 4.7 0.95 Zocor (simvastatin) Cholesterol-regulating drug 5.3 0.9 5.9 1.16 Norvasc (amlodipine) Calcium-channel blocker 5.0 0.9 4.8 0.97 Zyprexa (olanzapine) Antipsychotic drug 4.7 0.8 4.8 0.98 Risperdal (risperidone) Antipsychotic drug 4.0 0.7 -- --9 Ogastro/Prevacid Ulcer-healing drug 4.0 0.7 3.8 0.7(lansoprazole)10 Effexor (venlafaxine) Antidepressant drug 3.8 0.7 3.7 0.7TOTAL Leading ten Brands $56.9 10.1 $53.6 10.3Source: IMS, ‘Global <strong>Pharmaceutical</strong> Perspectives 2005 and 2004’3.11 In 2005, 30 new chemical entities (NCE) were launched globally (compared with 30 in 2003and 31 in 2004). Annual launches have remained around this figure since 2000, but thisrepresents a significant fall from the 1990s, which saw between 35 and 50 NCE launchesper year.39
<strong>The</strong> <strong>Pharmaceutical</strong> <strong>Price</strong> <strong>Regulation</strong> <strong>Scheme</strong><strong>The</strong> lifecycle <strong>of</strong> a drug3.12 <strong>The</strong> diagram below presents a schematic overview <strong>of</strong> the drug production process, frombasic discovery to generic entry after patent expiry. Box 3.1 contains a brief description <strong>of</strong> thekey stages.Figure 3.3: Lifecycle <strong>of</strong> a drugNumber <strong>of</strong> molecules screenedPatent applicationAcute toxicityPharmacologyChronic toxicityPhase IPhase IIPre-clinical trialsClinical trialsPhase IIIMHRA / EMEA marketing authorisationGeneric entryManufacturing / Marketing / DistributionBasicResearchR&D0 5 years 10 years 15 years 20 yearsPatent expiry25 yearsSPC max. +5 yearsBox 3.1: Stages in the lifecycle <strong>of</strong> a drug1. Basic research is sometimes conducted within public sector institutions such as universities.2. <strong>Pharmaceutical</strong> companies can acquire patent protection once basic research has led to theidentification <strong>of</strong> promising New Molecular Entities (NMEs).3. Pre-clinical trials precede any testing on humans, and involve rigorous testing <strong>of</strong> selectedNMEs in laboratories and animals. Less than one per cent <strong>of</strong> compounds successfully makethe transition from pre-clinical to clinical trials.4. Clinical trials are carried out in humans. Three stages <strong>of</strong> trials are carried out before drugscan receive marketing authorisation. An estimated 21.5 per cent <strong>of</strong> drugs successfully passthrough clinical trials. <strong>The</strong> different stages are:• Phase I trials in 20-100 healthy adults to test the drug’s safety;• Phase II trials in 100-300 patient volunteers to determine the safety and efficacy <strong>of</strong> the drug;• Phase III trials on larger groups <strong>of</strong> patients (typically 1,000–3,000), to gain further data onsafety and efficacy;5. Marketing authorisation must then be obtained before drugs can be launched onto the market;6. After drugs reach the market, Phase IV pharmaco-vigilance trials begin. <strong>The</strong>se seek to identifyany adverse drug reactions and continue throughout a drug’s lifetime.7. Generic manufacturers are able to enter the market and sell generic copies <strong>of</strong> the drug after adrug’s patent (and any supplementary protection certificate) has expired.40
February 2007Cost structure <strong>of</strong> the pharmaceutical industry3.13 <strong>The</strong> costs involved in developing, producing and marketing a drug can be categorisedaccording to where they are incurred and whether they vary with the volume <strong>of</strong> sales and / orthe countries in which the drugs are sold.• R&D is an international activity in the sense that it can be located wherever a suitableresearch environment exists. Moreover, once a drug has been developed, the R&D costdoes not need to be incurred again to make the drug available in other countries (R&D isa ‘globally common cost’)• manufacturing also can be located anywhere in the world (although some transportcosts are involved in getting products to different markets around the world) andeconomies <strong>of</strong> scale usually mean that manufacturing <strong>of</strong> each drug is in fact concentratedin a small number <strong>of</strong> locations in the world. Selling a drug in an additional market causessome additional manufacturing costs to be incurred – for example the variable costs <strong>of</strong>materials and labour, and• the remaining costs are mostly incurred in the country <strong>of</strong> sale and are specific to thecountry in which they are carried out. <strong>The</strong>se include some distribution costs and thecosts associated with marketing and other activities (including interactions withgovernment pricing and reimbursement agencies).R&D costs3.14 <strong>The</strong> costs <strong>of</strong> R&D per approved drug have risen considerably over the past 30 years. Thispartly reflects increasing overall expenditure on R&D and partly the decline in the number <strong>of</strong>NCEs receiving approval over the period. DiMasi et al (2003) 24 calculated R&D costs for asample <strong>of</strong> 68 drugs first tested on humans between 1983 and 1994. According to theirestimates, the capitalised value <strong>of</strong> R&D expenditure in 2000 averaged $802 million perapproved new drug.3.15 Global year on year R&D expenditure currently averages about 16 per cent <strong>of</strong> sales. However,this investment takes place years in advance <strong>of</strong> sales being generated, imposing financingcosts on the company in the intervening period. <strong>The</strong>refore R&D represents a significantlyhigher proportion <strong>of</strong> the economic costs <strong>of</strong> pharmaceutical companies. Estimates <strong>of</strong> proportion<strong>of</strong> economic costs accounted for by R&D range between about 30 and 40 per cent. 25Overall cost breakdown3.16 Reinhardt (2001) 26 suggests that manufacturing costs represent about 27 per cent <strong>of</strong> salesvalue and that sales, general and administrative costs account for some 35 per cent. Asnoted above, this latter component <strong>of</strong> costs can be considered primarily national in scope.24 Di Masi et al (2003) ‘<strong>The</strong> <strong>Price</strong> <strong>of</strong> Innovation: New Estimates <strong>of</strong> Drug Development Costs’, Journal <strong>of</strong> Health Economics22 (2003), 151-185;25 Annexe D provides further details.26 Reinhardt, U (2001), ‘Perspectives on the <strong>Pharmaceutical</strong> Industry’, Health Affairs, 20:5, 141.41
<strong>The</strong> <strong>Pharmaceutical</strong> <strong>Price</strong> <strong>Regulation</strong> <strong>Scheme</strong>3.17 Analysis we have undertaken (from companies’ annual financial returns (AFRs) to DH underthe PPRS) <strong>of</strong> costs incurred in the UK provide some support for these estimates. <strong>The</strong>sesuggest total sales promotion and information costs in the UK average about 18 per cent <strong>of</strong>sales value, distribution costs average about three per cent and general and administrativecosts about 12 per cent <strong>of</strong> sales value (see Annexe H).3.18 Based on the evidence quoted in Annexe D, our broad brush estimate <strong>of</strong> the cost structure <strong>of</strong>the pharmaceutical industry suggests that <strong>of</strong> the order <strong>of</strong> 65 to 70 per cent <strong>of</strong> economiccosts are internationally mobile (35 per cent R&D and 30 to 35 per cent manufacturing andother) with around 30 to 35 per cent national in scope. This fact is important understandingthe potential significance <strong>of</strong> UK pharmaceutical prices on global investment decisions. Weassess this issue in the next section.Impact <strong>of</strong> UK prices on incentives to invest3.19 This section considers to what extent prices in the UK can have an effect on investment inthe pharmaceutical sector. We address two distinct issues: whether UK prices can affectincentives to invest in new drugs in the future; and whether UK prices affect incentives tolocate investments in the UK.Incentives to invest in drugs3.20 <strong>The</strong> PPRS sets out not just to deliver reasonable prices to the UK but to allow sustainedinvestment in drugs for the future. A key question here is whether pharmaceutical pricesin the UK can have any effect on the incentives <strong>of</strong> companies to invest in certain drugs.As noted above, the costs <strong>of</strong> R&D (and certain global manufacturing facilities) can becharacterised as global common costs. It is not therefore clear to what extent incentives toincur such costs are affected by revenues in any country that represents a relatively smallproportion <strong>of</strong> global demand. <strong>The</strong>re may be some scope for such countries not to remuneratethese costs, thus ‘free riding’ on the prices paid by other countries.3.21 <strong>Pharmaceutical</strong> prices in the UK will obviously have a direct effect on the revenues thatcompanies earn from UK sales. However, this effect is likely to be relatively small in a globalcontext, because the UK market represents less than four per cent <strong>of</strong> global sales.3.22 However, some countries base their prices, in part or in full, on prices in other countries (thisis known as ‘international reference pricing’). As a result <strong>of</strong> international reference pricing, acountry to which other countries link their prices will have a greater effect on global returnsto R&D than the size <strong>of</strong> that country’s pharmaceutical market would suggest. <strong>The</strong> UK has aparticularly important effect in this respect. We have found that:• countries which reference pharmaceutical prices to the UK include Japan, France, Italy,Canada, Belgium, Switzerland, Poland, Netherlands, Finland, Hungary, Norway andIreland, and• together, these markets account for around 25 per cent <strong>of</strong> world pharmaceuticals sales.However, not all products in these countries are referenced to the UK. <strong>The</strong> importance <strong>of</strong>international referencing pricing in the overall pricing regime varies between thesecountries, as does the number <strong>of</strong> countries included in each nation’s reference basket.Annexe K provides further details.42
February 20073.23 <strong>The</strong> figure below shows the importance <strong>of</strong> the UK as a country to which others referencetheir prices. UK prices may have further ‘ripple’ effects as a result <strong>of</strong> other countries whichdo not reference directly to the UK but do reference to one <strong>of</strong> the above countries. This canalso be observed in the diagram.Figure 3.4: Overview <strong>of</strong> countries that reference to the UKFranceFinlandMexicoBelgiumCanadaNetherlandsNorwayUKJapanIrelandSpainItalyPolandHungaryDenmarkSwitzerlandKEY:Direct referencing between country A and the UKReferencing <strong>of</strong> country A to any other countryCountry that potentially references to the UK, but is unlikely to in practiceSource: Internal OFT Analysis3.24 We have also heard that UK prices – and the assessments <strong>of</strong> expert bodies such as NICE –are <strong>of</strong>ten used informally in price negotiations around the world, even where they are notused in formal reference price schemes.3.25 To conclude, the impact that UK prices have on global returns to R&D is likely to besignificant, despite the relatively low proportion <strong>of</strong> global sales generated in the UK. Giventhis importance we believe that a UK pricing scheme can and should take into account theeffect that the prices it sets have on global investment incentives. In particular, as discussedlater in this report, it is our view that the UK has a significant opportunity, through the PPRS,to provide incentives to invest in areas <strong>of</strong> the greatest clinical need.43
<strong>The</strong> <strong>Pharmaceutical</strong> <strong>Price</strong> <strong>Regulation</strong> <strong>Scheme</strong>Incentives to locate investment in the UK3.26 Internationally mobile investments such as R&D and some manufacturing investments arealso important from an ‘industrial policy’ perspective. For a variety <strong>of</strong> reasons – such as thespillover effects R&D may have on other sectors and its consequent contribution toeconomic growth – many governments seek to encourage companies to locate theseinvestments within their national boundaries, and use a range <strong>of</strong> industrial policy instrumentsin an attempt to do so.3.27 Some stakeholders regard the PPRS as an important component <strong>of</strong> the UK Government’sindustrial policy towards the pharmaceutical industry – that is, as a means <strong>of</strong> attracting andretaining pharmaceutical R&D and other internationally mobile investments within the UK.While major stakeholders disagree over whether this is one <strong>of</strong> the scheme’s aims, it isimportant to assess whether the PPRS does achieve such objectives in practice.Rationale for attracting pharmaceutical investment in the UK3.28 <strong>The</strong> industrial policy <strong>of</strong> the UK Government (and indeed other governments) focusses onattracting and retaining investment in the international (and therefore ‘footloose’) component<strong>of</strong> the supply chain. This was part <strong>of</strong> the rationale behind the creation <strong>of</strong> the <strong>Pharmaceutical</strong>Industry Competitiveness Taskforce (PICTF), which is now known as the Ministerial IndustryStrategy Group (MISG).3.29 Consistent with this goal, the UK Government announced in 2004 that it was setting a newtarget for attracting R&D into the UK across the whole economy"… because we want Britain to be the most attractive location in the world for science andinnovation, we are setting a new and ambitious target <strong>of</strong> increasing UK R&D investment asa proportion <strong>of</strong> national income from its current level <strong>of</strong> 1.9 per cent to 2.5 per cent by2014 over the next decade." 273.30 Of the various potential economic rationales for attracting R&D in the UK, the most plausibleare those that are based on geographical spillovers – that is, benefits from R&D that accrue toother companies located near the investment in question. Other potential justifications are lesscompelling and, in some cases, are based on a conflation <strong>of</strong> the aim <strong>of</strong> attracting investmentin the UK with that <strong>of</strong> supporting UK-owned firms, whether located in the UK or not. 283.31 A previous attempt to quantify these benefits – conducted for PICTF in 2000 – suggestedR&D spillovers and labour rents could reach up to £520m. It also suggested that there is apotential terms <strong>of</strong> trade effect <strong>of</strong> between £1 and £2bn, although this figure is a significantoverestimate as it takes no account <strong>of</strong> <strong>of</strong>fsetting effects – namely the fact that resourcescurrently allocated to the pharmaceutical sector would be used elsewhere to produceexportable goods or to replace imported goods. We think there would be merit in revisitingsome <strong>of</strong> the calculations in light <strong>of</strong> more recent data and the considerations set out in thepresent report.27 Source: <strong>The</strong> UK Government’s Science and Innovation Investment Framework 2004-2014, published in July 2004.28 Such a goal is not, to our knowledge, consistent with current Government policy. Further, the global nature <strong>of</strong> shareownership means that it would be unclear to what extent any individual firm is solely or even mainly owned by UKcitizens.44
February 2007UK success in attracting pharmaceutical R&D investment3.32 <strong>The</strong> figure below shows total Business Expenditure on R&D (BERD) as a percentage <strong>of</strong> GDPacross several countries for 2002 and 2003 (the most recent years for which data wereavailable). Against this measure, the UK was the fourth most successful country in attractingpharmaceutical R&D investment in the world.3.33 In 2002 pharmaceutical industry business expenditure on R&D accounted for 0.33 per cent <strong>of</strong>GDP in the UK. This compares with Sweden (0.61 per cent), Denmark (0.4 per cent) andBelgium (0.39 per cent). Notably, the UK is the highest performing <strong>of</strong> the larger economies,ahead <strong>of</strong> France and Japan (both 0.19 per cent), the US (0.14 per cent) and Germany (0.13per cent).3.34 <strong>The</strong> important question from a policy perspective is which factors help to explain the ability <strong>of</strong>the UK to attract and retain investment.Figure 3.5: <strong>Pharmaceutical</strong> BERD as a percentage <strong>of</strong> GDP, 2002/20033.253.002.752.50Pharma BERD (% GDP)Other BERD (% GDP)2.252.001.751.501.251.000.750.500.250.00BelgiumCanada (2003)DenmarkFinland (2003)FranceGermany (2003)Italy (2003)JapanNetherlandsSpainSweden (2003)United KingdomUnited StatesSource: OECD (Figures relate to 2002 unless otherwise stated)Does PPRS attract investment into the UK?3.35 Our analysis <strong>of</strong> the workings <strong>of</strong> the pr<strong>of</strong>it cap element <strong>of</strong> the PPRS has shown that, contraryto widespread perceptions, the scheme does not contain any systematic incentives tolocate investments within the UK.3.36 <strong>The</strong> R&D allowances provided for under the scheme can, in principle, relate to R&Dinvestment anywhere in the world. <strong>The</strong> allowances, therefore, provide no incentive to locateR&D investments in the UK. Strikingly, in discussions with the OFT, some scheme membersseemed to believe that R&D allowances were only available for R&D undertaken in the UK.<strong>The</strong>se tended, however, to be large firms for whom R&D investment in the UK alone45
<strong>The</strong> <strong>Pharmaceutical</strong> <strong>Price</strong> <strong>Regulation</strong> <strong>Scheme</strong>exceeded their maximum R&D allowance under the scheme. Firms that were reliant on R&Dundertaken outside the UK to claim their allowance were more aware <strong>of</strong> the rules.3.37 Other stakeholders suggested to us that the calculation <strong>of</strong> allowed rates <strong>of</strong> return and thedetermination <strong>of</strong> the capital base under PPRS give an incentive to invest in the UK rather thanelsewhere. While the analysis here is more complex (Annexe E provides details) ourconclusion again is that there are no systematic incentives within the scheme to locateinvestments within the UK, largely because <strong>of</strong> the advantages companies secure fromtransfer pricing under the scheme.3.38 If anything, PPRS rules are more favourable to companies importing from their affiliates abroadsince they are unconstrained by the pr<strong>of</strong>it ceiling if, as most do, they base transfer prices onthe resale-minus methodology. If there were a material possibility <strong>of</strong> UK companies beingconstrained by the pr<strong>of</strong>it ceiling, the rules might even deter investment in the UK. In practice,we do not believe UK investment has been deterred since the PPRS pr<strong>of</strong>it constraint oncompanies has been minimal in recent years, as discussed in the following Chapter.Legal constraints3.39 We have noted that the current scheme does not provide explicit incentives to invest in theUK. <strong>The</strong>re are, in addition, strong arguments to suggest that the scheme could not beamended to provide any such incentives in the future, as this would be contrary to EC ruleson the free movement <strong>of</strong> goods and State Aid rules (Articles 28 and 87 <strong>of</strong> the EC Treaty).3.40 In a number <strong>of</strong> cases, Member States’ pharmaceutical price regulation measures were heldto breach Article 28 (with no justification under Article 30) on the basis that they favoureddomestic supplies over imported products. For example, in the late 1980s 29 Italy adopted amethod <strong>of</strong> fixing prices for pharmaceutical products which expressly provided that:• the development <strong>of</strong> the national industry and research on the national territory should bepromoted, and• the cost components related thereto may be taken into account to a greater extent thanthe corresponding cost components for imported products.3.41 Under these terms the supplementary costs and charges inherent in importation were notmentioned among the factors to be taken into consideration in the fixing <strong>of</strong> prices <strong>of</strong>imported products. <strong>The</strong> ECJ held that this constituted a measure having an effect equivalentto quantitative restrictions on imports within the meaning <strong>of</strong> Article 28. This and otherrelevant cases are discussed in Annexe D.Drivers <strong>of</strong> location <strong>of</strong> R&D investment3.42 We met a number <strong>of</strong> companies in a variety <strong>of</strong> countries to discuss the sorts <strong>of</strong> factors thatdrive the location <strong>of</strong> pharmaceutical investments. Factors that we found to have the mostimportant effect on the location <strong>of</strong> R&D investment include:• a highly skilled workforce with relevant scientific qualifications• the presence <strong>of</strong> opinion leaders in the medical field• access to high quality clinical trials infrastructure• existing R&D activity, including public sector R&D, and• historical and cultural factors.29 Commission v Italy (Case 56/87, [1988] ECR 2919).46
February 20073.43 Financial factors, such as labour costs, taxation rates and tax credits, also have an impactbut are generally held by industry to be <strong>of</strong> secondary importance to the ‘quality’ <strong>of</strong> theinvestment environment (that is, to be determinative only when countries are equallyattractive on quality grounds).3.44 <strong>The</strong> UK performs particularly well against many factors relating to the quality <strong>of</strong> theinvestment environment, enjoying large numbers <strong>of</strong> highly qualified scientists and, perhapsmost importantly, highly regarded experts in the medical or pharmaceutical fields – or ‘opinionleaders’ – who are key to encouraging companies to conduct clinical trials in the UK. Throughspillover effects, public expenditure on R&D can also help attract private investment. Hereagain, the UK performs impressively: the proportion <strong>of</strong> GDP spent on public health R&D inthe UK is the second highest in the world (after the US). <strong>The</strong> recent Cooksey Review 30 hasmade recommendations for how a new single fund for health research – worth an estimated£1bn – might be operated in the future.3.45 <strong>The</strong>se and other factors discussed in Annexe E help explain the UK’s success to date inattracting private sector R&D expenditure. Some companies also suggested to us that‘market conditions’ were important in determining where investments will take place.However, it is not clear to us how there can be an explicit link. By definition, the revenuescompanies receive from the sales <strong>of</strong> products in a particular market are not a driver <strong>of</strong>internationally mobile investments – only <strong>of</strong> market specific expenditure such as marketing –since companies are not required to invest in a particular country to receive revenues fromselling a particular product. 313.46 In response, it has been suggested to us that there is an indirect link between price and thelocation <strong>of</strong> investment, since companies will use the threat <strong>of</strong> withdrawing investments as ameans <strong>of</strong> persuading governments to maintain high prices. It is rational for companies tomake such threats in an attempt to make features <strong>of</strong> the policy environment – such as pricingand reimbursement decisions – more favourable. It is not clear, however, that these threatsare always credible, particularly if the country in question performs strongly in relation to thedrivers identified above. We could find no clear relationship between price level and successin attracting R&D investment.3.47 Overall, our findings are consistent with the high level conclusions <strong>of</strong> a forthcoming reportjointly commissioned by UKTI and ABPI under the auspices <strong>of</strong> the Ministerial IndustryStrategy Group (MISG) 32 which reported:“In general, we did not find credible economic mechanisms to suggest that productmarket characteristics were <strong>of</strong> over-riding importance when making investment decisions.Firms should locate research and manufacturing in the best and most cost-efficientlocations, then market their products globally.3.48 <strong>The</strong> NERA report went on to say,“However, we found that firms <strong>of</strong>ten have a number <strong>of</strong> alternative locations for investmentassets that are broadly equal in other dimensions, and in these situations marketconditions can be an influence on the ultimate choice.”We are not convinced <strong>of</strong> this argument but consider its implications at the end <strong>of</strong> this chapter.30 A Review <strong>of</strong> UK Health Research Funding (2006), Sir David Cooksey December 2006.31 <strong>The</strong>re is one component <strong>of</strong> R&D for which it could be argued that decisions over where to locate are related in part tomarket conditions. <strong>The</strong> location <strong>of</strong> clinical trials may in part be driven by a desire to market a product to clinicians in aparticular country so as to improve subsequent uptake.32 NERA (Forthcoming 2007), ‘Key Factors in Attracting Internationally Mobile Investments by the Research-Based<strong>Pharmaceutical</strong> Industry’, a report commissioned by UKTI and ABPI and presented to the MISG. Henceforth referred to as‘the NERA report’.47
<strong>The</strong> <strong>Pharmaceutical</strong> <strong>Price</strong> <strong>Regulation</strong> <strong>Scheme</strong>Conclusion on UK prices and investment incentives3.49 We find that there is very little evidence to link the price <strong>of</strong> pharmaceuticals in the UK with theoverall attractiveness <strong>of</strong> the UK as a location for pharmaceutical R&D investment. This doesnot mean that overall pharmaceutical prices should be pushed down as low as possible. R&Dinvestment in valuable drugs should be appropriately rewarded to provide the right incentivesfor companies to continue investing in useful products in the future. <strong>The</strong> PPRS is in a strongposition to do this, since so many countries reference their prices to those in the UK.3.50 We would argue that the scheme should be designed to improve the incentives it gives forproductive investment. This is discussed in Chapter 5. We are also clear that any futurereform <strong>of</strong> the PPRS must retain the current policy <strong>of</strong> not discriminating between firms on thebasis <strong>of</strong> the location <strong>of</strong> their investments. Indeed, this policy should perhaps be made moreexplicit as several companies and public bodies we spoke to on our international case studiesseemed to think that the scheme is currently used – explicitly or implicitly – to favour UKbasedfirms. Such perceptions are unhelpful: for companies they risk undermining stabilityand transparency; and internationally, they may help to legitimise potential discriminatorybehaviour by other players in the future.3.51 We note that moves towards clarifying these issues would be consonant with the HealthSelect Committee’s recommendations to remove industry sponsorship objectives from theDepartment <strong>of</strong> Health’s pharmaceutical regulatory and policy functions.3.52 <strong>The</strong> most effective means available to Government for attracting investment into the UK is toinvest in the explicit factors identified above that have a direct effect on the attractiveness <strong>of</strong>the UK as a location for investment, such as investing in the scientific skill base or improvingthe environment for clinical trials. Examples <strong>of</strong> initiatives that do this, such as the creation <strong>of</strong>the UK Clinical Research Collaboration, are to be welcomed.International comparison <strong>of</strong> drug prices3.53 This section provides a brief assessment <strong>of</strong> how the prices <strong>of</strong> branded pharmaceuticals in theUK compare with those in other countries. As discussed below, there are manymethodological challenges to be faced in constructing international comparisons. Further,even if these can be addressed it is not always clear what policy conclusions can be drawnfrom such comparisons, since so many different factors drive outcomes. Comparisonstherefore need to be embedded in a detailed understanding <strong>of</strong> the policy and marketenvironment in the countries to which they refer. We would advise against drawing simplisticinferences from the data alone in the absence <strong>of</strong> such understanding.3.54 Nevertheless, political interest tends inevitably to focus on international comparisons,particularly <strong>of</strong> drug prices. <strong>The</strong> analysis here therefore presents an overview <strong>of</strong> estimates thathave been carried out and comments where appropriate on problems in interpreting the dataand adjustments that, in our view, should be carried out.Methodological issues3.55 Conducting international price comparisons requires a number <strong>of</strong> different issues to beaddressed, regarding, for example, the types <strong>of</strong> drugs and numbers <strong>of</strong> countries covered andthe use <strong>of</strong> exchange rates. Some <strong>of</strong> these issues are summarised in the table opposite.48
February 2007Table 3.2: Factors which can affect international price comparisonsDecisions about what prices should be comparedComparator countries <strong>Price</strong> comparisons will clearly be affected by whether high-price orlow-price countries are chosen as comparatorsType <strong>of</strong> drugs covered Comparisons could be made for branded drugs, generic drugs, or theoverall drug basket<strong>Price</strong>s at different points Alternative levels <strong>of</strong> price include:in the supply chain • ex-manufacturer price• wholesale price (i.e. the price paid by pharmacies purchasing fromwholesalers), and• the ‘public price’ (i.e. the cost to the public purse) net or gross <strong>of</strong> tax.Point in timeAs pricing regimes and exchange rates change through time, thepoint in time at which comparisons are made can affect results<strong>The</strong> price data used to make the comparisonSampleIssues include how big a sample from the relevant population <strong>of</strong>drugs should be used, and how this sample should be selectedAdjustments forData may need to be adjusted to take account <strong>of</strong> discounts or rebatesdiscounts/rebates which buyers may obtain on published pricesSectoral coverage <strong>The</strong> availability <strong>of</strong> data may differ between the hospital and theprimary care sector<strong>The</strong> methodology used to make the comparisonBilateral versusBilateral comparisons are made for two countries at a time based onmultilateraldrugs available in both countries; multilateral comparisons are basedonly on drugs which are available in all comparator countriesMatching criteriaMatches between products in different countries can be made either onthe basis <strong>of</strong> either exactly the same presentation or on the basis <strong>of</strong> thesame molecule.If the latter approach is adopted, a common unit <strong>of</strong> comparison isneeded to calculate a weighted average price for each molecule in anygiven country. This could be done on the basis <strong>of</strong> IMS standard units(one tablet, fixed quantity <strong>of</strong> creams etc.) or on the basis <strong>of</strong> mg <strong>of</strong> theactive ingredient.<strong>The</strong> parameters used in constructing overall price indexesVolume weights<strong>Price</strong> comparisons will vary depending on which countries’ volumes areused as weights. Danzon (2000) 33 demonstrates that each country willappear cheaper when its own volumes are used as weights, reflectinghigher usage <strong>of</strong> lower priced drugsExchange ratesAlternatives which can be used include:• market exchange rates, either at a given point in time or averagedover a suitable period, and• estimates <strong>of</strong> Purchasing Power Parity (PPP) or Equilibrium ExchangeRates (EER).33 Danzon, P., Chao, L. (2000), “Cross-national price differences for pharmaceuticals: how large, and why?”. Journal <strong>of</strong>Health Economics 19, 159-195.49
<strong>The</strong> <strong>Pharmaceutical</strong> <strong>Price</strong> <strong>Regulation</strong> <strong>Scheme</strong>3.56 Annexe E contains a more detailed assessment <strong>of</strong> the issues. In the next section weconsider price comparisons that have been conducted by DH aiming to establish whether UKbranded prices are relatively high or low in relation to those prevailing in a selection <strong>of</strong>comparator countries.DH comparisons3.57 <strong>The</strong> Department <strong>of</strong> Health undertakes its own international price comparisons on an annualbasis and results are regularly presented in its reports to parliament. <strong>The</strong> most recentlypublished is the ‘<strong>Pharmaceutical</strong> <strong>Price</strong> <strong>Regulation</strong> <strong>Scheme</strong>: Ninth Report to Parliament: July2006’. <strong>The</strong> results compare branded medicines in the UK with a range <strong>of</strong> European countriesand the USA. To quote the DH report about the annual comparison exercise:“It compares the prices <strong>of</strong> all preparations for the top 150 branded medicines in the UKwith other countries, depending on the availability <strong>of</strong> matching preparations elsewhere”. 343.58 In broad terms, we believe DH methodology for comparing prices is a sensible and pragmaticapproach to the problem. It generally avoids reliance on the more speculative and hencepotentially contentious methodologies, relying, for example, on historical exchange ratesrather than projected equilibrium exchange rates and only on exact presentation matchesrather than some form <strong>of</strong> weighted average per molecule. This can be at the expense <strong>of</strong>generalisability so, as always, care should be taken not to draw broader conclusions than theresults warrant. One area future comparisons might, in our view, usefully explore furtherwould be the use <strong>of</strong> rebate systems in a number <strong>of</strong> countries. As discussed below, this canhave an important effect on the results.3.59 <strong>The</strong> table below presents the following bilateral comparisons <strong>of</strong> ex-manufacturer prices,reproduced with DH permission. Results for 2005 are not yet published by DH and have beenprovided directly to OFT by DH. <strong>The</strong>y remain provisional at this time.Table 3.3: Bilateral comparisons <strong>of</strong> ex-manufacturer pricesCountry 1999 2000 2001 2002 2003 2004 2005France 84 80 81 81 91 84 96Germany 97 91 94 95 102 106 108Italy 83 79 82 86 90 78 84Netherlands n/a 81 84 88 93 92 95Spain 67 64 67 75 81 80 84USA 184 209 217 201 190 176 198Austria 83 77 81 83 94 94 96Belgium 84 78 81 86 91 90 95Finland 85 83 84 88 98 96 101Ireland 88 83 88 93 n/a 99 103UK 100 100 100 100 100 100 100Source: DH, 9th Report to Parliament and unpublished data from DH.34 In relation to the results for various bilateral comparisons the market coverage for the 2003 analysis is reported torange between 29 per cent and 39 per cent <strong>of</strong> expenditure in England on branded medicines, with a median coverage <strong>of</strong>34 per cent.50
February 20073.60 <strong>The</strong> position <strong>of</strong> the EU countries alone is shown in the graph below.Figure 3.6: Bilateral comparisons <strong>of</strong> ex-manufacturer prices in EU countries11010510095908580757065AustriaBelgiumFranceFinlandGermanyIrelandItalyNetherlandsSpainUK601999 2000 2001 2002 2003 2004 2005Source: DH, 9th Report to Parliament and unpublished data from DH.3.61 Table 3.3 shows that prices in the US have consistently been much higher than those in anyother country. Before 2005, UK prices were consistently higher than those in all Europeancountries with the exception <strong>of</strong> Germany, in some cases appreciably so. In 2005, theimposition <strong>of</strong> the seven per cent price cut led to a realignment, with UK prices now thefourth highest among the ten European countries assessed, behind Germany, Finland andIreland. As noted in Chapter 4, we would expect the effect <strong>of</strong> the price cut to be strongest inthe year in which it is introduced. <strong>The</strong>refore it is not clear whether this is a temporary ormore systematic realignment <strong>of</strong> prices.3.62 However, it is important to note that the results shown in the table do not take account <strong>of</strong>rebates paid by manufacturers in some countries as part <strong>of</strong> cost containment policies. Thismeans that prices in countries where rebates are imposed will be overstated.3.63 As a result <strong>of</strong> our contact with payers in the countries concerned (see Annexe K) we foundevidence that several countries apply ex post rebates. Some countries impose rebates fordifferent drugs categories paid by public bodies; others enter into price-volume agreementswith manufacturers that are effectively ex post rebates for the public payer. <strong>The</strong>se rebateslead to buyers paying less than the price data alone would suggest.3.64 Rebates are significant in three <strong>of</strong> the four countries that are shown as more expensive thanthe UK in the above table. We found, for example, that rebates are between two and sevenper cent <strong>of</strong> total expenditure on drugs in Germany, three and a half per cent in Ireland, aboutthree per cent in France and up to 30 per cent <strong>of</strong>f list prices for the United States. Othercountries known to use rebate schemes are Austria and Australia. <strong>The</strong> existence <strong>of</strong> furtherarrangements in other countries cannot be discounted.51
<strong>The</strong> <strong>Pharmaceutical</strong> <strong>Price</strong> <strong>Regulation</strong> <strong>Scheme</strong>3.65 A very recent (and unpublished) study by Panos Kanavos et al. 35 investigates pharmaceuticalrebates in the United States and comes to the conclusion that ‘US public prices arecomparable to and in many cases, lower than, prices in a number <strong>of</strong> European countries’.<strong>The</strong> results <strong>of</strong> the study show that there is a large discrepancy in the United States betweenlist prices and the prices that are actually reimbursed by health insurance organisations. Incertain drug classes rebates seem to range between 32 per cent and 47 per cent, in otherdrug classes between 13 and 23 per cent (<strong>of</strong> list price). Across all therapeutic categories thestudy finds an average discount <strong>of</strong> 32 per cent, reaching 39 per cent if weighted by volumes.<strong>The</strong> study also shows that reimbursement prices in the United States (public prices) may bein the same range as Germany and the UK. A price index comparison even finds that pricesin the United States are lower than in Germany and just higher than that <strong>of</strong> the UK (pleaserefer to Annexe F for more details).3.66 For the UK, in contrast, the ex-manufacturer prices shown in the table – calculated at listprice minus 12.5 per cent – seem a broadly fair reflection <strong>of</strong> ex-manufacturer prices inpractice, as discussed in Chapter 2. Were the pr<strong>of</strong>it cap leads to significant levels <strong>of</strong>repayment, a similar need for adjustment would arise. However, as discussed in the nextChapter, this is not the case.3.67 Taking into account rebates, prices paid at ex-manufacturer level are likely to be broadlycomparable with those in Ireland and much closer to those in Germany than is apparent fromthe table.3.68 We have also explored, on an indicative basis, the possible effects <strong>of</strong> volume weightings onthe overall results. <strong>The</strong> assessment provides some support for the view that the UK appearsless expensive in the table than it would if the volume weights <strong>of</strong> the comparator countrywere used.Conclusion3.69 In conclusion, we have shown that UK prices have an important influence on incentives toinvest in drugs. We believe that a UK pricing scheme should aim to exercise this influence byencouraging companies to invest in drugs that will have the greatest clinical benefit forpatients.3.70 We strongly disagree with any suggestion that a UK pricing regime should be used to favourcompanies that undertake investments in the UK. Not only would such a policy be contrary toEC legislation, it would also not be an efficient use <strong>of</strong> Government resources. Otherinstruments available to Government, by targeting the attractiveness <strong>of</strong> the investmentenvironment directly, are likely to be much more effective in attracting investment into the UK.3.71 It is important to reiterate, however, that the focus <strong>of</strong> this study is not on whether theaggregate level <strong>of</strong> prices or overall amount spent on drugs in the UK is too high. That is amatter for Government to consider, taking into account broader policy considerations such asthe desire to make a fair contribution to the global costs <strong>of</strong> R&D. Our argument, assuggested in Chapter 2 and explored further in Chapter 4, is very different. We wouldquestion whether current pricing arrangements ensure that the best use is made <strong>of</strong> current35 Panos Kanavos, Joan Cost-Font and Bengt Jönsson, ‘Explaining Cross-County Drug <strong>Price</strong> Differences: What is the value<strong>of</strong> innovation, forthcoming;52
February 2007expenditure on drugs. An alternative value-based approach <strong>of</strong>fers the prospect <strong>of</strong> deliveringgreater benefits to patients for the same level <strong>of</strong> expenditure, thereby improving value formoney and giving better rewards to companies to invest in the most valuable drugs.3.72 Such reform would create winners and losers. <strong>The</strong>refore – although we are not convinced <strong>of</strong>the argument – if there is a loose link between market conditions and incentives to invest inthe UK, reform in the direction <strong>of</strong> value-based pricing should attract investment by innovativecompanies, who would prosper under new arrangements, just as much as it would reducethe attraction <strong>of</strong> the UK for those companies who would not.53
<strong>The</strong> <strong>Pharmaceutical</strong> <strong>Price</strong> <strong>Regulation</strong> <strong>Scheme</strong>4 EVALUATION OF CURRENT PRICING AND REIMBURSEMENTARRANGEMENTSIntroduction4.1 <strong>The</strong> previous two Chapters set out the role <strong>of</strong> the PPRS in terms <strong>of</strong> delivering value formoney and providing companies with the right incentives to invest in drugs. This Chapteraims to assess to what extent the PPRS meets these objectives in practice.4.2 We first present a high-level assessment <strong>of</strong> PPRS pr<strong>of</strong>it and price controls, in each casesummarising the main provisions and assessing their effects. We then develop some generalconclusions about the scheme as a whole, the most important <strong>of</strong> which in our view relates tothe fact that there are no mechanisms within it to help ensure prices reflect the value <strong>of</strong>drugs produced by companies. Since they are clearly relevant to any assessment <strong>of</strong>mechanisms for ensuring prices are value-reflective, we also refer to analysis we haveconducted into NICE, SMC and AWMSG.4.3 Before assessing the individual controls, we should make some comments about theadministration <strong>of</strong> the scheme. <strong>The</strong> PPRS is light on direct public administration costs.<strong>The</strong> PPRS team at DH is highly competent and pr<strong>of</strong>essional, and operates a very complexscheme with minimal resources. A team <strong>of</strong> around ten people operate the entire schemeand are also involved in other key aspects <strong>of</strong> pharmaceuticals policy such as the negotiation<strong>of</strong> the Pharmacy contract. 36Pr<strong>of</strong>it controls4.4 <strong>The</strong> PPRS pr<strong>of</strong>it controls are generally considered to be the defining feature <strong>of</strong> the scheme.However, few stakeholders have a detailed understanding <strong>of</strong> how they work or what theireffects are likely to be in practice. In discussions, we encountered a variety <strong>of</strong> views about theregulation <strong>of</strong> pr<strong>of</strong>itability under the scheme that were not borne out in practice.4.5 <strong>The</strong> purpose <strong>of</strong> this section is to shed some light on these issues. It first provides a briefdescription <strong>of</strong> the controls and then considers the difficulties <strong>of</strong> pr<strong>of</strong>it regulation in thepharmaceutical sector. <strong>The</strong> section continues with a brief analysis <strong>of</strong> the incentive properties<strong>of</strong> PPRS controls and the extent to which the controls are binding in practice. Finally,conclusions are drawn. As noted, the details <strong>of</strong> the controls are complex and can only betouched on here. A more in-depth assessment is given in Annexe H.Description <strong>of</strong> main provisions4.6 <strong>The</strong> PPRS pr<strong>of</strong>it control sets a maximum level for the pr<strong>of</strong>its that PPRS member companiesmay earn from supplying branded drugs to the NHS. <strong>The</strong> PPRS pr<strong>of</strong>it control also sets alower threshold for pr<strong>of</strong>its, such that if pr<strong>of</strong>its fall below this lower threshold, companies mayincrease prices. 3736 In comparison, OFWAT, the regulator <strong>of</strong> the water and sewerage sector (which has an annual turnover <strong>of</strong> roughly £7billion – somewhat less than the branded drugs bill) employs just under 200 full-time staff.37 In this Chapter, we describe this lower threshold as a pr<strong>of</strong>it minimum, although it should be noted that this is not anabsolute minimum for pr<strong>of</strong>its since any increase in pr<strong>of</strong>itability for a company that falls below the threshold is, <strong>of</strong> course,contingent on sales being generated in practice.54
February 20074.7 <strong>The</strong> maximum and minimum level <strong>of</strong> pr<strong>of</strong>its are based on a target rate <strong>of</strong> return, which is thehigher <strong>of</strong> 21 per cent return on capital employed (ROC) and six per cent return on sales to theNHS (ROS). 384.8 Each company’s maximum pr<strong>of</strong>it is set at 140 per cent <strong>of</strong> target (target plus a margin <strong>of</strong>tolerance (MOT) <strong>of</strong> 40 per cent): the higher <strong>of</strong> 29.4 per cent <strong>of</strong> capital or 8.4 per cent <strong>of</strong>sales. Each company’s minimum pr<strong>of</strong>it is set at 40 per cent <strong>of</strong> target (target less a MOT <strong>of</strong>60 per cent): the higher <strong>of</strong> 8.4 per cent <strong>of</strong> capital or 2.4 per cent <strong>of</strong> sales.4.9 DH assesses each company’s pr<strong>of</strong>its in each year. <strong>The</strong> rules governing the assessment arecomplex. <strong>The</strong> most significant aspects are that:• the sales that are taken into account are sales <strong>of</strong> the domestic manufacturer (thusexcluding parallel imports) to the NHS (as discussed in Chapter 2, these include sales towholesalers, pharmacies and hospitals)• UK revenue, costs and capital are allocated between the NHS and other customers• costs and capital may be increased by ‘injection’ <strong>of</strong> R&D from elsewhere in the companyand may be based on the transfer prices used in companies’ corporation tax returns• research and development (R&D), marketing and information costs are subject tomaximum allowances, and• DH is entitled to satisfy itself that costs are properly incurred and are reasonable in thelight <strong>of</strong> accepted commercial practice. If companies disagree with DH’s assessment,they may appeal to an arbitration panel, but no appeal on matters related to the pr<strong>of</strong>itcontrol has yet been made.4.10 If a company’s pr<strong>of</strong>its exceed the maximum, DH negotiates a repayment or price reductions.If DH is satisfied that a company’s pr<strong>of</strong>its are falling below the minimum, it agrees a priceincrease up to 65 per cent <strong>of</strong> the pr<strong>of</strong>it target.4.11 Only companies with branded sales in excess <strong>of</strong> £25m per year are required to submitregular financial returns. 39 Companies with branded sales <strong>of</strong> less than £25m are, in effect,outside the maximum pr<strong>of</strong>it control but must submit financial returns if they apply for priceincreases on grounds <strong>of</strong> insufficient pr<strong>of</strong>itability.Difficulties with regulating and measuring pr<strong>of</strong>its in thepharmaceutical sector4.12 Regulating pr<strong>of</strong>its in any sector can create a number <strong>of</strong> fundamental incentive problems:• directly controlling pr<strong>of</strong>its undermines companies’ incentive to control costs. Costincreases may result in a company’s pr<strong>of</strong>its falling below target and hence potentiallytrigger higher prices, while cost reductions similarly may result in its pr<strong>of</strong>its increasingabove target and trigger lower prices. Consequently, the financial effects <strong>of</strong> higher orlower costs fall on customers through price changes rather than on shareholders,reducing the incentive for companies to control costs38 Specifically, firms are assessed on a ROS basis if their ratio <strong>of</strong> sales to total capital employed exceeds 3.5.39 Companies with sales <strong>of</strong> between £1m and £25m must submit audited accounts, and DH has the right to call for fullfinancial returns if circumstances warrant it.55
<strong>The</strong> <strong>Pharmaceutical</strong> <strong>Price</strong> <strong>Regulation</strong> <strong>Scheme</strong>• directly controlling pr<strong>of</strong>its rewards inputs (investment) rather than the relevant outputs (inthe context <strong>of</strong> the pharmaceutical sector, drugs that benefit patients). A pure pr<strong>of</strong>itcontrol remunerates all capital invested and makes no distinction between successfuland unsuccessful investment, and• a pr<strong>of</strong>it control also tends to distort investment decisions. If there is a single rate <strong>of</strong>return on invested capital which is above the cost <strong>of</strong> capital, companies have anincentive to over-invest in low-risk projects.4.13 <strong>The</strong>se incentive and information-related problems are particularly acute in the pharmaceuticalsector. <strong>The</strong> sector is characterised by a high degree <strong>of</strong> innovation – new drugs are continuallybeing produced which differ in important respects from existing products. Crucially, there islittle systematic link between the costs and outputs <strong>of</strong> innovative activity in thepharmaceutical sector – through skill and ingenuity different firms will enjoy very differentlevels <strong>of</strong> success in producing useful drugs from a given level <strong>of</strong> expenditure on R&D. Thisraises a fundamental question about the desirability <strong>of</strong> seeking to regulate the pr<strong>of</strong>its <strong>of</strong>pharmaceutical companies.4.14 <strong>The</strong> high rate <strong>of</strong> innovation also makes it particularly difficult to control pr<strong>of</strong>its, for example bybenchmarking costs between pharmaceutical companies, because the outputs produced byeach company are so different. <strong>The</strong>refore a ‘reasonable’ or efficient level <strong>of</strong> costs isextremely difficult to determine for any individual firm.4.15 Assessing pr<strong>of</strong>its in the pharmaceuticals sector also involves a number <strong>of</strong> specificmeasurement difficulties which are not experienced to the same extent in other sectors.• pharmaceuticals R&D expenditure is particularly high. R&D has the economiccharacteristics <strong>of</strong> investment but is not treated as capital in some accounting treatments,including the PPRS• the difficulty <strong>of</strong> calculating economic pr<strong>of</strong>itability is compounded by the relativelyhigh proportion <strong>of</strong> pharmaceuticals R&D that is unsuccessful and by the relatively longtime lags between R&D expenditure being incurred and the associated revenue beingearned, and• as noted in the last chapter, a high proportion <strong>of</strong> the costs incurred in developing andproducing a drug (notably R&D and manufacturing costs) are ‘international’ in the sensethat expenditure can take place anywhere in the world. This makes it difficult to verify thecosts associated with supply to any one country. Additionally, R&D is a ‘globally common’cost, which means that attribution <strong>of</strong> costs to the UK is particularly problematic.Assessment <strong>of</strong> PPRS pr<strong>of</strong>it controls4.16 Against this challenging background, this section assesses the approach to regulatingpr<strong>of</strong>itability under PPRS.4.17 <strong>The</strong> focus in this section is on the incentive effects arising out <strong>of</strong> the scheme’s rules, whilethe next section considers to what extent the scheme has had a material effect on firms’behaviour in practice.56
February 2007Weak incentives to invest in valuable drugs4.18 Neither the R&D allowance nor the pr<strong>of</strong>it target take account <strong>of</strong> the characteristics <strong>of</strong> acompany’s drugs portfolio. In particular, they are not linked to the benefit to patients <strong>of</strong> thecompany’s drugs. <strong>The</strong> R&D allowance and the pr<strong>of</strong>it target are calculated on total sales orcapital and apply to <strong>of</strong>f-patent brands, including non-originator brands, which do notnecessarily require investment in R&D.4.19 <strong>The</strong> possibility <strong>of</strong> earning high (or low) pr<strong>of</strong>its provides a strong incentive to companies toproduce valuable drugs for patients. Imposing maximum and minimum allowed levels <strong>of</strong> pr<strong>of</strong>itsin a way that takes no account <strong>of</strong> the value <strong>of</strong> drugs produced by a firm dulls those incentives.Incentives to control costs4.20 An important feature <strong>of</strong> the scheme is that several significant cost components (R&D,marketing and information) in the control are based on allowances rather than actual costs.This, to some extent, addresses the first fundamental incentive problem <strong>of</strong> pr<strong>of</strong>it controlsidentified above (the lack <strong>of</strong> incentive to control costs). 404.21 However, the ROC target is more than double most companies’ cost <strong>of</strong> capital, creating anincentive to over-invest in PPRS capital, including buildings, plant and working capital (but notR&D expenditure).Differential effects4.22 Our analysis suggests that, in principle, various features <strong>of</strong> the pr<strong>of</strong>it controls are likely to applydifferentially to different types <strong>of</strong> firm, even if they have drugs with similar characteristics.4.23 For example, the R&D allowance favours large firms over small (other things equal, largerfirms have more products and hence a higher allowance). In particular, the R&D allowancegives a larger firm a greater reward for introducing a new drug (not only is its allowancehigher, but each new drug increases the allowance by 0.25 per cent <strong>of</strong> total sales 41 , which isworth more to a larger firm with a greater existing level <strong>of</strong> sales).4.24 <strong>The</strong> R&D allowance also appears to favour global companies over those with all their sales tothe NHS, since the latter can only claim their actual ratio <strong>of</strong> R&D to sales whereas globalcompanies can claim up to the R&D allowance which is in most cases higher (under the 2005PPRS, the R&D allowance is likely to average 22 per cent <strong>of</strong> sales 42 whereas global R&Dintensity is only around 15 to 18 per cent).4.25 Smaller companies tend to show greater variability <strong>of</strong> returns over time and hence are morelikely to exceed the annual pr<strong>of</strong>it cap than larger companies, even if long run pr<strong>of</strong>itability ratesare comparable.40 However, by the same token there is no means by which cost efficiencies made by companies can be translated intosavings for the NHS, even in the long run, because the level <strong>of</strong> allowances is not obviously related even to averagecompany costs.41 Unless the company already has 20 or more new active substances, when its R&D allowance is capped at 25 per cent(excluding any new paediatric drugs).42 We estimate the R&D allowance is likely to average 22 per cent for calculating the pr<strong>of</strong>it maximum, and 17.5 per cent forcalculating the pr<strong>of</strong>it minimum.57
<strong>The</strong> <strong>Pharmaceutical</strong> <strong>Price</strong> <strong>Regulation</strong> <strong>Scheme</strong>4.26 Companies with little PPRS capital are disadvantaged as the ROS target is too low relative tothe ROC target. ROS companies potentially suffer the disadvantage <strong>of</strong> not allowing fully forthe cost <strong>of</strong> investing in intangible capital, such as R&D, but do not receive the benefit <strong>of</strong> areturn above the cost <strong>of</strong> capital on PPRS capital.4.27 <strong>The</strong> transfer pricing provisions favour companies importing from affiliates abroad over thosemanufacturing in the UK, as discussed in greater detail below.4.28 In all, the sorts <strong>of</strong> companies potentially disadvantaged by these arrangements are smallerR&D intensive companies focused on the UK (and which are therefore unable to benefit fromR&D allowance in excess <strong>of</strong> global R&D intensity and from transfer pricing arrangements).4.29 We note that companies with sales to the NHS <strong>of</strong> less than £25 million are effectivelyoutside the maximum pr<strong>of</strong>it control and that, in recent renegotiations <strong>of</strong> the scheme, DH hastaken steps to reduce the bias against small companies. <strong>The</strong>se include increasing the R&Dallowance for firms in the first three years <strong>of</strong> submitting financial returns and increasing thefixed element <strong>of</strong> the marketing allowance. However, the potential disadvantages to smallfirms identified above remain.<strong>The</strong> PPRS pr<strong>of</strong>it control in practice4.30 Perhaps in recognition <strong>of</strong> some <strong>of</strong> the incentive problems discussed above, pr<strong>of</strong>it controlshave reduced in importance in recent years, with the price controls becoming the majorconstraint. Several factors have combined to reduce the impact <strong>of</strong> the pr<strong>of</strong>it maximum andminimum.4.31 First, there has been a wider margin <strong>of</strong> tolerance around the target pr<strong>of</strong>it, with maximumpr<strong>of</strong>its at 140 per cent and minimum pr<strong>of</strong>its at 40 per cent <strong>of</strong> target (as opposed to 75 percent and 125 per cent prior to 1999).4.32 <strong>The</strong>re has also been an increasing wedge between target rates <strong>of</strong> return under the schemeand members’ cost <strong>of</strong> capital (as discussed further in Annexe H).4.33 Where companies import from affiliates abroad, the PPRS pr<strong>of</strong>it control bases costs ontransfer prices used in corporation tax returns. Transfer prices are now very important (weestimate that transfer priced products account for at least 70 per cent <strong>of</strong> sales), but in mostcases are based on the resale-minus method. This creates an underlying circularity since thePPRS pr<strong>of</strong>it control seeks to base selling prices on transfer prices, but resale-minus transferprices are themselves based on selling prices. Under the resale-minus method, higher prices,for example on new drugs, lead to higher costs not higher pr<strong>of</strong>its. <strong>The</strong> implication, in regardto a large part <strong>of</strong> sales, is that the pr<strong>of</strong>it control cannot be binding.4.34 In recent years, the PPRS pr<strong>of</strong>it control has had very little, if any, effect in constrainingcompanies’ behaviour: repayments <strong>of</strong> excess pr<strong>of</strong>its have been negligible – representingabout 0.01% <strong>of</strong> revenues over the 1999 – 2004 scheme. <strong>Price</strong> increases agreed on grounds<strong>of</strong> insufficient pr<strong>of</strong>itability have also been negligible over the period.4.35 Figure 4.1 and 4.2 show the trends in pr<strong>of</strong>it against the pr<strong>of</strong>it maximum for both ROCE andROS firms from 1997 to 2004. Pr<strong>of</strong>its are shown relative to target so that pr<strong>of</strong>its underthe1993 scheme are more comparable with those under the 1999 scheme.58
February 2007Figure 4.1: DH assessed pr<strong>of</strong>its against pr<strong>of</strong>it maximum for ROC companies250%ROCE as percentage <strong>of</strong> target200%150%100%50%0%-50%-100%Pr<strong>of</strong>itmaximum-150%1997 1998 1999(1993scheme)1999(1999scheme)20002001 2002 2003 2004Sources: OFT based on AFRs.Figure 4.2: DH assessed pr<strong>of</strong>its against pr<strong>of</strong>it maximum for ROS companies3ROS as percentage <strong>of</strong> target2.521.510.5Pr<strong>of</strong>itmaximum01997 1998 1999(1993scheme)1999(1999scheme)20002001 2002 2003 2004Source: OFT calculations based on AFRs.4.36 Figures 4.1 and 4.2 show that, under the 1999 scheme, very few companies have exceededthe pr<strong>of</strong>it maximum (under the 1993 PPRS, with its narrower MOT, rather more companiesexceeded the pr<strong>of</strong>it maximum). A similar picture emerges for the pr<strong>of</strong>it minimum.59
<strong>The</strong> <strong>Pharmaceutical</strong> <strong>Price</strong> <strong>Regulation</strong> <strong>Scheme</strong>4.37 We do not consider the PPRS pr<strong>of</strong>it control is likely to become more <strong>of</strong> a binding constrainton companies’ behaviour during the course <strong>of</strong> the 2005 PPRS, since the relevant features <strong>of</strong>the 1999 PPRS remain in place.4.38 Although the PPRS pr<strong>of</strong>it control is not constraining the behaviour <strong>of</strong> most companies’behaviour, as noted some <strong>of</strong> its features, particularly the low target for ROS compared toROC companies, have the potential to deter entry and/or rapid expansion by smaller R&Dintensive companies focused on the UK (and which are therefore unable to benefit from R&Dallowance in excess <strong>of</strong> global R&D intensity and from transfer pricing arrangements).4.39 We did not identify companies above the £25 million limit for making financial returns thatwere currently disadvantaged in this way in practice. However, it was suggested to us by theBioIndustry Association that, as bioscience companies had started to market more productsthemselves (rather than in collaboration with larger companies), the role and impact <strong>of</strong> thePPRS was becoming much more important to smaller companies than was previously thecase. Consequently, we would expect these effects to become more significant in the future,as an increasing number <strong>of</strong> drugs in the pipeline are produced by companies with thecharacteristics set out above.Conclusions on pr<strong>of</strong>it control4.40 In our view, a pr<strong>of</strong>it cap is in principle ill-suited to an innovative sector such aspharmaceuticals, primarily because it provides weak incentives to invest in the mostinnovative drugs. Further, there are major practical difficulties in assessing pr<strong>of</strong>its in thesector, due largely to the increasingly global nature <strong>of</strong> pharmaceutical costs and thesignificant levels <strong>of</strong> intangible R&D investment made by pharmaceutical companies. Inpractice, the pr<strong>of</strong>it control is not constraining the behaviour <strong>of</strong> most companies. It has thepotential to deter entry and/or rapid expansion by smaller R&D intensive companies focusedon the UK; while we do not have evidence that this is happening at present, it may become amore significant issue in the future.4.41 In Chapter 5, we set out potential options for reform to address these concerns.<strong>Price</strong> controls4.42 Under the PPRS, companies have freedom <strong>of</strong> pricing for New Active Substances (NAS). 43For companies, this is one <strong>of</strong> the most positive aspects <strong>of</strong> the scheme, as it allows them toaccess the UK market without protracted negotiations over pricing and reimbursement. Wenote, however, that there are potential disadvantages for companies and the NHS in a drugreceiving no assessment at launch – notably the problems such an approach may create forensuring rapid, cost effective uptake <strong>of</strong> medicines. This is discussed further in Chapter 5.43 <strong>The</strong> company must agree the price <strong>of</strong> other new products – including combination products containing active substancesthat have been marketed separately, active substances with new indications and variations in formulation, presentation orpack size etc. – with DH. In considering prices <strong>of</strong> such products, DH takes into account factors such as the price <strong>of</strong> otherpresentations <strong>of</strong> the same medicine or comparable products.60
February 20074.43 PPRS price controls limit the price <strong>of</strong> medicines already on the market and have three mainfeatures:• a series <strong>of</strong> agreed overall price reductions have accompanied the introduction <strong>of</strong> each <strong>of</strong>the last three PPRS agreements. Recent price cuts have been 2.5 per cent in October1993, 4.5 per cent in October 1999 and most recently seven per cent in January 2005• at other times, PPRS companies are not permitted to increase the overall level <strong>of</strong> theirprices, and• the price control applies at a company level. Companies are able to vary prices <strong>of</strong>individual medicines within their overall limit. Under the PPRS this is known asmodulation.4.44 This section assesses the effect <strong>of</strong> these price controls, which have had a much moresignificant effect on companies in the recent history <strong>of</strong> the scheme than the pr<strong>of</strong>it controls.It first reviews the effect <strong>of</strong> the price cuts on NHS expenditure, then examines the efficiencyproperties and incentive effects <strong>of</strong> the cuts and finally assesses to what extent pricemodulation affects competition in drugs markets in the NHS. <strong>The</strong>se issues are explored ingreater detail in Annexe J.Effect <strong>of</strong> price cuts on NHS expenditure4.45 <strong>The</strong> PPRS price control, rather than the pr<strong>of</strong>it control, is currently the major instrument forcontrolling prices as all major companies have reduced prices under the price control butmost are not constrained by the pr<strong>of</strong>it control.4.46 <strong>The</strong>re is little doubt that PPRS price cuts reduce primary care drug expenditure below the levelit would otherwise be. Comparing expenditure in England for 2005 with that for 2004 showssavings in primary care (at 2005 volumes) <strong>of</strong> just over seven per cent from the new PPRSagreement. This reflects the reduction in reimbursement prices on both direct supplies andparallel imports, and represents savings <strong>of</strong> about £370 million 44 for England or £450 million forthe UK (assuming a similar level <strong>of</strong> savings in Scotland, Wales and Northern Ireland). Savingswill, however, reduce over time as companies introduce new drugs at uncontrolled prices.<strong>The</strong> extent <strong>of</strong> savings in the hospital sector is uncertain as the price control constrains listprices but hospitals usually negotiate to purchase below list prices. Several trusts have givenus evidence showing the 2005 cut did not generate savings for them.Incentive effects and sustainability4.47 <strong>The</strong> level <strong>of</strong> price cuts is negotiated by DH and the ABPI and is not clearly linked to acomparison <strong>of</strong> UK prices with those in other EU countries or to other observable variables.Most importantly, it does not attempt to link prices to patient benefits, and therefore doesnot help to secure value-reflective prices. <strong>The</strong> one-<strong>of</strong>f price cuts are imposed across all <strong>of</strong> acompany’s products, irrespective <strong>of</strong> their therapeutic value. Given the freedom <strong>of</strong> pricing upfront afforded by the PPRS and the demand side problems in the NHS discussed in Chapter2, one supplier’s prices may be above average patient benefit while another’s may be below,but under the PPRS price control both have to reduce their average prices by the samepercentage.44 Table 6.1 in Annexe J shows savings for England <strong>of</strong> £410 million at list prices, but this reduces to about £370 million aftertaking into account that reimbursement prices are about 9.2 per cent below list prices due to clawback.61
<strong>The</strong> <strong>Pharmaceutical</strong> <strong>Price</strong> <strong>Regulation</strong> <strong>Scheme</strong>4.48 In the short run, this approach is not the best means, therefore, <strong>of</strong> helping the NHS securevalue for money (that is, maximise health gains for a given health budget). Given the globalimportance <strong>of</strong> UK prices, price cuts are also likely to have important dynamic effects, since thescheme does not provide a mechanism <strong>of</strong> rewarding companies that produce drugs with ahigh therapeutic benefit over those that do not. It therefore gives no clear incentives topharmaceutical companies to compete by investing in the most innovative and effective drugs.4.49 It is true that the periodic cuts at least reward companies for bringing out new products(since those launched more recently will have been subject to fewer (or no) price cuts).However, there is no necessary correlation between new products and products that areparticularly valuable to patients. As discussed in Annexe M, the fact that a drug receives aNew Active Substance marketing authorisation does not necessarily imply that it is morevaluable in therapeutic terms than existing products on the market. <strong>The</strong>refore this approachis at best a blunt and indirect method <strong>of</strong> rewarding valuable innovation.4.50 A further issue is that the price cuts, and in particular the prospect <strong>of</strong> future price cuts, mayaffect the price <strong>of</strong> new drugs. Companies set initial prices in the knowledge that there will bea price cut at the time <strong>of</strong> the renegotiation <strong>of</strong> the PPRS. While there may be other constraintson prices <strong>of</strong> new drugs, such as the prospect <strong>of</strong> NICE and SMC appraisals and paralleltrading, firms are likely to take future price cuts into account when setting initial prices.<strong>The</strong> more these price cuts become a regular feature <strong>of</strong> PPRS, the more firms are likely toanticipate them in setting initial prices (by pricing above what they would otherwise havecharged), particularly towards the end <strong>of</strong> a given PPRS period.4.51 Under such an approach, price setting could become a strategic game in which firms attemptto guess the level <strong>of</strong> forthcoming price cuts and DH attempts to double guess this effect insetting the level <strong>of</strong> price cuts. We might expect the outcome <strong>of</strong> this game to be everincreasingprice cuts, which is consistent with what we have seen in practice (with cuts <strong>of</strong>2.5 per cent, 4.5 per cent and seven per cent over the last three schemes). Continuing toseek to control prices through the simple mechanism <strong>of</strong> an unsystematic price cut (that is,one that is not obviously related to objective or verifiable criteria) does not, in our view,provide a sustainable model <strong>of</strong> pricing pharmaceuticals in the future.Effect <strong>of</strong> modulation on competition4.52 Companies make considerable use <strong>of</strong> modulation to vary the prices <strong>of</strong> individual drugs,especially at the time <strong>of</strong> overall price reductions. In January 2005, modulated productsaccounted for almost two thirds <strong>of</strong> total sales by value (around one third by products wherethe price was left unchanged, rather than cut by seven per cent, and around one third byproducts where the price was cut but not by seven per cent).4.53 Although not stated in the PPRS agreement, DH measures modulated price changes using acurrent-weighted price index with volume weights based on direct supplies in the UK. That is,modulation applies to list as opposed to transaction prices, and it applies to volumes sold bythe company in the UK rather than prescribed volumes (that is, it does not include paralleltrade). Furthermore, because the index used is a current-weighted index it provides strongincentives for companies to concentrate reductions on drugs for which volume directlysupplied is likely to increase in response to a reduction in the list price (that is, for whichdemand is price sensitive).4.54 Modulation therefore has varying effects on competition according to the nature <strong>of</strong> themarket. Accordingly, in considering the effects <strong>of</strong> modulation below, we draw on the analysis<strong>of</strong> Chapter 2, in distinguishing between effects on competition to secure a GP’s prescription,competition to supply pharmacies/wholesalers and competition to supply hospitals.62
February 2007Competition to secure a GP’s prescription4.55 Our survey <strong>of</strong> GPs suggests prescribers’ demand is relatively insensitive to price changes.Nevertheless, there may be circumstances where price does affect prescribing decisions andthere is consequently brand-on-brand competition or brand on generic competition. Twoorganisations, while supportive <strong>of</strong> the PPRS generally, expressed concern about the effects<strong>of</strong> modulation on smaller companies:• BIA (Biotechnology Industry Association) told us that, while it recognised the significantadvantages that price modulation allows for larger pharmaceutical companies, it alsorecognised that price modulation can have a negative impact on smaller biosciencecompanies that typically have one or two products in their portfolios. It would normallytake a smaller company many years to build up a portfolio where it could even begin toconsider the possibility <strong>of</strong> price modulation, and• EMIG (Ethical Medicines Industry Group) told us that, although it would not welcome thescrapping <strong>of</strong> modulation, it was concerned that price modulation has an effect on theR&D investment potential for many companies in the small pharmaceutical sector. EMIGsaid that small and emerging companies are not able to modulate in the same way aslarger pharmaceutical companies, and that this imbalance in price adjustment gives riseto insecure financial planning in the small pharmaceutical sector due to the ability <strong>of</strong>larger pharmaceutical companies to modulate across a wider range <strong>of</strong> products and<strong>of</strong>fset reductions accordingly. EMIG added that it could enable larger pharmaceuticalcompanies to inadvertently price smaller competitors out <strong>of</strong> the market.4.56 Competition between <strong>of</strong>f-patent brands has been suggested to us as an area in which theremight be greater than average sensitivity to price. Some new entrant brands have, for example,been able to compete with originator brands through <strong>of</strong>fering a price discount, and marketingtheir products to PCTs and GPs accordingly. It is perhaps unsurprising that price can be a moreimportant factor for competition between <strong>of</strong>f-patent brands, since the products contain thesame active substance, such that quality differences between them will be less significant thanfor therapeutic competition (that between brands with different active substances).4.57 <strong>Price</strong> may also be more relevant where GPs are not subject to strong countervailingmarketing from pharmaceutical companies. For example several PCTs have been successfulin persuading GPs to prescribe a branded generic instead <strong>of</strong> generic simvastatin, which – as itis produced generically – is not specifically marketed to GPs by any one company.4.58 In these circumstances, modulation creates the incentive for a multi-product company toincrease the price <strong>of</strong> products which are relatively price insensitive and reduce the price,possibly to below marginal cost, <strong>of</strong> products which are relatively price sensitive. This wouldbe to the advantage <strong>of</strong> companies with many products with differing price sensitivity, but isto the disadvantage <strong>of</strong> the NHS (which experiences higher cost), smaller branded suppliers(which find it more difficult to modulate because <strong>of</strong> their smaller product range) and genericsuppliers.4.59 Modulation may also increase the incentive to reduce prices <strong>of</strong> branded products ahead <strong>of</strong>patent expiry in order to discourage generic entry (because the price cuts can be funded byprice increases on other price insensitive drugs). 45 This is most likely for products with smallmarkets where entry is relatively costly for generic suppliers.45 It should be noted that price reductions cannot be included in modulation proposals where the patent/SPC has expiredwithin one year before, or will expire within two years after, the date <strong>of</strong> modulation (six months and one year respectivelyfor modulation at the time <strong>of</strong> a price cut such as 1 January 2005).63
<strong>The</strong> <strong>Pharmaceutical</strong> <strong>Price</strong> <strong>Regulation</strong> <strong>Scheme</strong>Competition to supply pharmacies: generic reimbursement4.60 Pharmacies and wholesalers have a strong incentive to purchase drugs from the cheapestavailable source. In some circumstances, pharmacies are able to choose between a number<strong>of</strong> different brands or between one or more brands and generics, and similar issues mayarise as with competition for prescriptions.4.61 Under the 1999 PPRS, a number <strong>of</strong> companies sought to include, in modulation calculations,volumes supplied under ‘brand equalisation’ deals (as discussed, these are supplies <strong>of</strong>branded goods discounted to fulfil generic prescriptions). This would cost the NHS money(since it would not gain from the price cut on brand equalisation volumes) and would alsoprovide the manufacturer in question with a significant competitive advantage against genericmanufacturers. DH told us it had reached a satisfactory agreement with all but one company.Under the 2005 PPRS, brand equalisation volumes meeting generic prescriptions have beenexplicitly excluded from modulation volumes.Competition to supply pharmacies: branded reimbursement4.62 Pharmacies and wholesalers can also choose between direct supplies and parallel imports(which in the UK are reimbursed at the same price). Modulation creates a strong incentive forcompanies to target price reductions on brands with the highest penetration <strong>of</strong> parallelimports. Modulations at the time <strong>of</strong> the 2005 price cut seem to have led to a reduction inaverage parallel import penetration from about 22 per cent in 2004 to 18 per cent in 2005.4.63 <strong>The</strong> development <strong>of</strong> parallel trade in the UK is depicted in the chart below. In 2005, parallelimports supplied about 18 per cent by value <strong>of</strong> branded drugs prescribed in UK primary care,or about £1.25bn at list prices.Figure 4.2: Parallel import penetration on brands in primary care in the UK24.0%January 2005 price cut22.0%20.0%18.0%16.0%14.0%12.0%10.0%Source: IMS, supplied by ABPI64Jul-01Sep-01Nov-01Jan-02Mar-02May-02Jul-02Sep-02Nov-02Jan-03Mar-03May-03Jul-03Sep-03Nov-03Jan-04Mar-04May-04Jul-04Sep-04Nov-04Jan-05Mar-05May-05Jul-05Sep-05Nov-05Jan-06Mar-06May-06
February 20074.64 <strong>The</strong> effects <strong>of</strong> modulations targeted on parallel imports are complex – and discussed ingreater detail in Annexe J – but on balance are likely to be beneficial to the NHS. Perhapsmost importantly, the advantages to companies <strong>of</strong> being able to modulate are likely to makethem willing to accept in negotiations a larger overall price reduction than in the absence <strong>of</strong>modulation. In the longer term, lower parallel imports means a higher proportion <strong>of</strong> NHSpayments going to the company which originally developed the product, and this may beexpected to benefit innovation.Conclusion4.65 <strong>The</strong> price control has achieved savings for the NHS. However, we have concerns about the lack<strong>of</strong> an objective basis for the level to which prices are constrained and the impact <strong>of</strong> modulationon competition both between brands and between branded suppliers and generics.4.66 We would also question whether a system that, while allowing freedom <strong>of</strong> pricing up front,seeks to control prices through subsequent price cuts (the size <strong>of</strong> which is not obviouslyrelated to any objective criteria) represents a sustainable model <strong>of</strong> pricing in the future.Company-wide controls and drug coverage4.67 As the above analysis suggests, PPRS pr<strong>of</strong>it and price controls have several key features incommon that help to define the scheme as a whole.4.68 One <strong>of</strong> these features is that both controls apply at the level <strong>of</strong> the company, across allbranded products supplied – both on- and <strong>of</strong>f-patent – rather than the level <strong>of</strong> the drug.This has led to concerns that the scheme favours companies with a broad portfolio <strong>of</strong> on- and<strong>of</strong>f-patent brands over those that do not, since the controls are less binding on the formerthan the latter. 464.69 An incremental solution to this issue would be to make changes to the scheme’s coverage <strong>of</strong>drugs by excluding <strong>of</strong>f patent brands from overall PPRS controls. This is one <strong>of</strong> the optionsconsidered in Chapter 5 <strong>of</strong> this report.Pr<strong>of</strong>it and price controls do not reflect the value <strong>of</strong> drugs4.70 However, as the above analysis has made clear, the most important concern we have withthe scheme as it is currently designed is that neither the pr<strong>of</strong>it nor the price controls takeaccount <strong>of</strong> the therapeutic value <strong>of</strong> drugs. This undermines the extent to which they can helpsecure value-reflective prices for the NHS. For a scheme that sets out to deliver value formoney for the NHS and give companies the right incentives to invest, we consider this to bea significant flaw. As is discussed in Annexe K, which describes the case studies we haveconducted as part <strong>of</strong> this study, the UK is almost unique in the world in not taking explicitaccount <strong>of</strong> the therapeutic benefits <strong>of</strong> drugs in its pricing system.46 In principle, if severe enough, such disparities could create incentives for the licensing <strong>of</strong> drugs by companies for whichPPRS constraints are binding to firms for which the are less binding (or even, for small firms operating predominantly inthe UK, for the takeover <strong>of</strong> the former by the latter). This is because firms for which the constraints are less binding havegreater pr<strong>of</strong>it- and price control- headroom to exploit useful drugs. While this hypothesis is more plausible in relation toprice cuts (since they impose a greater constraint than the pr<strong>of</strong>it controls), we have not received any compelling evidencethat this happens in practice.65
<strong>The</strong> <strong>Pharmaceutical</strong> <strong>Price</strong> <strong>Regulation</strong> <strong>Scheme</strong>4.71 Some companies we met in the course <strong>of</strong> the study argued that there was no need to linkpricing to value as prices are already value-reflective in the NHS, through the operation <strong>of</strong>other demand side controls at a local and national level, and notably through the creation <strong>of</strong>NICE, SMC and AWMSG.4.72 We have briefly commented, in Chapter 2, on the different influences on prescribers and therole <strong>of</strong> demand side controls. Annexe A gives further details. In short, while there is clearlyvariation in prescriber price sensitivity, our analysis suggests that GPs have fairly weakawareness <strong>of</strong> the relative prices <strong>of</strong> some <strong>of</strong> the most commonly prescribed products and,more importantly, that there is evidence <strong>of</strong> cost ineffective prescribing. <strong>The</strong> role <strong>of</strong> NICE,SMC and AWMSG is particularly relevant to the question <strong>of</strong> whether prices are valuereflectiveunder current arrangements and, accordingly, we review the role <strong>of</strong> these bodies inAnnexe B. A summary <strong>of</strong> our conclusions is presented below.<strong>The</strong> role <strong>of</strong> NICE, SMC and AWMSG4.73 We think the creation <strong>of</strong> NICE, SMC and AWMSG is a positive move towards a fairer andmore efficient system <strong>of</strong> deciding how to use NHS resources. Cost effectiveness evaluationprovides health policy makers with information to compare the costs and benefits <strong>of</strong> differenthealth interventions to aid decisions on resource allocation. It can be a key tool in securingvalue for money across the health economy.4.74 <strong>The</strong>re are three principal rationales for the existence <strong>of</strong> NICE, SMC and AWMSG:• to improve the quality <strong>of</strong> care provided by the NHS• to secure value for money in the use <strong>of</strong> the limited resources the NHS has at itsdisposal, and• to ensure that treatments are available uniformly across the country (that is, to eliminategeographical variations in access).<strong>The</strong> role <strong>of</strong> the bodies4.75 Each <strong>of</strong> the bodies provides guidance to prescribers on the cost effective use <strong>of</strong> medicines.<strong>The</strong> process by which cost effective evaluation is carried out varies between the threenational bodies. NICE assesses both drugs and other healthcare interventions, but it does notconsider all drugs, only those that are referred to it by the Secretary <strong>of</strong> State for Health. NICEhas recently introduced a faster process to evaluate high priority drugs (such as those tocombat cancer) so that guidance is issued closer to when the drug becomes available on themarket. SMC assesses and makes recommendations on drugs alone, but, unlike NICE, itassesses all new drugs. AWMSG provides advice to the Minister for Health & Social Serviceson strategic medicines management and prescribing.4.76 Each body attempts to assess the relative cost effectiveness <strong>of</strong> a drug by estimating theincremental costs and benefits associated with the drug compared to those <strong>of</strong> an appropriatecomparator. Historically, NICE has carried out longer, more detailed assessments <strong>of</strong> drugs,developing its own cost effectiveness model, while the SMC and AWMSG provide morerapid recommendations based on a review <strong>of</strong> manufacturers’ own models. Costs taken intoaccount are those borne by the NHS and Personal Social Services (PSS) budget – <strong>of</strong> whichthe list price <strong>of</strong> a drug is a significant component. Benefits relate both to extensions <strong>of</strong> lifeand improvements in the quality <strong>of</strong> life and are commonly expressed in terms <strong>of</strong> Quality-Adjusted Life Years (QALYs).66
February 20074.77 Although the bodies have not been set a formal cost effectiveness threshold, they generallyrecommend drugs if the incremental cost per QALY is lower than £20,000. Where the cost /QALY is higher than this, the probability <strong>of</strong> recommendation is lower, although the bodiesmay still do so on the basis <strong>of</strong> other factors, such as wider societal costs and benefits.Implementation <strong>of</strong> recommendations4.78 <strong>The</strong> recommendations <strong>of</strong> the three bodies are not binding on prescribers. However, for drugsthat have been recommended, local health authorities must provide funding within 3 monthsfor all patients for whom the recommendations apply.4.79 <strong>The</strong> overall picture as regards the implementation <strong>of</strong> guidance is complex. Prescribing ratesgenerally increase following positive NICE guidance, although in some cases not to the levelsanticipated by NICE when the guidance was issued. <strong>The</strong>re is a number <strong>of</strong> possible reasonsfor this, including clinical resistance and the difficulties experienced by PCTs in fundingexpensive new treatments.4.80 In relation to the implementation <strong>of</strong> negative recommendations (applying to all or someindications), there are difficulties in interpreting the raw prescribing data, since they do notinclude information on patient indications. However, individual analyses that have beenconducted lend support to the view that prescribers may not be following NICE guidance inall cases.4.81 Furthermore, in Scotland prescribing <strong>of</strong> drugs for which SMC has recommended againstprescription in all indications reached almost £5m in 2005. Non-compliance may be more <strong>of</strong>an issue in primary care compared with secondary care. Again, there are likely to be variousreasons for non-implementation, including limited time to interpret and assimilate guidance,clinical resistance and possibly counterveiling influences such as marketing activities.4.82 Despite these problems, guidance does in many cases have an impact on prescribingbehaviour. Positive recommendations can quite clearly increase uptake, for example. It followsthat delays in providing guidance can inhibit uptake – the so-called problem <strong>of</strong> ‘NICE blight’.Issues to address4.83 <strong>The</strong> technical expertise that these bodies bring to bear in conducting cost-effectivenessassessments is <strong>of</strong> world class standard. A number <strong>of</strong> high pr<strong>of</strong>ile, independent studies havegiven positive reviews <strong>of</strong> NICE in particular. Further evidence is provided by the fact that theassessments <strong>of</strong> NICE and SMC are used and referenced in all parts <strong>of</strong> the world.4.84 In the context <strong>of</strong> increasing pressures on NHS budgets and ever-higher drug developmentcosts we believe it is vital that this expertise be put to the best possible use in ensuring NHSresources are spent cost effectively. We have identified a number <strong>of</strong> issues to address if thisis to be achieved. <strong>The</strong>y relate primarily to the remits the three bodies have been given andfall into five high level categories:• the restricted use that is made <strong>of</strong> cost effectiveness evaluation, in particular the inabilityto use it to inform prices directly• the fact that recommendations <strong>of</strong> the bodies (positive or negative) may not be fullyimplemented, undermining the extent to which cost effectiveness assessments delivervalue for money in practice, as67
<strong>The</strong> <strong>Pharmaceutical</strong> <strong>Price</strong> <strong>Regulation</strong> <strong>Scheme</strong>• the fact that not all drugs are assessed and, perhaps most importantly, existing drugs arenot subject to the same level <strong>of</strong> assessment as new drugs• institutional issues, such as the need for earlier engagement between companies andthe cost effectiveness bodies, and• some more technical issues relating to the principles for assessing cost effectivenessand the determination <strong>of</strong> maximum thresholds.4.85 Annexe B elaborates on these issues and proposes some potential solutions. We discussthese in the context <strong>of</strong> considering options for reform in the next Chapter.Evidence on whether prices are value reflective4.86 Ultimately, whether or not prices are value-reflective under current arrangements is anempirical issue. That is why we have undertaken, as part <strong>of</strong> this study, an assessment <strong>of</strong> therelative costs and clinical benefits <strong>of</strong> some <strong>of</strong> the largest selling drugs in the NHS. This is setout in Annexe M. We have identified hundreds <strong>of</strong> millions <strong>of</strong> pounds <strong>of</strong> expenditure that webelieve could be used more cost effectively, in allowing patients access to the drugs andother treatments they need, but where access is currently restricted.4.87 Where access is restricted on cost or cost effectiveness grounds, it is vitally important thatall drugs – old and new – are assessed on the same basis. This does not happen across theboard under current arrangements. To restrict access to new treatments while ignoringinefficiencies in current expenditure is not an efficient use <strong>of</strong> resources. Nor is it in theinterests <strong>of</strong> patients.Stability and dialogue4.88 Most companies we spoke to were, in broad terms, positive about the PPRS. But it hasbecome clear to us that – freedom <strong>of</strong> pricing apart – it is not so much specific features <strong>of</strong> thePPRS that companies find positive, but rather the broader institutional framework withinwhich the scheme operates, and, most importantly, the relative stability it affords them.4.89 Indeed, in its second submission to the OFT, the ABPI argued that, specifically in relation tothe strength <strong>of</strong> the PPRS as a factor in attracting investment to the UK,“the value <strong>of</strong> the PPRS as an investment incentive is not a ‘direct’ effect <strong>of</strong> specific PPRSprovisions, but a consequence <strong>of</strong> the stable framework it provides and the general‘industry-friendly’ environment in the UK <strong>of</strong> which the PPRS forms a key part.”4.90 We are entirely sympathetic with the view that ongoing dialogue between Government andindustry is an important feature <strong>of</strong> a successful pricing regime. In Chapters 5 and 6 we setout how, in our view, this stability could be retained and indeed improved upon, under areform <strong>of</strong> the scheme that addressed the concerns expressed in this Chapter in relation tothe PPRS pr<strong>of</strong>it and price controls.68
February 20075 OPTIONS FOR REFORMIntroduction5.1 This Chapter explores possible alternative approaches to the PPRS for the pricing andreimbursement <strong>of</strong> branded prescription medicines in the NHS. It builds on the analysiscontained in the previous chapters <strong>of</strong> the report, which have considered the role <strong>of</strong> the PPRSwithin UK and international markets and analysed the scheme’s pr<strong>of</strong>it and price controls. Italso draws on a review we have conducted into pricing and reimbursement arrangements inten major countries. 475.2 <strong>The</strong> Chapter is structured as follows:• the first section sets out the key objectives that, in our view, a pricing scheme shouldaim to achieve. <strong>The</strong>se form criteria against which to assess alternative approaches• the second section provides a brief overview <strong>of</strong> alternative pricing and reimbursementregimes, drawn from our international survey <strong>of</strong> ten leading countries• the third section sets out proposed reforms to the pricing <strong>of</strong> <strong>of</strong>f-patent brands• the fourth section draws up four possible alternative arrangements for the pricing <strong>of</strong>on-patent brands, including incremental reform to existing PPRS controls and reformsthat involve replacing those controls with a value-based pricing approach, and• the final section presents a high level evaluation <strong>of</strong> the options and provides a broadassessment <strong>of</strong> the likely costs and benefits <strong>of</strong> our preferred approach – a value-basedapproach to pricing.5.3 Several companies and government stakeholders have told us that while value-based pricingmay be attractive in principle it is very important to be clear on the details <strong>of</strong> how any suchscheme would work in practice, in particular how institutions would work and the rules andprocedures they would be implementing. This chapter and the next can only cover the keyissues at a high level. Annexe L explains in greater detail how an alternative scheme couldwork in practice.5.4 We should note that the objective <strong>of</strong> the report is not simply to set out our proposedapproach, however, but also to explore alternative options and explain, where appropriate,why we have rejected them. We do so because a key role <strong>of</strong> this study is to improve theterms <strong>of</strong> debate about pharmaceutical pricing and reimbursement, not just in the UK, butinternationally. Again, greater detail is provided in Annexe L.Objectives5.5 <strong>The</strong>re are several high-level objectives that, in our opinion, should guide the design <strong>of</strong> apricing scheme for branded prescription drugs. <strong>The</strong>y relate to:• achieving efficiency in the short and long run• workability• appropriately allocating risks between companies and the NHS, and• transparency.47 <strong>The</strong>se are described in Annexe K.69
<strong>The</strong> <strong>Pharmaceutical</strong> <strong>Price</strong> <strong>Regulation</strong> <strong>Scheme</strong>Economic efficiency5.6 We would regard achieving economic efficiency to be the most important goal <strong>of</strong> any drugpricing scheme. It captures the twin goals <strong>of</strong> delivering value for money for the NHS whileproviding the right incentives to companies to invest in drugs in the future. It is thereforecentral to the interests <strong>of</strong> patients in the short and long run. This concept <strong>of</strong> short and longrun efficiency is at the heart <strong>of</strong> stated objectives <strong>of</strong> the PPRS, as discussed in theintroduction to the report. In a sense all the other objectives we discuss can be consideredsubsidiary to this fundamental goal.Workability5.7 Any pricing scheme clearly needs to be workable in practice. Three important dimensions <strong>of</strong>workability for a pricing scheme are that it should: be practicable within informationconstraints; provide patients access to cost effective drugs within a reasonably shorttimescale and maintain stability <strong>of</strong> supply; and be legally defensible.Allocation <strong>of</strong> risks5.8 Both companies and public bodies have told us that stability is a very important attribute in apricing scheme, in particular financial stability (for companies, stability or at least predictability<strong>of</strong> revenue and for Government, predictability <strong>of</strong> expenditure). In practice, this goal may bedifficult to achieve when unforeseen events occur (such as the entry <strong>of</strong> a highly beneficialdrug onto the market), calling for flexibility (that is, the ability to respond appropriately andrapidly to changing circumstances).5.9 <strong>The</strong> design <strong>of</strong> a scheme must therefore recognise there is a trade <strong>of</strong>f between stability andflexibility and that, in many cases, there is also a trade <strong>of</strong>f between the degree <strong>of</strong> stabilityafforded to payers and that afforded to companies. Getting this balance right meansallocating risks appropriately, which in our view implies that individual risks should beallocated to the entity most able to bear and manage them. <strong>The</strong>refore, for example,companies should bear commercial and development risks, such as the risks relating to aproduct’s efficacy relative to those <strong>of</strong> substitutes, since this gives them good incentives tocompete by investing in better products in the future.Transparency5.10 Transparency is important in the first instance because it underpins all the other objectivesset out here. Companies must understand the risks to which they are exposed and theincentives that arise out <strong>of</strong> them to respond efficiently to a well-designed scheme (notably toinvest in drugs that society values the most). Second, to gain the support <strong>of</strong> stakeholders ascheme should not only work well but be seen to work well. Companies, NHS bodies andpatients should all be confident that decisions are made on a fair and equitable basis, withthe reasoning clearly set out. <strong>The</strong> interests <strong>of</strong> the taxpayer should also be met in ensuringthere is proper accountability for the use <strong>of</strong> public resources.Conclusion5.11 <strong>The</strong> objectives set out above should not be controversial in themselves, and indeed are eitherexplicit or implicit within the current stated objectives <strong>of</strong> the PPRS. However, achieving themin practice involves difficult trade <strong>of</strong>fs, and raises a number <strong>of</strong> different issues that need to beaddressed in designing a pricing scheme. <strong>The</strong>se issues are set out below.70
February 2007Overview <strong>of</strong> pricing and reimbursement systems around the world5.12 This section briefly reviews alternative approaches to setting prices for prescription drugs(<strong>of</strong>ten reimbursed prices) drawing on the international case studies conducted as part <strong>of</strong> thisstudy. Each individual system represents a number <strong>of</strong> specific choices against the designissues discussed in Annexe L.5.13 A summary overview <strong>of</strong> features <strong>of</strong> the systems we have reviewed is presented in the tablebelow. It splits up the key approaches to pricing by type – for example, international referencepricing as opposed to pr<strong>of</strong>it controls – and according to whether they are applied before thedrug in question can be reimbursed – ex ante controls – or once the drug is already on themarket – ex post controls. This distinction between ex ante and ex post controls is a key one,which is reflected in two <strong>of</strong> the options that we consider later in this chapter.Table 5.1: Overview <strong>of</strong> different drug pricing & reimbursement systemsEx anteEx postfree pricing / pricing IRP PVA / price pr<strong>of</strong>it pricing IRPimmediate relative to rebates cuts controls relative toreimbursement substitute substituteAustralia ✔ ✔ ✔Canada ✔* ✔** ✔Finland ✔ ✔ ✔ ✔ ✔France ✔ ✔** ✔ ✔ ✔Germany ✔ ✔ ✔Netherlands ✔ ✔ ✔ ✔Spain ✔ ✔ ✔ ✔ ✔Sweden ✔ ✔Switzerland ✔ ✔ ✔ ✔UK ✔ 48 ✔ ✔US ✔ ✔ ✔*non-innovative drugs ** innovative drugsIRP: International Reference PricingPVA: <strong>Price</strong> Volume Agreements5.14 <strong>The</strong>re is a lot <strong>of</strong> complexity in the pricing and reimbursement arrangements adopted bycountries around the world, <strong>of</strong> which this table only provides a high level summary. Forexample, the US is a highly disaggregated system with many different payers (public andprivate) and intermediaries negotiating prices and reimbursement status. <strong>The</strong> table reflectsthe fact that in almost all cases, there is some form <strong>of</strong> assessment and negotiation before adrug can be included on the formulary <strong>of</strong> reimbursable products.48 Free pricing takes place for New Active Substances only. Non new active substances are priced according to theprovisions set out in Chapter 4.71
<strong>The</strong> <strong>Pharmaceutical</strong> <strong>Price</strong> <strong>Regulation</strong> <strong>Scheme</strong>5.15 It should also be noted that, although the UK is one <strong>of</strong> the few countries in the world (alongwith Germany) not to impose an absolute requirement for a decision on price before aproduct is reimbursed, this only applies to New Active Substances. Provisions for the pricing<strong>of</strong> non-New Active Substances are set out in the PPRS, as discussed in the last chapter.Furthermore, bodies such as NICE and SMC increasingly conduct early reviews <strong>of</strong> drugs inorder to provide guidance on their use to prescribers in the NHS. A key difference betweenthe UK and other countries is the fact that many other countries have a system in which thereimbursed price can differ from the price actually paid by patients.5.16 For a detailed discussion <strong>of</strong> the systems summarised here, please see Annexe K. <strong>The</strong> UKsystem is described at length in Annexe A.5.17 Despite the complexity <strong>of</strong> different systems, it is possible to identify three basic approachesto setting the price (more commonly the reimbursed price) <strong>of</strong> pharmaceuticals:• approaches based on international reference pricing• cost and pr<strong>of</strong>it-based approaches, and• value-based approaches (a broad term comprising systems that set prices with respectto the price <strong>of</strong> substitute products or, if none is available, a placebo).International reference pricing5.18 International reference pricing (IRP) involves setting prices with reference to those set inother countries. Countries that use IRP as the sole approach to price setting effectively avoidtaking an independent view on the appropriate prices <strong>of</strong> pharmaceuticals and rely entirely onthe judgements <strong>of</strong> other countries. 49 This might be a pragmatic solution for smaller countries,given the relatively high costs <strong>of</strong> carrying out independent assessments.5.19 However, IRP involves a number <strong>of</strong> significant practical difficulties. First, it is <strong>of</strong>ten difficult toestablish the prices that are actually paid in the countries referred to, given the extensive use<strong>of</strong> rebates in pricing and reimbursement systems. 50 <strong>The</strong> approach also suffers from thenumerous technical difficulties in making comparisons which were briefly discussed above.5.20 Even if these issues could be addressed, the use <strong>of</strong> IRP would not be a viable approach forthe UK to adopt. This is because, as discussed in Chapter 3, a significant number <strong>of</strong> countriesalready reference to the UK. Furthermore, our international research has confirmed that UKprices are <strong>of</strong>ten used in implicit price comparisons (that is, as part <strong>of</strong> company / countrynegotiations) even where they are not used in formal international reference price schemes.5.21 Currently the UK, along with Germany, is one <strong>of</strong> the few major European countries that doesnot reference to other countries. Because the UK is a de-facto price leader in Europe we donot think it feasible to set prices here by international referencing since any attempt to do sowould quickly render European prices circular. International reference pricing is thereforeexcluded from further consideration <strong>of</strong> options for reform in this Chapter.49 In practice, most countries use IRP as one <strong>of</strong> a range <strong>of</strong> measures to price setting or only use it for a limited range <strong>of</strong>drugs. Canada and France provide examples.50 <strong>The</strong> EU <strong>Pharmaceutical</strong> Forum is currently considering how to improve the transparency <strong>of</strong> pricing and reimbursementdata exchanged between Member States, partly in response to such concerns.72
February 2007Cost and pr<strong>of</strong>it-based approaches5.22 An alternative approach is to seek to control the pr<strong>of</strong>itability <strong>of</strong> companies selling drugs to thepublic health system. <strong>The</strong> PPRS pr<strong>of</strong>it control is perhaps the only operational approach <strong>of</strong> thistype in the world. While systems in Spain and Australia refer in principle to costs and pr<strong>of</strong>itsas factors to be taken into account in deciding pricing and reimbursement, in neither countryare these criteria used in practice.5.23 In the last Chapter, we discussed difficulties with attempting to regulate the pr<strong>of</strong>its <strong>of</strong>pharmaceutical companies. <strong>The</strong> principle concern we have with a system that attempts toremunerate on the basis <strong>of</strong> inputs (costs) is that there is little systematic link between thecosts and outputs <strong>of</strong> innovative activity in the pharmaceutical sector – through skill andingenuity different firms will enjoy very different levels <strong>of</strong> success in producing useful drugsfrom a given level <strong>of</strong> expenditure on R&D. To these can be added practical difficulties,relating to the identification and allocation <strong>of</strong> costs, which arise primarily from theinternational nature <strong>of</strong> the industry.5.24 We explore options for addressing the concerns above while retaining a cost-based schemeas part <strong>of</strong> our consideration <strong>of</strong> Option one.Value-based approaches5.25 As the table shows, most countries take some account <strong>of</strong> relative therapeutic benefits whensetting the public reimbursement prices <strong>of</strong> branded prescription medicines. <strong>The</strong> approachestaken vary widely in terms <strong>of</strong> methodology and aims, however. We set out our views on theappropriate approach to take in the discussion <strong>of</strong> Options 2 and 3 below. Different valuebasedapproaches are discussed in more detail in Annexe L.Off-patent brands5.26 This section explores options to reform the pricing <strong>of</strong> branded drugs for which the patent hasexpired, which are currently priced under the PPRS. 51 It first summarises problems identifiedin other parts <strong>of</strong> the report, before recommending changes to current pricing and marginarrangements. Finally transitional arrangements are considered.5.27 In the 2005 PPRS, it was stated that ‘standard’ branded generics (that is, non-originatorbrands) would, subject to public consultation, no longer be covered by the PPRS and wouldbe transferred to the new arrangements for the reimbursement <strong>of</strong> generics. This consultationwas put on hold pending the outcomes <strong>of</strong> the present study. Our recommendations coverboth originator and non-originator <strong>of</strong>f-patent brands.Summary <strong>of</strong> problems5.28 <strong>The</strong> most fundamental concern we have with current pricing arrangements for <strong>of</strong>f-patentbrands is that they do not deliver value for money for the NHS. Generic pricing arrangements(under the Category M scheme) have helped ensure that competition between genericmanufacturers delivers savings to the NHS. In contrast, <strong>of</strong>f-patent brands – whether51 When prescribed by brand name. As explained elsewhere in the report, a brand dispensed to meet a generic prescriptionis remunerated as a generic unless the pharmacy can demonstrate no generics are available.73
<strong>The</strong> <strong>Pharmaceutical</strong> <strong>Price</strong> <strong>Regulation</strong> <strong>Scheme</strong>originator or not – are priced under PPRS price and pr<strong>of</strong>it controls and, in most cases, aremany times more expensive than their generic equivalents. In Annexe M, we provide a range<strong>of</strong> estimates for savings that could be produced if <strong>of</strong>f-patent brands with equivalent genericproducts were reimbursed in line with prices <strong>of</strong> their generic equivalents.5.29 Considering brands with Category M equivalent generics only and excluding modified releaseproducts, we estimate that savings to the NHS would amount to about £65m per year from achange in reimbursement regime. 52 All <strong>of</strong> the drugs considered in the analysisare fully bioequivalent (that is, consist <strong>of</strong> drugs <strong>of</strong> the same chemical form and strength).<strong>The</strong>refore, very significant price disparities cannot be justified on value for money grounds –one <strong>of</strong> the fundamental objectives set out above.5.30 In Chapters 2 and 4, we identified two further problems that have the potential to underminecompetition between branded and generic manufacturers.5.31 First, differences in the method <strong>of</strong> calculating reimbursement prices between brands andgenerics mean that the levels <strong>of</strong> margin earned on dispensing as a brand (at least, fordomestically-sourced supply) are much lower than those earned on dispensing as a generic.This can be a source <strong>of</strong> considerable advantage to branded manufacturers competing withgenerics, since it allows them to market their products to GPs and PCTs as cheaper thangenerics and yet still sell to pharmacies at a higher price. Where this occurs, would alsoincrease costs to the NHS.5.32 Second, PPRS rules on modulation have the potential to distort competition between <strong>of</strong>fpatentbrands and generics by creating the incentive for a multi-product company to increasethe price <strong>of</strong> products which are relatively price insensitive and reduce the price, possibly tobelow marginal cost, <strong>of</strong> products which are relatively price sensitive. This would be to theadvantage <strong>of</strong> companies with many products with differing price sensitivity, but is to thedisadvantage <strong>of</strong> the NHS (which experiences higher cost), smaller branded suppliers (whichfind it more difficult to modulate because <strong>of</strong> their smaller product range) and genericsuppliers.Options for reform5.33 In Annexe L we assess several options for reform <strong>of</strong> reimbursement arrangements, againstthe objectives discussed above: principally whether they deliver short-run and dynamicefficiency and are stable. <strong>The</strong> options are:• Option 1: Exclude all <strong>of</strong>f-patent brands from price modulation returns• Option 2: Reimburse pharmacies for dispensing against a prescription for a standardbranded generic at the lesser <strong>of</strong> the Drug Tariff price <strong>of</strong> the comparable generic or the listprice <strong>of</strong> the branded generic• Option 3: Reimburse pharmacies for dispensing against a prescription for all <strong>of</strong>f-patentbrands (including originator brands as well as branded generics) at the Category Mgeneric price, so long as the drug has a Category M equivalent, and• Option 4: As for Option 3 but with additional steps to remove incentives to exploitmargin differences. In the short term, it could involve passing margin effects through toPCTs via the financial settlement.52 This reflects a 25 per cent brand premium, as discussed below.74
February 20075.34 We do not describe each <strong>of</strong> these options here, but simply present Option 3 – our preferredoption – with a brief comparison to Option 2, which is, in essence, the option on which DHconsulted in 2005 and 2006.5.35 Two important components <strong>of</strong> Option 2 are that it would only cover non-originator brands(standard branded generics) and that the reimbursement price would be set at the lower <strong>of</strong>the comparable generic or the list price <strong>of</strong> the branded generic. In a Regulatory ImpactAssessment (RIA) for the proposal, DH estimated the savings from such a change to be‘some £10 million a year’. 535.36 Option 3 differs from Option 2 in three respects.• first, the proposal is restricted to brands with Category M generic equivalents (rather thanany generic equivalent). This is partly on grounds <strong>of</strong> tractability and ease <strong>of</strong> transition (as itwould focus on an easily definable group <strong>of</strong> drugs accounting for the majority <strong>of</strong>expenditure implications, as shown above). More importantly, however, restricting theproposals to Category M drugs provides a mechanism by which in the future when drugsgo <strong>of</strong>f patent, generics have a chance to enter the market and foment competition beforethe price falls. This is essential to the stability and sustainability <strong>of</strong> proposed arrangements• second, the proposal is that the <strong>of</strong>f-patent brand price should be set at that <strong>of</strong> the genericcomparator, rather than at the lower <strong>of</strong> the brand price and the generic comparator.Assuming the price <strong>of</strong> the generic comparator is set through the broadly competitiveCategory M system, we see no reason for setting the brand price below this, and• third, the proposal includes both originator and non-originator brands. A central designprinciple, discussed at the beginning <strong>of</strong> this chapter, is that price should be valuereflectiveto promote static and dynamic efficiency. In our view, there is no argument forexcluding <strong>of</strong>f-patent originator brands from these principles. Indeed the arguments are ifanything stronger when applied to <strong>of</strong>f-patent brands, since under current arrangementsthere are some extreme examples <strong>of</strong> prices not reflecting value to patients (for example,twenty fold differences in price for chemically identical products).5.37 However, it is important to maintain the impetus for generic prescribing, in order to retainincentives for generics to enter the market. If brands are reimbursed at the same price asgenerics, GPs may prefer to prescribe a brand by its name on patent expiry, as this is whattheir patients are familiar with. In the light <strong>of</strong> this, we would suggest that originator brands bereimbursed at up to 25 per cent above the generic price.5.38 We also recognise that originator manufacturers may face parallel trade difficulties from asudden change in the price <strong>of</strong> the brand, given the fact that patents expire at different timesacross Europe. To help companies deal with this, we would suggest they be given the option<strong>of</strong> making a payment to the NHS in lieu <strong>of</strong> changing the list price <strong>of</strong> their products.5.39 It is also likely that there would need to be a limit on the list price charged by the brandedsupplier, to avoid the risk <strong>of</strong> loss to pharmacies.5.40 Option 3 could in principle also address the potential for distortion arising from differentlevels <strong>of</strong> margin currently applying to brands and generics – because, if brands arereimbursed at the same price as generics, PCTs no longer have a financial incentive toencourage prescribing <strong>of</strong> brands. However, we note that Option 3 does not address the53 Reimbursement <strong>of</strong> ‘standard’ branded generic medicines: A further consultation, DH, 2005.75
<strong>The</strong> <strong>Pharmaceutical</strong> <strong>Price</strong> <strong>Regulation</strong> <strong>Scheme</strong>margin issue at source. If margin-related distortions to competition persist, we think themost logical solution in the long run would be to continue the move in the current PharmacyContract to remunerate pharmacies through fees for service rather than through theCategory M margin. 54Value for money benefits5.41 As shown in the table below, we estimate Option 3 would deliver efficiency savings to theNHS <strong>of</strong> around £64 million per year if all <strong>of</strong>f-patent drugs with Category M equivalents werereimbursed at generic list prices plus 25 per cent. This is based on 2005 data. In reality,savings under our recommendation (to apply a premium only to originator brands and notother branded generics) would be slightly higher than this figure and somewhere betweenthe two figures presented in the table below. 55Table 5.2: Savings from reimbursing <strong>of</strong>f-patent brands at Category M generic prices(plus 25 per cent) in 2005 (£ millions)Country Cat. M equivalent plus 25% Cat. M equivalent (no premium)England £34.7m £44.9mScotland £15.4m £20.2mWales £2.7m £3.2mNorthern Ireland £11.0m £14.6mTotal £63.8m £82.9mSource: OFT calculations based on PCA and Drug Tariff data for the UK.Recommendation5.42 We recommend that:• For standard branded generics for which there is a bioequivalent generic supplysubject to Category M pricing, pharmacies should be reimbursed at the CategoryM generic price• For originator brands for there is a Category M equivalent, pharmacies should bereimbursed at the Category M generic price (plus a maximum <strong>of</strong> 25 per cent) 56• In both cases, the list price <strong>of</strong> the brand supplier would not be permitted to exceed thereimbursement price by more than a given percentage, reflecting prevailing levels <strong>of</strong>clawback, and• Furthermore, the brands covered by these arrangements would be excluded fromthe PPRS price control, in particular its modulation provisions.54 It should be noted here that the positive incentive properties <strong>of</strong> <strong>Scheme</strong> M could be retained with a much lower level <strong>of</strong>retained margin.55 Furthermore, this estimate does not take into account any savings from removing exploitation <strong>of</strong> brand / generic margindifferences.56 As noted, if suppliers wished, pharmacies could continue to be reimbursed at a price up to that prevailing beforepatent/SPC protection as long as the supplier agreed to repay to the NHS the difference between this price and thebranded price.76
February 20075.43 Off-patent brands for which there is no Category M equivalent product would be reimbursedunder the same arrangements as on-patent brands. <strong>The</strong>se are discussed in the next section.Options for reform <strong>of</strong> pricing <strong>of</strong> on-patent brands5.44 This section summarises options for reform <strong>of</strong> pricing arrangements for on-patent brands.<strong>The</strong> main focus is on two variants <strong>of</strong> value-based pricing, which constitute our recommendedapproach. We briefly mention the other two options here – incremental reform to existingPPRS controls and local bargaining. A more detailed description <strong>of</strong> each <strong>of</strong> the options isagain provided in Annexe L.Option one: incremental reform to existing PPRS controls5.45 Under this option, we assess how far incremental reform to the existing PPRS price andpr<strong>of</strong>it control could meet the objectives set out above, while retaining their fundamentalcharacteristic <strong>of</strong> being imposed at a company level, rather than individual drug level.<strong>Price</strong> cuts and modulation5.46 As regards the price cuts, our finding was that they do deliver savings in primary care, butthat the level to which prices are constrained is arbitrary as it is not linked to the therapeuticvalue <strong>of</strong> drugs to patients. We also found that the arrangements for averaging price increasesand decreases (modulation) have the potential to distort competition (see Annexe J).5.47 We believe there is limited potential for incremental change to address these problems(beyond the changes that would arise from removing <strong>of</strong>f-patent brands from pricemodulation). This is partly because an element <strong>of</strong> arbitrariness is inherent to the currentsystem <strong>of</strong> negotiated price cuts and control at company, rather than individual drug, level.5.48 <strong>The</strong> potential distortion to competition could in principle be addressed by removingcompanies’ freedom to modulate prices but this would substantially reduce their flexibility, inparticular to respond to parallel imports. Under the current framework, this would in turnmake companies less willing to accept price cuts and hence may result in higher prices. 57<strong>The</strong>refore, were company-level controls to remain in place, we would not be in favour<strong>of</strong> removing price modulation, beyond the removal <strong>of</strong> <strong>of</strong>f-patent brands frommodulation as discussed in the last section.Pr<strong>of</strong>it control5.49 As regards the PPRS pr<strong>of</strong>it control, as discussed in Annexe H, our principal concern was thatit provides weak incentives for investing in the most beneficial drugs. In practice, we foundthat it does not constrain the pr<strong>of</strong>its <strong>of</strong> most existing member companies but may potentiallyhave adverse effects in deterring entry and/or rapid expansion by research intensive smallcompanies focused on the UK. 58 7757 We have also given some thought to the method <strong>of</strong> averaging prices used in modulation calculations. At present DHmeasures delivery <strong>of</strong> the price control using current volume weights. Using base weights might reduce the potentialdistortion <strong>of</strong> competition but would create other problems, for example an incentive to increase the price <strong>of</strong> products forwhich demand is growing relatively rapidly.58 We did not identify AFR companies with these characteristics that are currently disadvantaged in this way in practice. Butthe design <strong>of</strong> the scheme is a potential constraint on entry / expansion by such companies in the future.
<strong>The</strong> <strong>Pharmaceutical</strong> <strong>Price</strong> <strong>Regulation</strong> <strong>Scheme</strong>More binding pr<strong>of</strong>it control5.50 As noted above, one suggestion put to us was that price cuts should be taken out <strong>of</strong> thePPRS altogether, and if necessary replaced with a more binding pr<strong>of</strong>it control. While suchproposals have not included any degree <strong>of</strong> detail, this section considers the feasibility <strong>of</strong> thisoption, by working through what, in our view, it would entail in practice.5.51 Tightening the pr<strong>of</strong>it control so as to reduce reliance on price cuts would involve a number<strong>of</strong> problems.• unless modified to reflect some measure <strong>of</strong> the value <strong>of</strong> the drugs produced by a company(a possibility we consider at the end <strong>of</strong> this section), a pr<strong>of</strong>it cap suffers from thefundamental problem that it provides weak incentives to invest in the most useful drugs• a pr<strong>of</strong>it control based on the current PPRS approach to transfer pricing cannot be bindingfor most companies because they have the freedom to use, and most do actually use,resale-minus transfer prices. Any binding pr<strong>of</strong>it control would require companies toprovide, and DH or independent auditors to verify, data on costs incurred outside the UK.This would be very complex and burdensome both for companies and DH• broad allowances do not reflect the individual circumstances <strong>of</strong> each company, andidentifying an ‘efficient’ level <strong>of</strong> costs is extremely difficult in the pharmaceutical sector,since each firm has a very different portfolio <strong>of</strong> projects. It therefore seems likely thatmore reliance would have to be placed than at present on actual costs rather thanallowances. This would reduce companies’ incentive to control costs and may lead toincreases in costs and prices, and• capitalising and depreciating R&D potentially reflects each company’s circumstances butit is unclear how R&D capital and depreciation should be allocated to the UK.Furthermore each <strong>of</strong> the main approaches to capitalising R&D involves incentivedrawbacks: capitalising only successful R&D requires a target rate <strong>of</strong> return above thecost <strong>of</strong> capital, creating an incentive to over-invest in low-risk assets, while capitalising allR&D fails to reward successful rather than unsuccessful R&D.Conclusion on Option one5.52 Our summary conclusions on Option one are that:• the case for attempting to replace the price control with a more binding pr<strong>of</strong>itcontrol is weak. We do not think a binding control is feasible for the majority <strong>of</strong>companies that use resale minus transfer prices, without a very resource-intensiveprocess <strong>of</strong> attempting to audit data on costs incurred outside the UK. Still less would itbe possible to identify an ‘efficient’ level <strong>of</strong> costs under such a scheme. If a schemewere binding, it would therefore suffer from the fundamental incentive problems <strong>of</strong>giving poor incentives for efficient and effective expenditure• We would be in favour <strong>of</strong> dropping the pr<strong>of</strong>it control altogether, but if it isretained, its potential adverse effects on smaller research intensive companiesfocused on the UK should be addressed. This could be done through modifying thepr<strong>of</strong>it target, increasing the R&D allowance for highly research intensive companies andsmoothing pr<strong>of</strong>its for young companies, and• A formal mechanism could be introduced to allow price increases on drugs wherethe avoidable cost <strong>of</strong> supplying the NHS exceeds NHS revenue.78
February 20075.53 <strong>The</strong>se changes would not address our main concerns with the existing PPRS, in particularthey would not provide a mechanism for linking prices to the value <strong>of</strong> patient benefits. Inprinciple, notions <strong>of</strong> therapeutic value could be grafted on to current PPRS controls. Forexample, one suggestion we received was that the rate <strong>of</strong> return earned by companiesshould be linked in some way to the therapeutic value <strong>of</strong> a company’s products. This wouldbe at best a very indirect way <strong>of</strong> attempting to set value-based prices and, given theproblems with the pr<strong>of</strong>it control identified above, would almost certainly not be binding formost companies.5.54 Alternatively, the level <strong>of</strong> the price cut could be amended to reflect therapeutic value. This hasstrong similarities with elements <strong>of</strong> Option two in particular (except that we envisage that itwould apply at the product level rather than the company level). We discuss this option next.Options two and three: ex post and ex ante value-based pricing5.55 Options two and three would both involve replacing existing company-wide PPRS pr<strong>of</strong>it andprice controls with controls reflecting the therapeutic value <strong>of</strong> individual products. Weconsider them together here because they are both based on similar principles: namely,establishing the maximum price <strong>of</strong> a product based on assessments <strong>of</strong> its incremental costeffectiveness relative to a comparator.Overview <strong>of</strong> Option two5.56 Under Option two – ex post value-based pricing – manufacturers would retain freedom <strong>of</strong>pricing for NAS at launch. Instead <strong>of</strong> pr<strong>of</strong>it controls and company-wide price cuts, themaximum list prices <strong>of</strong> all on-patent branded drugs would be reset according to analyses <strong>of</strong>cost effectiveness during price reviews occurring at five-year intervals, with the first review<strong>of</strong> each product falling at most five years after launch. This option would not involve ex anteprice reviews. Existing arrangements for ex ante assessments would be retained, underwhich SMC and NICE (through the STA process) review the cost effectiveness <strong>of</strong> drugs andissue guidance to prescribers on their use.Overview <strong>of</strong> Option three5.57 Option three – ex ante value-based pricing – would move further away from the current PPRSby restricting manufacturers’ freedom <strong>of</strong> pricing for NAS at launch. In place <strong>of</strong> free pricing,this option involves a rapid upfront negotiation <strong>of</strong> price. In most cases, there would be a fasttrack pricing decision (that is, a maximum price agreed for an individual product). Conversely,if the data were clear at the time <strong>of</strong> launch that the drug was not cost effective (for example,the drug was clearly dominated and there was no possibility <strong>of</strong> reaching an agreement onprice), then reimbursement would be refused. <strong>Price</strong>s set by the fast track ex ante processwould still be subject to ex post reviews, to take account <strong>of</strong> such factors as a comparatorproduct going <strong>of</strong>f patent.5.58 Where sufficient information at the time <strong>of</strong> launch was not available to take an informedview, there would be a possibility <strong>of</strong> negotiating a risk sharing agreement with the relevantauthority, if the body in question agreed that the drug was suitable for such an approach.This would require the company and payer to agree a contract in which the drug isreimbursed, contingent on claims <strong>of</strong> clinical effectiveness being realised in practice. Ifexpected outcomes are not realised, prices would be changed and / or repayments made.Risk sharing arrangements would not be the norm, but might be relevant for the treatment<strong>of</strong> chronic (as opposed to acute) conditions, where final clinical outcomes may only becomeclear after several years <strong>of</strong> use.79
<strong>The</strong> <strong>Pharmaceutical</strong> <strong>Price</strong> <strong>Regulation</strong> <strong>Scheme</strong>5.59 After any price change following a risk-sharing review, a reconciliation payment would bemade between the manufacturer concerned and the Departments <strong>of</strong> Health to compensatefor the difference with the initial price over the period between launch and the review. Thus ifthe agreed launch price was lower than the reviewed level, manufacturers would receivecompensation for the difference over prescribed volumes in the interim. High interim priceswould trigger repayments from companies to government. Reconciliation is intended to makethe system as flexible as possible for manufacturers while avoiding perverse incentives topursue risk sharing rather than the fast track ex ante approach.5.60 In the following sections, we give a brief description <strong>of</strong> some <strong>of</strong> the common principlesinforming Options two and three before contrasting the ex ante and ex post approaches.Establishing the value <strong>of</strong> a drug5.61 In both approaches, the method employed for establishing the value <strong>of</strong> a drug would be key.As noted in the last chapter, a popular measure <strong>of</strong> the therapeutic benefits delivered by drugsand other interventions is the Quality Adjusted Life Year (QALY). In the UK, NICE and SMC<strong>of</strong>ten use QALYs to assess the benefits <strong>of</strong> medicines and inform cost-effectivenessdecisions. QALYs are also used by many other pricing and cost-effectiveness bodies aroundthe world.5.62 Annexe B provides a detailed discussion <strong>of</strong> QALYs, including how they are derived and usedin cost effectiveness analysis. In short, as a measure that allows comparisons to be made <strong>of</strong>the cost effectiveness <strong>of</strong> treatments across different diseases, we believe QALYs are a keytool in securing value for money across the health economy.5.63 We recognise that there are areas <strong>of</strong> keen debate over their use. Some companies feel, forexample, that the QALY measure is biased towards life saving drugs (that is, it is hard todemonstrate QALY gain in drugs which improve the quality <strong>of</strong> life for patients suffering fromcertain types <strong>of</strong> illness but do not increase their length <strong>of</strong> life). It should be noted, however,that where these issues do arise they <strong>of</strong>ten reflect fundamental problems <strong>of</strong> a lack <strong>of</strong>information (evidence that a drug does indeed improve a patient’s quality <strong>of</strong> life) rather thanproblems created by a particular methodological approach.5.64 QALYs typically form the basis <strong>of</strong> Incremental Cost Effectiveness Ratios (ICERs) used fordetermining the value for money <strong>of</strong> a new treatment relative to an appropriate comparator.This ratio takes the following general form (where cost is measured in pounds and benefitsin QALYs):ICER =Cost New drug – Cost ComparatorBenefit New drug – Benefit Comparator5.65 Under a value-based pricing approach, a maximum ICER would be set for all drugs. 59 <strong>The</strong>price <strong>of</strong> a branded drug could not exceed the level at which its ICER (relative to a comparatorproduct) reaches this threshold. <strong>The</strong> manufacturer could price below this threshold. However,once the product has been sold to the NHS at a given price, that price could notsubsequently increase. This is primarily in the interests <strong>of</strong> budgetary stability for the NHS.59 As suggested below, the level <strong>of</strong> the maximum ICER could be a matter <strong>of</strong> debate for the government and thepharmaceutical industry and could be reviewed in periodic renegotiations <strong>of</strong> a value-based PPRS.80
February 20075.66 Annexes B and L explore in some detail some <strong>of</strong> the more controversial issues in theassessment <strong>of</strong> the costs and benefits <strong>of</strong> drugs and other treatments. We give a briefconsideration to two <strong>of</strong> these – non patient benefits and whether to recognise innovationper se – below.Non patient benefits5.67 We are sympathetic with company views that the notion <strong>of</strong> therapeutic value shouldembrace not just benefits to the patients themselves but to others who are affected bytheir condition, such as carers. 60 In recent assessments, NICE has made some moves inthis direction and this is to be welcomed. 61Whether to recognise innovation per se5.68 Some have suggested that a pricing system should also reward stages in the innovativeprocess –’innovation in itself’ – over and above clinically beneficial outcomes. In practice, thiswould mean that a pricing scheme would recognise, in prices, any drug making a major stepforward in treating a serious disease 62 (for example by pioneering the pharmacologicalmechanism) even if it were ultimately ineffective (or at least no more effective thanalternatives) and subsequent technological leaps were required before a clinically usefulproduct could be achievable.5.69 However, it is unlikely to be possible to define any meaningful pricing system that couldaddress this problem. Such a system would call for a great number <strong>of</strong> discretionary awardsbased on suppositions about companies’ chances <strong>of</strong> success against many – potentiallyesoteric – scientific challenges with no clinical outcomes. It would therefore not only beinefficient for the NHS to spend money on ineffective drugs that could be allocated t<strong>of</strong>und proven medicines for patients with other conditions, it would also fail to providetransparent, clear investment incentives to companies.Which comparator to use?5.70 A key question under any assessment <strong>of</strong> cost effectiveness is which comparator to use forestablishing the ICER <strong>of</strong> a drug. Under current arrangements, NICE, SMC and AWMSGdefine the relevant comparator as the (currently) best available treatment. In practice this maymean, depending on the drug in question, comparing it to the most clinically or cost effectiveavailable treatment or the most widely used treatment (that is, the marginal treatment thatwould be displaced by the new drug).5.71 Some stakeholders in industry have expressed to us the view that on-patent brands shouldnot be compared with generics in considering cost effectiveness, as this will reduceincentives to invest in new drugs. We do not agree with this position. In our view, given thelimited resources the NHS has at its disposable, it cannot afford, on grounds <strong>of</strong> both60 Again, whether and how to include them in the benefits taken into account in cost effectiveness assessments could beone <strong>of</strong> the high-level questions about a value-based PPRS to be agreed during periodic renegotiations <strong>of</strong> the scheme.61 <strong>The</strong> benefits to carers included information on carer psychological well-being from the General Health Questionnaire(GHQ-30). (Clinical and cost effectiveness <strong>of</strong> donepezil, rivastigmine and galantamine for Alzheimer’s disease, NICE HealthTechnology Appraisal TA091, Guidance on drugs for Alzheimer’s disease: HTA Report, 2001.)62 <strong>The</strong> following arguments can also apply to other aspects <strong>of</strong> pharmaceutical innovation. For example, research into newdelivery mechanisms or storage solutions for drugs can be very valuable over time.81
<strong>The</strong> <strong>Pharmaceutical</strong> <strong>Price</strong> <strong>Regulation</strong> <strong>Scheme</strong>efficiency and fairness to patients, to ignore relevant comparators on the grounds that theyare ‘too cost effective’. If the best available treatment is a generic, then new treatmentsmust demonstrate their benefits in relation to the generic to receive higher prices. In the longrun, we agree this will have effects on incentives to invest, but we believe they will beentirely positive, encouraging companies to target areas <strong>of</strong> unmet clinical need. Companiesare given at least 12 years notice <strong>of</strong> a product going <strong>of</strong>f patent and should be able to targettheir development activities accordingly.5.72 However, we recognise that in practice there may be merit in allowing for some differencebetween the price <strong>of</strong> a brand and its generic comparator (over and above that suggested bydifferences in the clinical benefits <strong>of</strong> the two). <strong>The</strong>re are two reasons for this. First, differentdrugs may have differential benefits for certain types <strong>of</strong> patient in ways that have not beendemonstrated in clinical trials and formal cost effectiveness analysis – for example becauseeffects occur in subgroups that are too small to be considered significant in broad populationtrials. Second, it may be desirable to maintain some form <strong>of</strong> wedge between the price <strong>of</strong> abrand and a generic to encourage continued generic prescribing, thus producing volumessufficient to sustain vibrant competition in generics markets. This wedge – which we call a‘brand premium’ – is discussed in greater detail in the box below.Box 5.1: Brand premiumIt may be desirable to allow a price premium for a brand over a generic comparator even ifno benefits <strong>of</strong> the former over the latter have been demonstrated. This price premium – whichwe call a ‘brand premium’ – can be motivated by two considerations: to capture potentialbenefits to patients that have not been demonstrated formally in trials; and to sustain the stability<strong>of</strong> the generics market.In relation to the first motivation, the highest-grade evidence on medicines is provided byRandomised Controlled Trials (RCTs) that control strictly for factors other than an investigatedproduct that might explain observed therapeutic effects. To have statistical power RCTs need tobe large – and potentially expensive and time-consuming. In some cases, an RCT may show nosignificant difference between two products when used in large populations, but individualpatients may not tolerate one whilst thriving on another.If an on-patent brand <strong>of</strong>fers potential but unproven benefits beyond a comparator productavailable generically it may be appropriate to negotiate a brand premium. Any such premiumwould need to be proportionate, recognising that benefits have not been demonstrated, but aremerely plausible. Later in this discussion – as well in Annexe M <strong>of</strong> this report that quantifiessome <strong>of</strong> the potential benefits <strong>of</strong> value-based reforms to the PPRS – we suggest that premia <strong>of</strong>50 per cent over the cost <strong>of</strong> comparable generics might be applied to a number <strong>of</strong> on-patentbranded drugs. This practice has been used in other countries – for example, in its reviews <strong>of</strong>therapeutic groups, the Swedish pricing authority LFN has allowed for a premium <strong>of</strong> 25 per centbetween clinically equivalent products (such as the PPIs) to reflect the benefits <strong>of</strong> having avariety <strong>of</strong> products on the market.In relation to the second motivation, if a brand with potential but unproven benefits over acomparator generic were priced at parity with that comparator clinicians may switch prescribingto the brand in large volumes – possibly even larger than strictly required for medical reasons, forexample due to clinical conservatism – which could destabilise production and consequentlyprices in the generics market, which are set partly by the interaction <strong>of</strong> supply and demand. 6363 Annexe A on competition in the NHS describes the Category M mechanism in some detail.82
February 2007Because UK generics markets currently work well, and because generics prices are the mostappropriate anchor for the prices <strong>of</strong> many branded drugs, it is important not to destabilise them.Applying a premium to brands should help to sustain this.In practice, the level <strong>of</strong> the wedge would likely be negotiated by the relevant pricing authorityand possibly informed by the views <strong>of</strong> the relevant cost effectiveness body concerning theplausibility <strong>of</strong> potential therapeutic benefits <strong>of</strong> the brand. This implies that the brand premium foran <strong>of</strong>f-patent brand in relation to its generic equivalent (with the same active substance) wouldbe lower – the only motivation for the premium at all is generic market stability. Accordingly, inour indicative estimates <strong>of</strong> savings from changes to the reimbursement arrangements for <strong>of</strong>fpatentbrands, we use a brand premium <strong>of</strong> 25 per cent.5.73 <strong>The</strong> operation <strong>of</strong> brand and value-based premiums is shown in the figures below. In the firstexample, product A is assessed to deliver 1.5 QALYs more than the comparator for a givenvolume <strong>of</strong> treatment. This is used to establish a maximum price. In this example, themanufacturer <strong>of</strong> product A sets a price below this maximum threshold.Figure 5.1: Value-based premiumppAIncremental benefitrelative to comparatorproduct A = 1.5 QALYdefines price thresholdApOcomparator5.74 In the second example, product B is considered to deliver the same benefits as the genericcomparator but may still price up to a maximum price <strong>of</strong> the generic comparator plus thebrand premium.83
<strong>The</strong> <strong>Pharmaceutical</strong> <strong>Price</strong> <strong>Regulation</strong> <strong>Scheme</strong>Figure 5.2: Brand premiumpIncremental benefitrelative to comparatorproduct B = 0 QALYBrand premiumdefines price thresholdpBbrand premiumBpOcomparator<strong>Price</strong> structure5.75 A second important consideration – which is relevant whether or not a value-based pricingapproach is adopted – is how to set the structure <strong>of</strong> prices. Currently, prices for reimbursingdrugs in primary care are generally linear across volumes prescribed. That is, if one pack <strong>of</strong>drugs <strong>of</strong> a given form and strength is reimbursed at £1, then 1000 packs <strong>of</strong> the same drug atthe same form and strength will be reimbursed at a total cost <strong>of</strong> £1000. 645.76 In the pharmaceutical sector, linear pricing may not be efficient on two counts:• pharmaceutical company costs are not linear across volumes supplied, and• the value drugs bring to the NHS is <strong>of</strong>ten not linear across volumes prescribed.5.77 In this section we consider each <strong>of</strong> these issues in turn before assessing the potentialbenefits <strong>of</strong> non-linear price structures. <strong>The</strong>se benefits include improvements in short runefficiency, through better alignment <strong>of</strong> the interests <strong>of</strong> the NHS and companies and thereduction <strong>of</strong> socially wasteful expenditure. Non-linear pricing can also improve long runefficiency, particularly given the potential for parallel trade both within and across countries,through ensuring rents are shared exclusively between companies and public purchasers andallowing price differences to be maintained between countries with different abilities to payfor drugs.64 It is not the case that prices are always linear in strengths (sometimes different strengths <strong>of</strong> the same drug will be flatpriced). Nor are prices likely to be linear across volumes in secondary care, where, as described in Annexe A,procurement arrangements can secure price / volume deals.84
February 2007Benefits to the NHS are not linear5.78 <strong>The</strong>rapeutic value can vary significantly across different indications and patient groups. Forexample, a drug could be the most effective chemical in its class for most people butunacceptably dangerous in patients with other conditions or in combination with certain othermedicines. Or it could be usually less effective than some alternative but the alternative mayhave no effect in some genetic types where the drug does. Or a drug could have sufficientlyharmful side-effects in all patients that it is only recommended in high-risk cases.5.79 Since the benefits <strong>of</strong> drugs are not constant over all volumes dispensed, nonlinear pricestructures could help improve value for money for certain drugs, by ensuring that premiumprices are paid only on prescribing volumes that are likely to be clinically relevant.5.80 For many drugs, nonlinear prices could also reduce incentives to incur socially inefficientmarketing expenditure. Under current linear prices, there can be very high returns tomarketing because the marginal cost <strong>of</strong> products is typically low and marginal revenues areconstant. This can give very strong incentives for companies to market products outside <strong>of</strong>their cost effective indications.5.81 Concern is <strong>of</strong>ten expressed within the NHS about the amount <strong>of</strong> money pharmaceuticalcompanies spend on marketing their products. <strong>The</strong> sums involved are certainly considerable:in 2004, companies that submitted an Annual Financial Return (AFR) spent a total <strong>of</strong> £850mon marketing and sales promotion in the UK (16 per cent <strong>of</strong> total drug sales value).In response various stakeholders have called for an increase in NHS expenditure on so-called‘counter-marketing’, for example, the advice given by prescribing advisers to GPs on the costeffectiveness <strong>of</strong> medicines.5.82 Others have called for measures directly to curb marketing expenditure by pharmaceuticalcompanies. As noted earlier, we do not consider this to be the best form <strong>of</strong> response, for all theseapproaches fail to address the root cause <strong>of</strong> high levels <strong>of</strong> marketing expenditure: the fact thatlinear prices give companies very strong incentives to maximise volumes, beyond the point atwhich prescribing is likely to be cost effective for the NHS.5.83 Companies are simply responding to the financial incentives they are being given. If the NHSwants to reduce potentially wasteful expenditure, it should give better incentives tocompanies, through the prices it is prepared to pay for drugs, to engage in activities thatmaximise NHS productivity. This in turn should generate cost efficiencies for the companies.Methods for implementing non-linear prices5.84 In principle, it would be possible to implement non-linear pricing by reimbursing pharmaciesat different prices for dispensing drugs against different indications and for different patientsubgroups. To be implementable, this approach would, however, require the availability <strong>of</strong>prescribing data broken down by indication and patient group. <strong>The</strong> provision <strong>of</strong> prescribingdata by indication is one <strong>of</strong> the objectives <strong>of</strong> the ongoing NHS National Program for IT (NPfIT)and may arrive within five years. Disaggregated data may arrive sooner in Scotland throughthe Community Health Index (CHI). Such disaggregated prescription data are not currentlyavailable, however, and so this approach is not a viable short term option.5.85 In the absence <strong>of</strong> such information, it would be necessary to estimate up front annualprescription volumes for given indications and patient subgroups for which cost effectiveness85
<strong>The</strong> <strong>Pharmaceutical</strong> <strong>Price</strong> <strong>Regulation</strong> <strong>Scheme</strong>is likely to differ and then apply different prices to given prescribing volumes accordingly.For example, if a drug was found to be more effective than a comparator in only oneindication, and the upper bound estimate <strong>of</strong> prescriptions against that indication was 10,000packs <strong>of</strong> a given strength per year, a premium price would apply to volumes up to 10,000 anda price in line with the comparator for volumes in excess <strong>of</strong> that.5.86 Estimates <strong>of</strong> relevant volumes would be challenging to produce up front. Companies musttherefore be given appropriate incentives and support to demonstrate the cost effectiveness<strong>of</strong> drugs in different indications and subgroups. Value-based pricing would provide thoseincentives. <strong>The</strong> support companies would require has been set out in the Cooksey Reviewdiscussed at the end <strong>of</strong> this Chapter.5.87 We also recognise that under a volume-based approach to nonlinear pricing there would beno guarantee that the drug would always be prescribed in the most cost effective indications.Guidance to prescribers will therefore remain an important part <strong>of</strong> any revised pricingarrangements.5.88 <strong>The</strong>re are two options for implementing volume-based approaches to nonlinear pricing:• negotiate price volume agreements, whereby the reimbursement price changes after acertain volume <strong>of</strong> prescriptions is exceeded, and• negotiate rebate arrangements, whereby a payment is made between companies andpayers after a certain volume <strong>of</strong> prescriptions is exceeded.5.89 <strong>The</strong> difference between the first and second options – price volume agreements and rebates– is that under the first, the price would change after the relevant volumes had beenexceeded whereas under the second the price would be unchanged but a rebate would bemade between the company and the payer (in practice likely to be DH, but this could becredited to PCTs on a pro rata basis).5.90 As discussed in Annexe K, many countries employ approaches <strong>of</strong> this type, such as France,Australia and the US. Indeed, there is a precedent for rebate-type arrangements in the UK.Companies are able, for example to make a payment to DH in lieu <strong>of</strong> implementing theperiodic price cuts negotiated through the scheme.5.91 We think the second option – rebate arrangements – would be the most tractable and istherefore to be preferred. This is because applying different reimbursement prices for thesame product (form, pack size and strength) would create significant difficulties in the supplychain. It would not be clear, for example, at what price a manufacturer should sell to anygiven pharmacy. If the sales price were related to the higher ‘premium’ reimbursement price,the pharmacy would be at risk <strong>of</strong> not recovering its costs (if it happened to dispense productsat a time in the year in which the maximum premium volume had been exceeded). Similarly ifthe sales price were related to the lower reimbursement price, the pharmacy might overrecover if it dispensed products before the threshold had been exceeded. Differential priceswould also create the possibility <strong>of</strong> parallel trade within the UK.5.92 Supply chain stability and parallel trade considerations are also directly relevant whenconsidering the effect <strong>of</strong> differential prices across the EU. We think that here too there is astrong argument for allowing for a rebate system, in which the list price might differ from thevalue-based price paid by the Health Service. We discuss these issues in the next section.86
February 2007Nonlinear prices and parallel trade5.93 Parallel-traders legally exploit price differences in identical products between differentcountries when they are sufficiently large to cover transport costs and earn a pr<strong>of</strong>it. In thepharmaceutical sector, the price differentials that sustain parallel trade are caused by theinteraction <strong>of</strong> two factors:• the pricing systems set by individual countries, and• pharmaceutical companies’ willingness to price-discriminate between different marketsin order to maximise pr<strong>of</strong>it.5.94 Companies operate within a system where individual countries operate national pricingregimes. Companies that have market power, and for which a high proportion <strong>of</strong> the costs <strong>of</strong>supply are fixed, can price discriminate by charging higher mark ups above marginal cost tothe most price-insensitive buyers. 65 In the context <strong>of</strong> the pharmaceutical industry, this impliescharging different prices in each country. This form <strong>of</strong> price discrimination can be welfareenhancing(over the alternative <strong>of</strong> a single price) for a number <strong>of</strong> reasons:• consumers who would not be able to buy drugs at a uniform price are able to do sounder price discrimination, resulting in an expansion <strong>of</strong> output and an increase inwelfare, and• firms have greater dynamic incentives to invest. Higher pr<strong>of</strong>its will provide greaterincentives for firms to develop new drugs. In the pharmaceutical industry, where a highproportion <strong>of</strong> the costs are in R&D, this is particularly important.5.95 Different prices also reflect the varying pricing regimes applying in different countries. In thepharmaceutical sector poorer countries tend to be more price-sensitive (that is, they are morelikely to forgo drugs on the basis that they cannot afford them). In this context, pricediscrimination can have positive implications for equity.5.96 While parallel trade may provide short term benefits to high priced countries, it is also likelyto prevent firms from exercising price discrimination effectively. With untrammelled paralleltrade, pharmaceutical companies may be restricted to charging a uniform price at whichsome countries – most likely the poorest – will be unable to buy their products. Moreover,since parallel traders incur costs and earn pr<strong>of</strong>its from their activities, they reduce returns ondrugs, undermining incentives to invest.5.97 To sum up, on a global (EU) level, parallel trade in pharmaceuticals may reduce efficiency,both statically and dynamically, as the allocative benefits <strong>of</strong> price discrimination andincentives for innovation are reduced.5.98 In the short term, parallel trading may provide savings for consumers (typically publicpurchasers) in higher price markets as a result <strong>of</strong> the lowering <strong>of</strong> prices. This may be broughtabout both as a direct result <strong>of</strong> the purchasing <strong>of</strong> parallel imported drugs (which will becheaper), and by the effect that the increase in competition in the markets for these drugs hason the pharmaceutical manufacturer’s pricing for domestically sourced products. In the UK, DHattempts to identify the savings made by pharmacies on parallel trade through the periodicMargin Inquiry. It then operates a clawback system whereby some <strong>of</strong> the savings made bypharmacies from the buying <strong>of</strong> parallel imported products are recovered by the NHS.65 In order to maximise pr<strong>of</strong>its, they should set the mark up proportional to the inverse <strong>of</strong> the price elasticity <strong>of</strong> demand(‘Ramsey pricing’). <strong>The</strong>refore, less price-sensitive buyers will be charged higher mark ups.87
<strong>The</strong> <strong>Pharmaceutical</strong> <strong>Price</strong> <strong>Regulation</strong> <strong>Scheme</strong>5.99 An important issue in assessing the size <strong>of</strong> this effect is identifying to whom benefits accrue.Two studies (one by economists at York, and the other by economists at LSE) 66 appear todisagree over the proportion <strong>of</strong> benefits accruing to public health bodies in certain EUcountries. <strong>The</strong> LSE study identifies parallel traders as the major beneficiaries, whilst the Yorkstudy only estimates the benefits for governments and consumers. <strong>The</strong> evidence doessuggest that there are some savings to national healthcare providers from parallel imports,although they may be relatively modest (approx £100m (1.5 per cent <strong>of</strong> sales) for the UK in2002, see Annexe J).5.100 However, it seems clear that there will always be an element <strong>of</strong> loss to the system – thecosts incurred and pr<strong>of</strong>its earned by parallel traders. <strong>The</strong>refore, pricing systems (such asthose based on rebates) that take account <strong>of</strong> parallel trade effects may <strong>of</strong>fer a win / winoutcome for industry and government – by encouraging industry to accept a higher price cutthan would otherwise be the case and ensuring the benefits are shared exclusively betweenindustry and the public purchaser.5.101 It should be stressed that this conclusion is particular to the pharmaceutical sector. Thisarises from the characteristics discussed above, in particular the cost structure <strong>of</strong> the sectorand the fact that member states actively control drug pricing regimes. <strong>The</strong>refore there can beno read through from this analysis to the effects <strong>of</strong> parallel trade in other sectors.5.102 Furthermore, it should be stressed that nothing in this analysis suggests that measures torestrict parallel trade in the pharmaceuticals sector are necessarily consistent with competitionlaw. <strong>The</strong> effects <strong>of</strong> any individual practice need to be assessed on a case by case basis.5.103 Our conclusion, rather, is this: that, in designing and implementing a pharmaceutical pricingscheme it is not beholden on either public purchasers or manufacturers to ensure thatsufficient price differences across Europe are maintained to sustain an industry designed toarbitrage against those differences. <strong>The</strong> option <strong>of</strong> allowing rebates to be paid in lieu <strong>of</strong>changing prices can in principle be in the interests <strong>of</strong> both payers and manufacturersand therefore benefit patients in the long run.5.104 Under such an approach, where value-based pricing led to large price reductions, companieswould have the option <strong>of</strong> retaining the existing reimbursement price and paying a rebate tothe NHS equal to the difference between this price and the value-based price.Setting the level <strong>of</strong> prices / size <strong>of</strong> the budget5.105 <strong>The</strong>re are two broad approaches by which price levels can be determined. Either prices canbe fixed in advance and the budget determined ex post or (less commonly) the drugs budgetcan be fixed in advance and prices determined ex post. <strong>The</strong>se different approaches can betermed ‘fixed price’ and ‘fixed budget’ methods.5.106 A fixed price approach makes a fixed payment for each unit <strong>of</strong> output delivered by acompany. Under a value-based approach to pricing, a fixed (maximum) price would be paid foreach unit <strong>of</strong> incremental value delivered by a drug. <strong>The</strong> concept discussed earlier in this66 West, P. and J. Mahon (2003). Benefits to Payers and Patients from Parallel Trade, York Health Economics Consortium,York, May. Kanavos, P, Costa-i-Font, J, Merkur, S, Gemmill M. (2004) <strong>The</strong> Economic Impact <strong>of</strong> <strong>Pharmaceutical</strong> ParallelTrade in European Union Member States: A Stakeholder Analysis, LSE Health and Social Care, London School <strong>of</strong>Economics and Political Science88
February 2007chapter <strong>of</strong> a maximum acceptable ICER – expressed in terms <strong>of</strong> a cost per incremental QALY– is an example <strong>of</strong> a fixed price approach. Under this approach, the budget is derived eachyear according to volumes prescribed and the price assigned to each drug.5.107 Fixed budget methods set the drugs budget in advance and derive prices actually paid expost, at the end <strong>of</strong> the budgetary year. <strong>The</strong> simplest way <strong>of</strong> doing this would be to requirepayments to be made between the NHS and individual companies at the end <strong>of</strong> the year todeliver the amount <strong>of</strong> expenditure fixed in advance. If, for example, the budget wasunderspent, the NHS would make a payment at the end <strong>of</strong> the year, which would bedistributed to companies on a pro rata basis. If the budget was overspent, companies wouldbe required to make a payment to the NHS, again in accordance with revenues received inthe course <strong>of</strong> the year.5.108 Fixed price approaches are more common around the world. <strong>The</strong> current approach to pricingin the UK would fall into this category, for example. <strong>The</strong>re are some examples <strong>of</strong> fixed budgetapproaches, however. New Zealand is perhaps the clearest example, as the drugs budget isfixed each year and Pharmac negotiates various deals (such as price-volume arrangements)with suppliers on all medicines so as not to breach it. <strong>The</strong>re is a statutory requirement not toexceed the budget and in practice expenditure is consistently slightly below the maximumeach year. France uses a hybrid <strong>of</strong> both methods. Annual drugs budgets are voted byparliament, suggesting that the overarching principle is a fixed budget. In practice, however,the regime relies on a fixed-payment approach, setting the prices <strong>of</strong> many drugs in areasonably formulaic way according to an assessment <strong>of</strong> their incremental benefits overclose therapeutic substitutes, with the result that the drugs budget <strong>of</strong>ten overruns.5.109 <strong>The</strong> two options are perhaps best assessed in terms <strong>of</strong> their effects on the allocation <strong>of</strong> risksbetween companies and the NHS. A fixed budget approach would help the NHS managefinancial risks, by fixing a major component <strong>of</strong> expenditure. For industry, this approach wouldalso create certainty over aggregate expenditure. Individual companies, however, would beexposed to the sorts <strong>of</strong> risks to which the broader NHS is currently exposed. For example,their revenues would be reduced (rather than NHS expenditure increased) by the introduction(by a rival company) <strong>of</strong> a major, new life saving treatment onto the market, while theirrevenues would increase (as opposed to NHS expenditure falling) if the large selling drug <strong>of</strong> acompetitor went <strong>of</strong>f patent.5.110 Since fixed budget arrangements constrain total expenditure, they also have the potential toincrease competitive pressures between suppliers. If manufacturers <strong>of</strong> branded drugs wererewarded from a single, fixed budget according to the share <strong>of</strong> health benefits their productsprovided, drugs for different conditions would compete more explicitly for public funding. Thismay in turn change the terms <strong>of</strong> the debate about how pharmaceutical products are paid forby the NHS.5.111 Decisions by bodies such as NICE would become less contentious, as they would be calledupon to determine what proportion <strong>of</strong> the fixed budget companies would receive. <strong>The</strong> NHSwould have fewer incentives than at present to apply volume controls to restrict expenditure,since under a fixed budget pricing scheme all drugs would be funded but the question wouldbe at what price. 67 8967 As Annexe A discusses, while under current arrangements NAS are (more or less) freely priced, the NHS employs anumber <strong>of</strong> demand-side controls in an attempt to restrict expenditure, including rationing or withholding them entirely insome cases.
<strong>The</strong> <strong>Pharmaceutical</strong> <strong>Price</strong> <strong>Regulation</strong> <strong>Scheme</strong>5.112 <strong>The</strong>se outcomes are potentially very attractive from an NHS perspective. <strong>The</strong> disadvantage <strong>of</strong>the approach is that hypothecating drugs expenditure in this way would restrict the flexibility<strong>of</strong> PCTs to shift resources from drug expenditure to other types <strong>of</strong> expenditure (such as thaton elective care in hospitals) and vice versa. <strong>The</strong>refore it would dampen any competitiveconstraints drug and non-drug interventions impose on each other. We also detected littleappetite for a fixed budget approach among most <strong>of</strong> the companies we spoke to althoughthis is perhaps in part due to the fact that countries that have adopted variants <strong>of</strong> the fixedbudget approach have tended also to have secured low prices – New Zealand being anobvious example. 68 In principle, <strong>of</strong> course, a fixed budget approach would be consistent withany overall level <strong>of</strong> expenditure.5.113 We think either approach – fixed prices or fixed budget – could be made to work in the UK.We think there is particular merit in considering the fixed budget approach, for thereasons discussed above. We note, however, that the approach would represent a greaterdeparture from current arrangements and that the experience <strong>of</strong> drug budgets in the UK inthe past suggests that keeping to a fixed budget can be difficult to achieve in practice. Whilewe believe the approach set out above would be perfectly possible to implement, it wouldperhaps require a wider ranging reform <strong>of</strong> NHS funding arrangements and may only be a longterm option.Institutions5.114 Institutional design is key to any reform <strong>of</strong> pricing arrangements. Institutions must work welland be seen to work well, inspiring confidence in key stakeholders. Stakeholder interactionswould be most frequent with pharmaceutical manufacturers, whose goodwill would be critical.In any value-based system, there will be ‘winners’ and ‘losers’ among individual drugs.Companies would only accept this when decisions were clearly reasoned and issued byauthorities with a reputation for fairness in the application <strong>of</strong> rules, and appropriate flexibility.5.115 Chapter 6 <strong>of</strong> this report gives our view as to how new and existing institutions mightimplement a value-based approach to pricing.Comparison <strong>of</strong> Options two and three5.116 <strong>The</strong> key difference between Options two and three is clearly the requirement for a pricenegotiation before a drug comes onto the market under the ex ante approach. This isimportant on a number <strong>of</strong> fronts.Speed <strong>of</strong> access and uptake5.117 Option two retains the benefit manufacturers enjoy under the current PPRS <strong>of</strong> ensuring rapidaccess to the market for pharmaceutical products. As noted, it is the freedom <strong>of</strong> pricingafforded by PPRS that is one <strong>of</strong> the most positive aspects <strong>of</strong> the system in the eyes <strong>of</strong>industry. Most manufacturers we spoke to therefore expressed a preference for ex post asopposed to ex ante approaches to pricing. <strong>The</strong>re is some evidence, set out in Annexe D, thatdrugs come onto the market more rapidly in the UK than in other countries and this is likelyto be partly the result <strong>of</strong> the liberal ex ante pricing regime in the UK.68 An exception was a suggestion put to us by several companies that resources for drugs that have received NICEapprovals should be hypothecated within PCTs for use only on those drugs.90
February 20075.118 However, a further argument that has been put to us is that, for certain types <strong>of</strong> drugs, an upfront assessment demonstrating the drug is cost effective can have a positive effect onuptake. As discussed in Annexe B, there is evidence to suggest that positiverecommendations from NICE can increase uptake <strong>of</strong> drugs, and therefore that, in theabsence <strong>of</strong> an assessment, uptake would be lower. This suggests that for such drugs therewould be a real benefit – for patients and companies – in securing an early-stageassessment. It is worth noting that an example <strong>of</strong> a company that did express a preferencefor some form <strong>of</strong> ex ante assessment was one that operated predominantly in the secondarycare sector, where NICE guidance may have the greatest impact.5.119 Ex ante pricing clearly involves a robust estimate <strong>of</strong> cost effectiveness to be available at thetime <strong>of</strong> launch. Drugs for acute conditions, in which final endpoints are observed over arelatively short period <strong>of</strong> time, would be natural candidates for such an approach. For manymedicines prescribed for small groups <strong>of</strong> patients in hospital settings – such as an increasingnumber <strong>of</strong> modern cancer therapies targeted at specific genetic types – clinical trials availableat launch may give a reasonably accurate picture <strong>of</strong> true clinical efficacy. <strong>The</strong> controlledconditions <strong>of</strong> trials, where patients are treated under constant supervision and followed upclosely, resemble those in which some hospital drugs are used in practice.Bargaining and risk5.120 Whether drugs are assessed before they come onto the market or after has a potentiallysignificant effect on the bargaining position <strong>of</strong> payers and companies. Under an ex postapproach, the bargaining position <strong>of</strong> the payer would be weaker than under an ex anteapproach. This is because the ultimate sanction <strong>of</strong> any payer – that <strong>of</strong> withdrawingreimbursement – would be a less credible threat once a drug is already on the market, as it ismore difficult to withdraw reimbursement for a product currently being prescribed (due topatient habituation) than to refuse it for new products. It may therefore be necessary toresort to statutory provisions to ensure maximum prices are adhered to in practice.5.121 Conversely, under an ex ante approach companies would be exposed to a greater extent torisks <strong>of</strong> delaying tactics by payers, who might wish to prolong negotiations simply to have toavoid paying for a product. Institutional design would be key, here, to ensure that the bodymaking these assessments had no such incentives.Efficiency5.122 <strong>The</strong> main advantage <strong>of</strong> ex ante as opposed to ex post approaches is that the benefits <strong>of</strong> morevalue-reflective prices will be felt by the NHS at all stages in a drug’s commercialisation and,for positive assessments, it should help ensure predictable uptake for manufacturers. Benefitsin terms <strong>of</strong> value for money and improved investment incentives would be enhanced.5.123 As noted, the onus on institutions carrying out assessments to be competent, fair and carryout their assessments rapidly would be greater, but if this can be achieved the outcomeshould be mutually beneficial for the NHS and innovative companies alike.Risk sharing5.124 Perhaps the most novel feature <strong>of</strong> the ex ante approach is the facility to negotiate risksharing contracts, which are in a sense a hybrid <strong>of</strong> ex ante and ex post approaches. Weshould note that these would only be used in a limited number <strong>of</strong> cases – where there isgenuine doubt about the efficacy <strong>of</strong> a drug and reasonable expectations that uncertainty canbe addressed within a reasonable timescale.91
<strong>The</strong> <strong>Pharmaceutical</strong> <strong>Price</strong> <strong>Regulation</strong> <strong>Scheme</strong>5.125 Risk sharing arrangements can in principle help coordinate the expectations <strong>of</strong> the payer andmanufacturers. <strong>The</strong>y may allow for more predictable uptake for manufacturers, andpredictable health gains for a given expenditure for the NHS for drugs for which anagreement may not be able to be reached otherwise. <strong>The</strong>re is, however, a question as towhether the use <strong>of</strong> contracts would be overly burdensome to agree and audit, given theinformation and resource constraints.5.126 <strong>The</strong>se challenges are real and will in many cases mean that risk sharing approaches are notsuitable. While risk sharing is attractive in principle, we cannot ignore the fact that theexperience <strong>of</strong> risk sharing in the UK to date has been problematic. <strong>The</strong> example <strong>of</strong> theGovernment’s risk sharing scheme for beta interferon and glatiramer is discussed in Annexe L.5.127 Nevertheless, we believe that risk sharing is a potentially promising approach for the futurefor drugs where there is a plausible but unproven value proposition and there are reasonableprospects <strong>of</strong> data being available in the medium term to make a more thoroughdetermination. We understand one manufacturer has recently negotiated two risk sharingcontracts in France.Option four: local bargaining arrangements5.128 <strong>The</strong> previous options have considered reforms to the PPRS that would retain the scheme buteither modify the pr<strong>of</strong>it cap and price cuts, in the case <strong>of</strong> option one, or replace thosemechanisms with more value-based alternatives in the case <strong>of</strong> options two and three. <strong>The</strong>remaining alternative we have considered is to remove the PPRS entirely.5.129 Removing the PPRS was explored in discussions during the 1990s including the 1998/99negotiations that preceded the 1999 scheme. <strong>The</strong>se discussions led to a joint assessment byDH and ABPI <strong>of</strong> the scope, pace <strong>of</strong> change and practical impact <strong>of</strong> competition in the supplyand use <strong>of</strong> branded medicines for the NHS. This assessment was unable to find evidence <strong>of</strong>consistent volume responses to price changes, suggesting that – in the absence <strong>of</strong> othermeasures – pharmaceutical companies would not have strong incentives to constrain the listprices charged for branded drugs. We do not believe the position has changed significantlysince then.5.130 This evidence, and the significant evidence <strong>of</strong> cost ineffective prescribing, persuade us thatthere is a continued need for instruments to ensure that the NHS obtains value for money inits purchases. As noted elsewhere in this report, we view this desire on the part <strong>of</strong> acustomer to secure value for money as a necessary feature <strong>of</strong> competition, and not as a form<strong>of</strong> regulation. 69 Consequently, we do not regard removing a national level demand sideinstrument such as the PPRS as in itself a deregulatory measure. Those who have called for‘deregulation’ appear to be calling for price negotiations at a more local level to substitute fornational level instruments.5.131 We therefore felt it was important to explore what sort <strong>of</strong> outcomes might be producedthrough local-level instruments substituting for national level instruments. Thus, in thissection we consider an option for reform involving primary care organisations (PCOs)negotiating primary care prices with the suppliers <strong>of</strong> branded drugs. We recognise that, sincethis represents the most radical <strong>of</strong> the reform options, our considerations <strong>of</strong> its outcomes arenecessarily more speculative.69 <strong>The</strong> health service is no different. In every country we examined in our international case studies – including the UnitedStates – we found that payers negotiated strongly with companies over the prices they pay.92
February 20075.132 This option would require PCOs to negotiate prices with manufacturers. <strong>The</strong>re is uncertaintyboth about whether this option could be implemented in practice (it would require each PCOto negotiate secret repayments with manufacturers) and about the outcome if it can beimplemented.5.133 <strong>Price</strong> levels would depend on PCOs’ bargaining strength which depends on their influenceover prescribing decisions and is highly uncertain.• if PCOs have little influence over prescribing decisions, prices are likely to be higher thanunder other options to the detriment <strong>of</strong> the NHS, and• if PCOs have a lot <strong>of</strong> influence, effective negotiation could push prices very low, butsuch prices might be below the level that provides a reasonable return on R&Dinvestments by pharmaceutical companies.5.134 We note that there is considerable uncertainty regarding outcomes under this approach. Inthe future, with a significantly reorganised NHS, it may become more attractive. But thiswould require major change in the institutions <strong>of</strong> the NHS and is not a near term prospect.Evaluation <strong>of</strong> options5.135 Each <strong>of</strong> the value-based approaches – Options two and three – for reforming the PPRSpresented above has particular strengths and weaknesses. However, in our opinion the bestlong-term arrangement for the UK would be Option three: to replace PPRS pr<strong>of</strong>itcontrols and price cuts with an ex ante value-based approach to pricing. Under thisapproach, if, at the time <strong>of</strong> launch, trials data supported the value proposition <strong>of</strong> the company,a fast track pricing decision would be reached. <strong>The</strong>re would still be a need for five yearly expost reviews <strong>of</strong> such drugs, largely to take account <strong>of</strong> comparators going <strong>of</strong>f patent. Wheresufficient information was not available at the time <strong>of</strong> launch, but there was a prospect <strong>of</strong> itbeing developed after a period <strong>of</strong> use in clinical practice, a risk sharing contract could beagreed. This would only be in a minority <strong>of</strong> cases.Overview5.136 We consider Option four to be the most speculative <strong>of</strong> the options for reforming the PPRS.<strong>The</strong>re is uncertainty both about whether this option could be implemented in practice andabout the outcome if it could be implemented. <strong>Price</strong> levels would depend on PCOs’bargaining strength which depends on their influence over prescribing decisions and is highlyuncertain. If PCOs had little influence over prescribing decisions, prices would be higher thanunder other options to the detriment <strong>of</strong> the NHS. To be feasible, the option would requireconsiderable organisational change and is not a near term prospect.5.137 In relation to Option one, we have considered a range <strong>of</strong> potential options for modifying theexisting instruments <strong>of</strong> the PPRS. We considered that there is limited potential forincremental change to company level price cuts (beyond the changes that would arise fromremoving <strong>of</strong>f-patent brands from price modulation).5.138 We think the case for replacing price cuts with a more binding pr<strong>of</strong>it control is weak. We donot think a binding control is feasible for the majority <strong>of</strong> companies that use resale minustransfer prices, without a very resource-intensive process <strong>of</strong> attempting to audit data oncosts incurred outside the UK. Still less would it be possible to identify an ‘efficient’ level <strong>of</strong>costs under such a scheme. If pr<strong>of</strong>it controls were more binding, the scheme wouldtherefore be more likely to suffer from the fundamental incentive problems associated withpr<strong>of</strong>it caps (namely, encouraging companies to inflate costs).93
<strong>The</strong> <strong>Pharmaceutical</strong> <strong>Price</strong> <strong>Regulation</strong> <strong>Scheme</strong>5.139 Despite its limitations the PPRS is sometimes said to have the advantage <strong>of</strong> stability.We agree that a stable regulatory environment is an important factor in investment decisionsfor a global industry. But we do not think that the PPRS as currently constituted guaranteessuch stability in the future. An important aspect <strong>of</strong> the PPRS that seems incompatible withstability is the increased emphasis on one-<strong>of</strong>f price cuts at the start <strong>of</strong> each new scheme.<strong>The</strong> trajectory <strong>of</strong> the price cuts has been rising – from 2.5 per cent in 1993, to 4.5 per cent in1999 and seven per cent in 2005. Moreover, price cuts necessarily have an element <strong>of</strong>arbitrariness since they apply to all branded drugs irrespective <strong>of</strong> therapeutic value, and arenot obviously related to external parameters.5.140 Since companies have freedom to set prices initially, the more price cuts become a regularfeature <strong>of</strong> PPRS, the more firms are likely to anticipate them in setting initial prices (at theoptimal price plus anticipated percentage price cut) particularly towards the end <strong>of</strong> a givenPPRS period. If this continues, price setting risks becoming a strategic game in which firmsattempt to guess the level <strong>of</strong> forthcoming price cuts and DH attempts to second guess thiseffect in setting the level <strong>of</strong> price cuts. We do not consider this to be a sustainable model <strong>of</strong>pricing for the future.5.141 In short, incremental changes to existing controls would not address our main concerns withthe existing PPRS – that neither the pr<strong>of</strong>it control nor the price cuts accounts for thetherapeutic value <strong>of</strong> the drugs they affect. As shown in Annexe M <strong>of</strong> this report, undercurrent arrangements, drugs that are close clinical substitutes can sometimes have widelydivergent prices. This does not represent value for money. Further, failing to reflect relativeclinical benefits in prices could also fail to give manufacturers the right incentives to invest.5.142 Other aspects <strong>of</strong> UK pharmaceuticals policy, such as the creation <strong>of</strong> NICE, SMC and AWMSGin part compensate for the fact that the PPRS is not value-reflective. While these bodies areregarded as highly expert in the assessment <strong>of</strong> clinical and cost effectiveness and have madea major contribution since their creation, we believe that the restricted remit they have beengiven limits the extent to which they can ensure resources are used cost effectively.5.143 <strong>The</strong>se restrictions relate, in brief, to: the inability to use cost effectiveness analysis to informprice setting directly; the uneven implementation <strong>of</strong> guidance; the fact that not all drugs areassessed; and the fact that existing drugs are not always subject to the same level <strong>of</strong>assessment as new drugs. <strong>The</strong>se considerations are set out in detail in Annexe B. OurOptions two and three are aimed at relaxing these restrictions.5.144 In short, we believe there is a compelling case for adopting a value-based approach topricing within the PPRS, as the best available means <strong>of</strong> delivering the high-level objectives<strong>of</strong> the scheme <strong>of</strong> securing value for money for the NHS whilst providing appropriateincentives for manufacturers to invest in beneficial drugs in the future.5.145 Many stakeholders have agreed that value-based pricing is attractive in principle but haveexpressed concerns that it would be costly and difficult to implement in practice. <strong>The</strong>y havealso highlighted the key importance <strong>of</strong> institutional design, given the central role any pricingbody would have under such an approach. In the remainder <strong>of</strong> this report, we address bothconcerns.5.146 First, in the rest <strong>of</strong> this chapter, we attempt to provide a high-level indication <strong>of</strong> the benefitsthat might be expected to accrue from value-based pricing and compare those with the costs<strong>of</strong> implementation. In the final chapter, we set out proposals for how new and existinginstitutions could implement our proposed options two and three in the short, medium andlong term.94
February 2007Costs and benefits <strong>of</strong> value-based pricing5.147 Value-based pricing can have positive short-run and long-run effects. In this section weexplore these effects in greater detail, considering first how inefficient prices can distortcompany investment decisions (long-run effects) and second how they can undermine valuefor money and exacerbate rationing in the NHS (short-run effects). We believe theseinefficiencies could in part be addressed by adopting a value-based approach to pricing.5.148 <strong>The</strong> following discussion seeks to capture the order <strong>of</strong> magnitude <strong>of</strong> possible costs andbenefits <strong>of</strong> value-based reforms to the PPRS, rather than providing a detailed account. Itbears noting, however, that the potential benefits are very large – in financial terms in boththe short and long run, and in clinical terms over the medium-to-long run. Benefits are <strong>of</strong> adifferent order <strong>of</strong> magnitude altogether to the costs.Benefits5.149 <strong>The</strong> most immediate benefits <strong>of</strong> adopting value-based mechanisms within the PPRS are setout in Annexe M. <strong>The</strong>y are potential efficiency savings from adjusting the current prices <strong>of</strong>certain on-patent branded medicines to be more in line with their clinical benefits relative toclose therapeutic substitutes available generically. <strong>The</strong>se efficiency savings, which could underan alternative scheme be reallocated to more prescribing <strong>of</strong> existing or future drugs, providean initial indication <strong>of</strong> some <strong>of</strong> the gains that could be achieved through value-based pricing.5.150 Substantial further gains may be available over the longer term because setting prices toreflect incremental therapeutic benefits delivered beyond existing medicines would influencemanufacturers’ incentives to invest in areas <strong>of</strong> unmet clinical need. As discussed below, theinfluence <strong>of</strong> UK prices on the investment decisions <strong>of</strong> the global pharmaceutical industryshould not be dismissed since the UK affects prices and demand in many other countriesthrough the mechanism <strong>of</strong> international reference pricing.5.151 <strong>The</strong> two tables below summarise efficiency savings from the initial exercise to quantify thebenefits <strong>of</strong> value-based pricing conducted in Annexe M. <strong>The</strong> first table shows potentialsavings on branded drugs where we believe that all current prescribing volumes would beefficiently reimbursed at prices nearer to the cost <strong>of</strong> closely substitutable generics.5.152 <strong>The</strong> second table shows savings on a class <strong>of</strong> branded drugs where we believe that onlysome current prescribing would be efficiently reimbursed at lower prices than today in orderto reflect clinical benefits delivered beyond next-best comparator medicines.5.153 As discussed in Annexe M, in order to generate the savings shown in both tables weconducted a review <strong>of</strong> publicly available information on the relative therapeutic efficacy <strong>of</strong>each branded product (or class) and generic comparator shown. We also took advice from apanel <strong>of</strong> clinicians, pharmacists and pharmacologists to help us interpret the published clinicaltrials. 70 In relation to the first table we concluded that there is little evidence <strong>of</strong> clinicalsuperiority for the brand(s) in most patients. However, the class <strong>of</strong> drugs in table 5.4 doesprovide significant incremental benefits beyond alternative chemicals available generically forsome patients.70 As noted in Annexe M, this analysis should not be considered advice to prescribers nor clinical guidance.95
<strong>The</strong> <strong>Pharmaceutical</strong> <strong>Price</strong> <strong>Regulation</strong> <strong>Scheme</strong>5.154 All savings calculations are based on a reimbursement <strong>of</strong> the brand at a rate 50 per centabove current generic prices (the ‘brand premium’). This is in recognition <strong>of</strong> potential clinicalbenefits that have not been formally demonstrated through randomised controlled trials(RCTs) and formal cost effectiveness analysis.Table 5.3: Savings from reimbursement changes, 2005 volumesProduct Comparator Generic price plus 50%Atorvastatin Simvastatin £352.0mRosuvastatin Simvastatin £28.0mProton Pump Inhibitors Omeprazole £91.5mLevocetirizine, Escitalopram Cetirizine, Citalopram £28.3mCardura XL® Doxazosin £10.9mTotal£510.7m5.155 Savings in Table 5.3 are calculated on the total UK primary care prescribing volumes across allpresentations <strong>of</strong> each brand shown (all branded chemicals in the class in the case <strong>of</strong> thePPIs). For each branded product, savings are estimated for each presentation by multiplying2005 volumes by the difference between the current list price and an eighteen-monthaverage <strong>of</strong> the generic (Category M) price, up-rated by 50 per cent, <strong>of</strong> the equivalent dose <strong>of</strong>the comparator. Average prices are used for comparator drugs because UK generics pricescan exhibit some volatility month by month.5.156 We recognise in relation to atorvastatin – which represents a high proportion <strong>of</strong> potentialsavings – that efforts have been made to reduce prescribing rates in 2006. <strong>The</strong> aggregateresults <strong>of</strong> such efforts are not yet available but we might expect current volumes – andpotential efficiencies – to be lower than those shown here.Table 5.4: Estimated savings from reimbursement changes, 2005 volumesProduct Comparator Generic price plus 50%A2RAs Generic ACE inhibitor 60% <strong>of</strong> 2005 total UK £64.0mprescribing volumesTotal£64.0m5.157 <strong>The</strong> approach in Table 5.4 is the same as above except that savings are calculated on only 60per cent <strong>of</strong> total primary care prescribing for the angiotensin II receptor antagonists (A2RAs).This is because, as discussed above and set out more fully in Annexe M, they are likely toprovide additional therapeutic benefits relative to the comparator to some, but not all,patients they are prescribed for. In our view, these products represent potential strongcandidates for price / volume or rebate agreements, since the current linear price structurearguably gives companies the wrong incentives to incur marketing expenditure.96
February 20075.158 With regard to Tables 5.3 and 5.4, it must be noted that we would not expect gainsestimated on the basis <strong>of</strong> prescribing volumes observed in 2005 to persist indefinitely.<strong>The</strong> products considered in this assessment will go <strong>of</strong>f patent in a few years and, indeed,one <strong>of</strong> the PPIs lost patent protection in December 2005. We would argue that, in theabsence <strong>of</strong> a value-based approach to pricing, there is a greater possibility <strong>of</strong> drugs continuingto be prescribed in the future at prices that do not reflect their value, but it is difficult tospeculate on medium term outcomes at this point.5.159 <strong>The</strong>refore it is important to recognise that the estimates above represent a snapshot view, as<strong>of</strong> 2005. <strong>The</strong>y are indicative <strong>of</strong> how outcomes for some drugs might be different under avalue-based pricing scheme. We must stress that is not the role <strong>of</strong> the OFT to provide adefinitive view <strong>of</strong> the appropriate prices <strong>of</strong> drugs. That role would fall to the appropriateexpert body under any revised pricing arrangements. 715.160 We have tried, rather, to assess to what extent prices under current arrangements may notbe value-reflective and hence whether there is a case for reform. We feel that ourassessment provides strong evidence that reform should take place, in the interests <strong>of</strong>ensuring the best healthcare outcomes for patients as well as appropriate and stableincentives to invest for companies in the long term.5.161 It is important also to emphasise that the savings could be reinvested in improving access forpatients to drugs and other healthcare interventions and improving the supply <strong>of</strong> useful drugsin the future. We take up these issues below.Short-run benefits – value for money and patient access to healthcare5.162 When the prices <strong>of</strong> prescription medicines do not reflect their relative therapeutic benefitsthe NHS may obtain poor value for money in the short run. Box 5.2 below investigates thequestion <strong>of</strong> how inefficient expenditure might constrain healthcare budgets that could be putto other uses – and exacerbate problems <strong>of</strong> rationing in the NHS. It is important to stress thatsavings on poor value drugs might also release resources for other valuable, but high-cost,medicines.Box 5.2: <strong>The</strong> effects <strong>of</strong> inefficient drug prices on access to healthcare<strong>The</strong> resources available to the NHS for expenditure on drugs and other healthcare interventionsare limited. This implies that, if the price <strong>of</strong> a treatment is out <strong>of</strong> line with its relative therapeuticvalue, the NHS is not making the best use <strong>of</strong> its funding to improve patients’ health. More valuereflectiveprices would achieve a better outcome for patients, allowing wider access to therapieson a timely basis.It should be noted that drugs budgets are not fixed. PCOs receive needs-based funding whichthey have discretion to allocate to a number <strong>of</strong> uses, including primary care prescribing andhospital commissioning, according to local requirements. We have heard from some that, inattempts to balance their budgets, they sometimes respond to high drug prices by rationingaccess to other forms <strong>of</strong> healthcare. Such rationing can affect commissioning <strong>of</strong> simple electiveprocedures in hospitals (such as hip operations or cataract removals, which may either be cut orhave waiting lists extended) as well as services directly provided by PCOs.71 Some proposals for institutional reform are set out in Chapter 6.97
<strong>The</strong> <strong>Pharmaceutical</strong> <strong>Price</strong> <strong>Regulation</strong> <strong>Scheme</strong><strong>The</strong>re are, further, some categories <strong>of</strong> drugs where rationing takes place on cost grounds. Forexample, it is likely that access to ‘high-cost’ drugs (meaning high cost per patient rather than bytotal expenditure) may be directly curtailed as a result <strong>of</strong> inefficiencies elsewhere in the system.PCTs have mechanisms for restricting access to certain high-cost drugs (in some cases requiringapproval <strong>of</strong> prescribing decisions on an individual basis or only agreeing to fund a certain level <strong>of</strong>prescribing over a given period). As drugs become increasingly tailored to smaller patient groupsand specific genetic pr<strong>of</strong>iles, this rationing <strong>of</strong> access to expensive therapies may become a moresignificant issue in the future.While PCOs’ ability to constrain expenditure varies significantly, there is some evidence tosuggest that this behaviour has, in aggregate, had a material impact on patients’ access to drugs.An example <strong>of</strong> restricted access is provided by the anti-TNF∝ therapies for inflammatory arthritis.In March 2002, NICE approved the use <strong>of</strong> the ‘anti-TNFs’ for people with severe rheumatoidarthritis for whom alternative treatments had failed. But a survey in 2005 by the British Societyfor Rheumatology 72 found that a third <strong>of</strong> rheumatologists consulted were prevented fromprescribing anti-TNFs in accordance with NICE guidance by PCTs, usually citing resourceconstraints.While practice varies between PCOs, many companies have suggested to us that themechanisms they employ can be fairly blunt and focus more on reducing cost in the short termrather than achieving value for money. This is one <strong>of</strong> the motivations for using cost effectivenessassessment to inform price directly – to give local decision makers greater assurances that drugsprescribed are cost effective at prevailing prices and to avoid the need for using volume controlsto contain expenditure.In Technology Appraisals, NICE, SMC and AWMSG sometimes reject drugs on the basis <strong>of</strong>unacceptable cost effectiveness rather than purely on the grounds <strong>of</strong> insufficient clinicalevidence. Examples are given in Annexe B. Difficult choices are, we recognise, inevitable giventhe limited resources the NHS has at its disposal. In Annexe M, however, we review some drugsfor which the ICER may conceivably be higher than for rejected products, but which are currentlybeing prescribed in large volumes. 73Where access is restricted on cost effectiveness grounds, it is vitally important that all drugs –old and new – are assessed on the same basis. This does not happen across the board undercurrent arrangements. To restrict access to new treatments while ignoring inefficiencies incurrent expenditure is not an efficient use <strong>of</strong> resources. Nor is it in the interests <strong>of</strong> patients.Long-run effects – investment incentives5.163 If the prices <strong>of</strong> drugs reflect their value to patients and broader society, companies will begiven efficient incentives to invest in pharmaceuticals in the future. <strong>The</strong>se issues areaddressed in greater detail in Box 5.3, which reviews some therapeutic areas in which thereis unmet demand, shows the importance <strong>of</strong> UK prices in global demand and hencedemonstrates how a value-based approach to pricing could improve incentives to invest inthese and other priority areas.72 <strong>The</strong> survey was conducted jointly by the BSR and the Arthritis and Musculoskeletal Alliance (ARMA). Seehttp://www.rheumatology.org.uk/public_affairs/armabsrtnfsurvey/73 We have not calculated the ICERs <strong>of</strong> any <strong>of</strong> the products reviewed. However, at the limit, if two products have entirelyequivalent benefits for patients, the ICER <strong>of</strong> the more expensive relative to the cheaper will be infinite. See Annexe B.98
February 2007Box 5.3: Potential gains from value-based pricing in the long termWhen the prices <strong>of</strong> medicines do not reflect relative therapeutic benefits the investmentincentives <strong>of</strong> firms can be distorted. Specifically, companies may not face strong incentives toinvest in drugs that are most beneficial to society and may conversely be encouraged to spendlarge sums developing products that <strong>of</strong>fer scant improvements to patients over existingalternatives. This can be bad for public health in the long term, leaving patients without effectivetreatments to combat their diseases.<strong>The</strong> World Health Organisation has identified many ‘pharmaceutical gaps’ in serious conditionswhere it is not pr<strong>of</strong>itable for private sector companies to research effective treatments. 74 Someexamples <strong>of</strong> missing medicines according to the WHO are:• an effective treatment for acute stroke• new antibiotics to replace older products rendered ineffective by overuse (and associatedmicrobial resistance)• antidepressants with proven efficacy in children and the elderly, and• technologies to complement drugs in many areas, such as a heat-stable formulation <strong>of</strong> insulinor better diagnostic tools for Alzheimer’s (which could improve understanding <strong>of</strong> the currentgeneration <strong>of</strong> controversial drugs where efficacy is debated).Against this backdrop <strong>of</strong> need, the drugs that generate the biggest revenues globally tend to befor conditions that are chronic, non-fatal (at least for many patients for a long time) and for whichthere are several substitute therapies with similar characteristics and efficacy. Examples <strong>of</strong> suchconditions include dyspepsia and high cholesterol. Commentators sometimes call these sorts <strong>of</strong>pharmaceuticals ‘me-too’ drugs. We do not think it is useful or accurate to divide drugs crudelyinto ‘innovative’ versus ‘me-too’ categories. Many innovations are incremental in nature, bringingbenefits to patient groups that may be poorly served by existing drugs. Such benefits can takethe form <strong>of</strong> more effective treatments or reduced side effects and it is key to securing value formoney that any such incremental benefits be reflected in prices.<strong>The</strong> concern we address in this report is that, for some drugs we have reviewed, relative pricedifferences do not appear to reflect relative incremental benefits. To the extent to which this istrue, prices will be out <strong>of</strong> line with value and will not give helpful incentives to companies toinvest in drugs in the future.Value-based prices might bring huge gains over time to the extent to which they could driveinvestment in areas <strong>of</strong> clinical need. Such gains are clearly difficult to quantify, however, since wedo not know today what drugs could be produced tomorrow under helpful incentives. We alsorecognise that improving investment incentives depends on many variables, not least how pricingregimes around the world interact with countries’ science policies. As well as pricing, otherfactors in the pr<strong>of</strong>itability <strong>of</strong> drug development include the cost <strong>of</strong> R&D, which is determined bythe regulatory process in leading markets, notably the US and Europe. In the UK the Cookseyreview has considered how costs <strong>of</strong> development could be reduced, and public funds bettertargeted, so as to improve success prospects for new medicines in some therapeutic areas.But price is undoubtedly a central concern in getting investment incentives right. UK prices areparticularly important in this regard. As noted in Chapter 3, although the UK is a small market interms <strong>of</strong> prescription volumes, it exerts a disproportionately strong influence on global prices due tothe fact that public health services in many other countries follow the UK’s lead in pricing drugs.74 See for example: WHO (2004), ‘Priority medicines for Europe and the world’, Department <strong>of</strong> Essential Drugs andMedicines policy, document WHO/EDM/PAR/2004.799
<strong>The</strong> <strong>Pharmaceutical</strong> <strong>Price</strong> <strong>Regulation</strong> <strong>Scheme</strong>Resource implications <strong>of</strong> reforms5.164 Several companies indicated to us that they see merit in the principle <strong>of</strong> value-based pricing,but were concerned at the resource implications <strong>of</strong> any move in this direction. It is clearlyright that reform only be implemented if the benefits outweigh the costs. Accordingly, inAnnexe L we have considered the likely costs to the public and private purse <strong>of</strong>implementing a value-based approach to pricing.5.165 To be conservative, we attempt to estimate the costs <strong>of</strong> the most resource-intensive, longterm option that we consider in Chapter 6 – namely, the creation <strong>of</strong> a separate body chargedwith carrying out both ex ante reviews for all new active substances and ex post reviewscovering the all BNF paragraphs over a five year period. In practice, the resource implicationsmay be less than this.Public resources5.166 NICE, SMC and AWMSG are natural candidates for conducting the cost effectivenessanalysis required to implement value-based pricing. As set out in Annexe B, they represent acombined resource and expertise that is almost certainly unmatched in any other country.NICE’s assessments in particular are considered a gold standard for technology appraisalsaround the world. But improvements could be made. In particular, the bodies need tocoordinate to a greater extent than at present on medicines HTAs, addressing the currentsituation in which certain drugs are assessed ex ante both through an SMC appraisal andthough a NICE STA.5.167 <strong>The</strong> institutional proposals we set out in the next chapter are designed to make best use <strong>of</strong>existing resources through greater coordination while also recognising the proper distinctionbetween devolved and national responsibilities. Annexe L sets out a broad brush estimate <strong>of</strong>the additional resources these bodies would require to implement our proposals.5.168 On the basis <strong>of</strong> the current costs NICE incurs in conducting HTAs, a rough estimate <strong>of</strong>required annual resources for implementing full ex ante value based pricing would be: 20 exante and 30 ‘resource-intensive’ ex post reviews at £150,000 each and 40 less resourceintensivereviews at £75,000, for a total <strong>of</strong> £10.5m. As discussed in the next chapter, thiswould be allocated among the three bodies in accordance with their workload. This compareswith NICE’s current expenditure on HTAs <strong>of</strong> £4.5m per year.5.169 <strong>The</strong>refore, the option would represent an increase in expenditure among the existing bodies<strong>of</strong> less than £6m, taking into account the fact that the existing resources <strong>of</strong> SMC in particular(on which we do not have budgetary information) would make a significant contribution to theworkload. As explained in Annexe L, we also think resources elsewhere in the NHS could befreed up through the use <strong>of</strong> value-based prices, further reducing costs, although we have notattempted to quantify these benefits.5.170 Under the medium term approach set out in Chapter 6, a separate pricing unit within DHwould carry out the pricing reviews on the basis <strong>of</strong> a cost effectiveness assessment. Staffwithin the current PPRS team and Commercial Directorates would be natural candidates tostaff the unit, as they are used to price negotiations with manufacturers and also have aninformed sensibility to the wider policy setup <strong>of</strong> the NHS. We have assumed an additional£500,000 per year to meet additional resource requirements for the unit. This would bringthe estimate <strong>of</strong> total costs required to a maximum <strong>of</strong> £11m and <strong>of</strong> additional resourcesrequired to a maximum <strong>of</strong> £6.5m per year. Again as discussed in Annexe L, these aregenerous resources compared to those employed in other countries that employ value-basedpricing methods.100
February 20075.171 Needless to say, these are broadbrush estimates and would need to be worked up in fullwere our recommendations to be implemented. However, it is clear that even a fraction <strong>of</strong>the potential efficiencies suggested by our indicative review above dwarf the likely extrafinancial costs <strong>of</strong> setting up institutions to run a value-based pricing system even under themost resource intensive approach.Private Sector Resources5.172 As well as considering the resource implications <strong>of</strong> a value-based pricing system on thepublic sector bodies responsible for its implementation, costs to pharmaceutical companiesshould also be considered. Costs to pharmaceutical companies <strong>of</strong> submitting information tocost-effectiveness evaluation bodies may increase as more reviews would be required peryear under a value-based pricing system.5.173 However, some <strong>of</strong> these costs would be <strong>of</strong>fset as under the proposed system companieswould only be required to submit ex ante reviews to a single cost-effectiveness body. Thiscontrasts with the current system, in which they are required to submit to two differentbodies (SMC and NICE through the STA process), which have differing processes <strong>of</strong>evaluation, thus requiring potentially differing submissions.5.174 More importantly, more efficient price structures should result in better incentives forefficient marketing and thus lower marketing costs. In fact we believe any increases inrequired informational expenditure caused by a move to value-based pricing could entirely be<strong>of</strong>fset by reduced marketing costs. That is, resources could be reallocated from marketing tosubmission <strong>of</strong> cost effectiveness information on drugs. It would require a relatively smallreallocation <strong>of</strong> marketing spend to achieve this: in 2004, £850m was spent by AFRcompanies on marketing drugs in the UK.5.175 We recognise, however, that, in a more value-conscious NHS, it is important to supportcompanies in developing robust cases for the cost-effectiveness <strong>of</strong> their products. Severalrecommendations to help companies do so are discussed in the recent Cooksey Review <strong>of</strong>UK health research funding (December 2006). We welcome the recommendations <strong>of</strong> theCooksey Review and see them as a natural complement to a value-based approach to pricing.<strong>The</strong> review and its relationship to value-based pricing is discussed further in box 5.4.Box 5.4: Value-based pricing and the Cooksey Review<strong>The</strong> Cooksey Review has explored ways <strong>of</strong> increasing the rate at which basic research translatesinto healthcare interventions yielding clinical and economic benefits. On the subject <strong>of</strong> drugdevelopment the Review identifies a number <strong>of</strong> challenges in bringing new products to market.<strong>The</strong> Review explains how developing a new drug has become an increasingly costly undertakingin recent years, in part due to the informational demands placed on manufacturers:• the licensing process has become lengthier and more complex, increasing costs <strong>of</strong>compliance and reducing the effective patent life <strong>of</strong> a typical new medicine at launch, and• Health Technology Assessment (HTA) by NICE, SMC and AWMSG adds further costs <strong>of</strong>compliance at the end <strong>of</strong> the development process.101
<strong>The</strong> <strong>Pharmaceutical</strong> <strong>Price</strong> <strong>Regulation</strong> <strong>Scheme</strong>Other trends have also contributed to diminishing the pr<strong>of</strong>itability <strong>of</strong> innovation, such as a movetowards developing more ‘personalised’ medicines that treat subgroups <strong>of</strong> patients with acondition (such as specific genetic types). Development costs per patient treated can be higherfor products with small markets than for the last generation <strong>of</strong> ‘blockbuster’ drugs forwidespread chronic conditions such as cholesterol, hypertension or dyspepsia – where ‘easywins’ in terms <strong>of</strong> medical breakthroughs have mostly been had.To reduce the average cost <strong>of</strong> developing a new chemical entity, major challenges will be toreduce the failure rate <strong>of</strong> candidate molecules – at least those reaching relatively late stages <strong>of</strong>development – and to increase the uptake and pr<strong>of</strong>itability <strong>of</strong> truly useful new drugs. To meetthese challenges <strong>of</strong> easing ‘the critical path’ <strong>of</strong> drug discovery, both licensing authorities and theNHS, on the one hand, and the pharmaceutical industry, on the other, will need to show flexibilityand address their appetites for risk.<strong>The</strong> Cooksey Review calls for several new arrangements to ease the critical path, including:• a systematic programme <strong>of</strong> pilot studies <strong>of</strong> conditional licensing for new drugs at relativelyearly stages, allowing for initial use by specialists but not GPs• a more thoroughgoing approach to HTA, expanding it to cover a greater proportion <strong>of</strong> NHSactivities and introducing assessment earlier in the development process• the creation <strong>of</strong> disease registries within the NHS HTA programme, to enable more effectivetracking <strong>of</strong> the safety and efficacy <strong>of</strong> drugs in practice, where issues such as patientcompliance and <strong>of</strong>f-label prescribing can inform relatively low-cost research to augment theclinical value <strong>of</strong> drugs, and• use <strong>of</strong> the forthcoming NHS National Programme for IT (NPfIT) to automate and expand onthe measures described above.Value-based pricing would be supported by the measures outlined above, all <strong>of</strong> which wouldgenerate more information, and earlier, about drugs than is available at present.Conclusion5.176 We believe there is a compelling case for adopting a value-based approach to pricingwithin the PPRS, as the best available means <strong>of</strong> delivering the high-level objectives <strong>of</strong> thescheme <strong>of</strong> securing value for money for the NHS whilst providing appropriate incentives formanufacturers to invest in beneficial drugs in the future.5.177 In this respect, we believe either Options two or three would represent a significantimprovement on current arrangements. Taking up the system <strong>of</strong> ex-post reviews proposed inoption two would involve fewer changes compared to today and allow companies commercialfreedom in pricing newly launched drugs, but the trade-<strong>of</strong>f would be a delay in achievingvalue-reflective prices and, possibly, delays in the uptake <strong>of</strong> cost effective treatments.5.178 <strong>The</strong> ex ante value-based approach in Option three addresses these concerns and is thereforeour preferred option. Fast track ex ante assessments would provide a rapid, pragmaticapproach for most drugs. <strong>The</strong> option to pursue a risk-sharing contract <strong>of</strong>fers the promise <strong>of</strong>being able to assess the therapeutic benefits <strong>of</strong> individual drugs in the most open-mindedand case-specific way possible but would call for more administration and negotiation.102
February 20075.179 However, in the discussion above we argue that the NHS and other UK public bodies –including NICE, SMC and AWMSG – possess ample specialist clinicians and expertise inHealth Technology Assessment (HTA) compared to numerous other countries that appraiseevery new drug at launch and review public reimbursement listings annually. <strong>The</strong> additionalfunding we estimate would be required to implement ex ante value based pricing wouldresult in an overall resource base that would be far more generous than that currentlyemployed in these other countries. <strong>The</strong> greater robustness and rigour <strong>of</strong> HTA in the UKwould therefore be maintained under our proposed reforms.5.180 In the next Chapter we consider how the institutional framework to implement our proposalscould be structured in the short and long term. To allow reasonable time for a new system tobe implemented, we propose that the reforms proposed in Option three commence from2010, when the current PPRS is due to expire.103
<strong>The</strong> <strong>Pharmaceutical</strong> <strong>Price</strong> <strong>Regulation</strong> <strong>Scheme</strong>6 RECOMMENDATIONS AND INSTITUTIONAL FRAMEWORKSummary <strong>of</strong> recommendations6.1 We recommend that Government work towards reforming the PPRS, replacing theexisting pr<strong>of</strong>it cap and price cuts with a value-based approach to pricing. We believethat both <strong>of</strong> the value-based pricing options we have identified would be a majorimprovement on current pricing arrangements, helping to secure value for money for theNHS and avoiding the increasingly arbitrary nature <strong>of</strong> PPRS controls.6.2 However, in our opinion the best long-term arrangement for the UK would be Optionthree: to replace PPRS pr<strong>of</strong>it controls and price cuts with an ex ante value-basedapproach to pricing.6.3 For standard branded generics for which there is a bioequivalent generic supply subject toCategory M pricing, pharmacies should be reimbursed at the Category M generic price.6.4 For originator brands for which there is a Category M equivalent, pharmacies should bereimbursed at the Category M generic price (plus a maximum <strong>of</strong> 25 per cent).Institutional and legal framework6.5 <strong>The</strong> rest <strong>of</strong> this chapter sets out a proposed legal and institutional framework to administerour recommended option for reform <strong>of</strong> the PPRS. We focus on the framework for theoperation <strong>of</strong> a fully reformed value-based PPRS over the medium and long term, starting fromwhen a new scheme would be renegotiated, in 2010.6.6 Most companies have told us that it would be a mistake to introduce wholesale reformovernight. We agree. We recognise that new institutions and procedures cannot beintroduced precipitously, without a risk <strong>of</strong> undermining the quality <strong>of</strong> analysis and robustness<strong>of</strong> process on which a successful value-based approach to pricing depends.6.7 We recognise that there are provisions for conducting a Mid-Term Review <strong>of</strong> the scheme asset out in Section 6 <strong>of</strong> the agreement:‘6.1: In the event <strong>of</strong> major changes affecting the supply <strong>of</strong> medicines to the NHS, eitherparty may request an interim review after two and a half years. Following such a reviewthe terms <strong>of</strong> the scheme may be varied with the agreement <strong>of</strong> the ABPI and the Secretary<strong>of</strong> State.6.2: If the terms <strong>of</strong> this scheme are altered with the agreement <strong>of</strong> the ABPI and Secretary<strong>of</strong> State, companies will be invited to accept the new terms. <strong>The</strong>y will have the option <strong>of</strong>leaving the scheme as set out in Chapter 9.’6.8 Whether to implement such an option is a matter for Government and ABPI to consider. If thisoption were adopted, it might be possible to phase in arrangements on a transitional basis.Any such approach would have to be discussed between industry and Government, however.6.9 Rather, the focus <strong>of</strong> this annexe is on medium and long term arrangements, during which,under our preferred approach, pr<strong>of</strong>it controls and price cuts would be phased out andreplaced by:• ex ante reviews to be conducted for all New Active Substances coming onto themarket, and• ex post reviews to be conducted <strong>of</strong> all drug categories over a five year period. 7575 As noted, some <strong>of</strong> these reviews, covering paragraphs that are uncontroversial or account for low levels <strong>of</strong> expenditure,would be very light touch.104
February 2007<strong>The</strong> medium term6.10 We propose that under a fully reformed PPRS starting from 2010, maximum prices forbranded drugs would be set on value-based principles. <strong>The</strong> cost effectiveness analysisrequired to form a view on value-reflective prices would be undertaken by NICE, SMC andAWMSG. <strong>The</strong> work between the bodies would be coordinated by agreement between theUK health departments.6.11 In the medium term, these bodies would not be able to set prices or make reimbursementdecisions on their own account. Any revised NHS list prices or rebate regime would have tobe formally negotiated with companies by the Secretary <strong>of</strong> State for Health. In practice, wepropose that a pricing unit within DH carry out this task, on the basis <strong>of</strong> analysis carried outby NICE, SMC and AWMSG.6.12 Part <strong>of</strong> the appeal <strong>of</strong> this framework is its practicality since it would be unlikely to requirenew legislation. It reflects the fact that pricing decisions are not devolved, but are made at aUK level. 76 At the same time, most aspects <strong>of</strong> devolved arrangements would be untouchedbecause devolved bodies would continue to exist in their present form.6.13 We believe that there are important benefits to this since NICE, SMC and AWMSG have builtup institutional expertise and credibility within the UK – indeed we heard repeatedly on casestudy trips undertaken for this study (see Annexe K) that NICE is increasingly perceived as aworld-class HTA body. Thus we propose that the pharmaceutical appraisal activitiesundertaken by NICE, SMC and AWMSG would be coordinated through a UK-wideprogramme <strong>of</strong> drug appraisals, to ensure efficient use <strong>of</strong> these resources. <strong>The</strong> other activities<strong>of</strong> NICE and the work <strong>of</strong> SIGN in Scotland would be unaffected.6.14 Clinical guidelines (as produced by NICE and SIGN, for example) would have the samepurpose and status as at present. Pricing negotiations for branded drugs should inform, but beconceptually separate from, broader views <strong>of</strong> appropriate care across entire clinical pathways.<strong>The</strong>re will be a case for close coordination between SMC and SIGN, to ensure that clinicalguidelines reflect not just clinical but cost effectiveness considerations. All non-medicinesguidance would continue to be produced on a devolved level. 776.15 We envisage that the DH pricing unit would be staffed primarily by staff from the currentPPRS team and the Commercial Directorate, given the experience <strong>of</strong> both in companynegotiations and medicines policy.Overview <strong>of</strong> the medium-term scheme in practice6.16 <strong>The</strong> proposed operation <strong>of</strong> the scheme in practice is set out in Figure 6.1 overleaf.6.17 NICE, SMC and AWMSG would undertake the cost effectiveness analysis needed for ex-antepricing and associated ex post reviews as well as risk-sharing schemes. For each drugappraised, one <strong>of</strong> the bodies would take a view on a cost effective price but pass itsconclusions to a pricing unit in DH to negotiate the final terms with manufacturers, on behalf<strong>of</strong> the devolved health departments.76 We believe that there are good reasons for this – multiple prices within the UK would lead to problems <strong>of</strong> parallel trade,creating supply side instability.77 NICE, for example, would continue to produce guidance on interventional procedures, public health promotion activitiesand devices.105
<strong>The</strong> <strong>Pharmaceutical</strong> <strong>Price</strong> <strong>Regulation</strong> <strong>Scheme</strong>6.18 <strong>The</strong> key challenges to be addressed in such a system, which would make use <strong>of</strong> existingcost effectiveness bodies to inform pricing decisions, is how to ensure coordination <strong>of</strong> effortand consistency <strong>of</strong> approach.Figure 6.1: Possible pricing arrangements in the medium termDH, DHSSPSNI,SEHD, WAGHDDHpricing unitDecision on pricingand reimbursementCompaniesFrameworkfor division<strong>of</strong> workPublished HTA analysisform recommendations to DHUK LevelAWMSGNICESMCDevolved LevelGuidelines and HTA guidanceLocal health authorities and prescribersKEY:InputGuidanceDecision6.19 Given the volumes <strong>of</strong> work generated by assessing all drugs on value-based principles, thedevolved health departments would agree on a work programme to divide up assessmentsbetween the three bodies. This coordination mechanism would avoid duplication <strong>of</strong> effort andensure that best use is made <strong>of</strong> existing resources in conducting HTA assessments.6.20 A further advantage to any system under which all drugs would be assessed by NICE, SMCand AWMSG would come from removing the need for the current referrals process by whichNICE is passed drugs to assess by DH. <strong>The</strong> process <strong>of</strong> deciding which drugs are to beassessed by NICE, described in Annexe B <strong>of</strong> this report, is itself time-consuming.6.21 <strong>The</strong> need to achieve consistency <strong>of</strong> approach is central if key stakeholders are to haveconfidence in a value-based pricing system. We recognise, however, that significantdifferences in approaches currently exist between the three bodies. Under currentarrangements, there are differences in terms <strong>of</strong> which types <strong>of</strong> drugs are reviewed and howthe HTA process is carried out by the bodies. As discussed in Annexe B, the approach <strong>of</strong>NICE is generally regarded to provide the most in-depth and robust analysis.6.22 In the short run, a pragmatic solution would be to make best use <strong>of</strong> the respective strengths<strong>of</strong> the bodies in the allocation <strong>of</strong> assessments through the work programme. As noted,assessments will vary significantly in terms <strong>of</strong> complexity <strong>of</strong> analysis required and resourceinput needed. For instance, a review <strong>of</strong> an uncontroversial class <strong>of</strong> established drugs or theassessment <strong>of</strong> a new strength <strong>of</strong> an existing medicine may be relatively straightforward andcould be conducted using a lighter touch approach. Alternatively, a new class <strong>of</strong> innovativedrugs or a complicated treatment class may require a more robust, in-depth assessment.<strong>The</strong> division <strong>of</strong> work between the bodies should take account <strong>of</strong> these resource differences.This does not imply inconsistency but rather a proportionate use <strong>of</strong> resources.106
February 20076.23 A UK-wide programme <strong>of</strong> drug appraisals, however, implies the need for greater coordinationand consistency in the approach adopted by the bodies. We think a useful measure could bethe establishment <strong>of</strong> an ‘HTA <strong>Pharmaceutical</strong> Forum’ as part <strong>of</strong> the medium term approach tovalue based pricing. NICE could initially host this forum, which would give the bodies anopportunity to discuss HTA issues arising from their input into the pricing process. <strong>The</strong> bodiescould benefit from information exchange (e.g. methodologies) to better inform their work,which could lead to improved and more harmonised approaches where needed.6.24 <strong>The</strong> work programme would set out in principle how ex ante and ex post appraisals would bedivided between NICE, SMC and AWMSG although <strong>of</strong>ficials in the UK Departments <strong>of</strong> Healthmay need to show flexibility when assigning individual appraisals, according to short-termcapacity constraints. We would not wish to pre-empt decisions on the division <strong>of</strong> economicmodelling, but certain ways <strong>of</strong> working suggest themselves. NICE and SMC currently reviewdrugs at launch, and so between them already have well developed skills and processes toconduct the analysis to inform ex-ante price setting required under our preferred option forreform. NICE and AWMSG, and the academic centres, which today undertake in-depthevaluations <strong>of</strong> drugs that have been on the market for some time, have the skills needed tomanage ex-post reviews and risk-sharing schemes. Further, the in-depth assessment <strong>of</strong> NICEmight be more be more appropriate for evaluation <strong>of</strong> some <strong>of</strong> the more challenging NAS,while the more rapid, less resource-intensive approach <strong>of</strong> SMC and AWMSG would be suitedfor swift reviews <strong>of</strong> less controversial areas.6.25 In practice, the scheme would work as follows for new drugs. A manufacturer would submita proposed price to NICE, SMC or AWMSG, along with relevant cost effectiveness evidence.This would require the early stage engagement between manufacturers and NICE, SMC andAWMSG that the Cooksey review has recommended, as discussed above.6.26 If the appraising body considered that, at the given price, the evidence indicated the drugwould fall below the relevant cost effectiveness threshold in all indications, the drug wouldbe recommended to the NHS. Recommendations would take the form <strong>of</strong> guidance similar tothat issued today by the SMC (and NICE through the STA process) in the assessment <strong>of</strong> newdrugs at launch.6.27 If the drug fell above the relevant threshold in some or all indications, the appraising bodywould publish an assessment indicating its view <strong>of</strong> the maximum acceptable price (in eachindication if the prices varied). This information would inform the subsequent pricenegotiation that would be carried out by DH.6.28 If the appraising body determined that there was sufficient uncertainty about outcomes,there would be an opportunity to consider risk-sharing or ‘only in research’ recommendations.<strong>The</strong> appraising body would publish its view to inform DH’s pricing negotiations. <strong>The</strong> publishedassessment might include estimated volumes for each indication and, in the case <strong>of</strong> a risksharingcontract, the clinical data that would be required to inform future assessment.6.29 Once DH received the appraising body’s view, the DH pricing unit would then attempt tonegotiate an agreement on the basis <strong>of</strong> the evidence provided by NICE, SMC or AWMSG.It would negotiate with manufacturers on both price level and structure, which may include,for example, rebates, or brand premiums.6.30 Once a pricing decision was reached between DH and the manufacturer, the drug would beincluded in the NHS for reimbursement. At this stage, the appraising body that conducted theinitial cost effectiveness appraisal would issue guidance on the use <strong>of</strong> the drug to the NHS to107
<strong>The</strong> <strong>Pharmaceutical</strong> <strong>Price</strong> <strong>Regulation</strong> <strong>Scheme</strong>aid prescribers and to inform future clinical guidelines. An agreement would be requiredwhereby the guidance <strong>of</strong> each <strong>of</strong> the bodies would apply across the UK. 786.31 We believe this transparency should give prescribers and health authorities greaterconfidence that any future prescribing would be cost effective, which should in turn improveuptake. <strong>The</strong> ability to negotiate an appropriate price structure should mean that restrictedrecommendations would be less frequent under a value-based PPRS. However, the facility toissue restricted recommendations would still exist.6.32 Where an agreement between the manufacturer and the pricing unit could not be reached,NICE, SMC and AWMSG would issue negative guidance. For new drugs in this situation,reimbursement would be refused by the Secretary <strong>of</strong> State.6.33 In all cases, but especially those where refusal <strong>of</strong> reimbursement would be a realisticprospect, it would be important to have in place an appropriate appeals process for costeffectiveness decisions issued by NICE, SMC and AWMSG. As under current arrangements,the appeals process would be internal to existing bodies.6.34 Similarly, an appeals system would need to be in place for price negotiations between DHand the manufacturer. This accountability mechanism would promote stability andtransparency in the new pricing and reimbursement process.6.35 In addition, any pricing scheme in an EU member state must be compliant with EC legislation,including the EC Directive relating to the transparency <strong>of</strong> measures regulating the pricing <strong>of</strong>medicinal products for human use and their inclusion in the scope <strong>of</strong> national health insurancesystems (Directive 89/105/EEC the ‘Transparency Directive’) and provisions in relation to StateAid, competition law and the free movement <strong>of</strong> goods. Certain decisions taken under a UKpricing scheme would, potentially, also be open to the scrutiny <strong>of</strong> judicial review.6.36 In practice, as elaborated upon in Annexe G, the Transparency Directive is not prescriptive asto the particular form <strong>of</strong> a pricing scheme, but rather sets the high level principles to which itshould adhere – in particular that pricing and reimbursement decisions should be made on thebasis <strong>of</strong> ‘objective and verifiable criteria’. 79 It also imposes certain procedural requirements.Almost all cases successfully brought under the Transparency Directive have related to afailure to keep within the prescribed time limits or to provide reasons for decisions. 806.37 This objective could therefore be met by a wide variety <strong>of</strong> forms <strong>of</strong> pricing scheme, providingthe institutions that implement them had robust and fair processes.78 <strong>The</strong>re are precedents for such agreements. Since the establishment <strong>of</strong> a formal link with NICE in July 2006, guidancefrom NICE is to be implemented in Northern Ireland and NICE interventional procedures cover the whole <strong>of</strong> the UK.79 Of particular relevance in interpreting this requirement is UK (R (on the application <strong>of</strong> Pfizer Ltd.)) v. Secretary <strong>of</strong> State forHealth [2003] 1CMLR 19 in which Court <strong>of</strong> Appeal was asked to consider the decision <strong>of</strong> the Secretary <strong>of</strong> State thatViagra was not to be reimbursed on the NHS. It was alleged that the decision to restrict the use <strong>of</strong> Viagra, on the basisnot <strong>of</strong> clinical or cost-effectiveness but rather on the Secretary <strong>of</strong> State’s assessing the need it addressed as having alower priority than other calls on NHS funds, failed to contain a statement <strong>of</strong> reasons “based on objective and verifiablecriteria” as required by Article 7. Lord Justice Brown held on the contrary that, “For the criteria to be ‘verifiable’, all that isnecessary is that they should be published and available, in particular to would-be importers, to satisfy themselves thatthey do not contain disguised restrictions on intra-Community trade. And the measures are ‘objective’, in the sense usedby the Court in Duphar, if they are based on a legitimate aim, that <strong>of</strong> improving the economics <strong>of</strong> the state healthsystem.”80 Annexe G provides further details.108
February 20076.38 We would expect that, at least in the short run, the period for drug review would not besignificantly different from the current time lines in place. <strong>The</strong>re may be economies <strong>of</strong> scaleas the bodies expand their scope and role in the drug review process. <strong>The</strong> pricing decisionswould need to be well coordinated with the appraising bodies to ensure that HTAassessments, pricing and reimbursement decisions were carried out in a timely manner.Some assessments could in principle be produced within a few weeks <strong>of</strong> a marketingauthorisation being issued. To achieve this would require the early stage engagementbetween manufacturers and NICE, SMC and AWMSG that the Cooksey review hasrecommended.6.39 Once an agreement on prices had been reached between a company and the DH pricing unit,we would envisage that the company would not be able to increase prices unless or until afurther review had been carried out.6.40 As regards products on the market at the time our proposed reforms would begin to operate,we would envisage that their reimbursement prices would remain at then prevailing levelsuntil reviewed by NICE, SMC or AWMSG. This would mean that such products would not besubject to further price cuts, but also that their prices could not be increased until such achange had been demonstrated to be cost effective. <strong>The</strong>re would be no price modulationunder this system.Legal status <strong>of</strong> the medium term6.41 <strong>The</strong> Health Act 1999 currently, but from 1 March 2007 the National Health Service Act 2006(‘NHS Act 2006’), enables the Secretary <strong>of</strong> State to make a statutory scheme replacing thePPRS or to negotiate any other voluntary agreement with the pharmaceutical industry, for thepurpose <strong>of</strong> limiting prices or pr<strong>of</strong>its <strong>of</strong> manufacturers or suppliers <strong>of</strong> NHS medicines acrossthe UK. 816.42 It would be desirable for arrangements for the medium term to be negotiated through avoluntary agreement between ABPI and the UK Health Departments. We consider the likelystatus and content <strong>of</strong> any such scheme at the end <strong>of</strong> this chapter. If this were not possible,the Secretary <strong>of</strong> State could use the NHS Act 2006 powers to establish a statutory scheme.6.43 <strong>The</strong> institutional framework set out here would therefore rely on existing legislation. Pricingwould rely only on powers already held by the Secretary <strong>of</strong> State under the NHS Act 2006.6.44 In relation to the mechanism for ensuring coordination between the three cost effectivenessbodies, the legal situation is relatively clear for NICE and SMC but somewhat less so forAWMSG.6.45 In respect <strong>of</strong> NICE, section 28 <strong>of</strong> the NHS Act 2006 (replacing section 11 <strong>of</strong> the NHS Act1977 from 1 March 2007), permits the Secretary <strong>of</strong> State to ‘…make such further provisionrelating to a body established under subsection (1) as he considers appropriate.’ <strong>The</strong>sepowers apply to NICE and would seem to be sufficiently broadly worded so as to permitprovision to be made as to NICE co-operating with SMC and AWMSG.81 Health Act 1999 section 35, read with section 38. To be replaced from 1 March 2007 by NHS Act 2006 section 263, readwith section 266. See Annexe G for details.109
<strong>The</strong> <strong>Pharmaceutical</strong> <strong>Price</strong> <strong>Regulation</strong> <strong>Scheme</strong>6.46 With regard to SMC, acting essentially as a consortium <strong>of</strong> Scotland’s Health Boards, section2(5) <strong>of</strong> the NHS (Scotland) Act 1978 provides the means by which its relationship with otherbodies can be legislated for. 826.47 <strong>The</strong> legal situation <strong>of</strong> AWMSG is less clear because it is not covered explicitly by legislation inthe way that NICE and SMC are. As with the other bodies, AWMSG would need to agree toparticipate in the reforms to the PPRS proposed here. Further steps to formalise the relationshipwould include securing agreement from the Welsh Assembly Government Health Department.Longer-term options6.48 Into the longer term it may be considered desirable to extend the joint working arrangementsproposed above. This section briefly considers the issues. We stress, however, that theseideas represent only one option for a long-term direction <strong>of</strong> travel and would not be desirablebefore the arrangements proposed above had bedded down. Any transition would benecessarily gradual.6.49 One longer term option would be to formalise the coordination between NICE, SMC andAWMSG through the creation <strong>of</strong> a Commission on the Value <strong>of</strong> Medicines (CVM) that woulddirect the HTA activities <strong>of</strong> NICE, SMC and AWMSG. Pricing would continue to be carried outby DH using the Secretary <strong>of</strong> State’s powers under the NHS Act 2006. Ultimately theCommission could take over the responsibility for negotiating prices with manufacturers,becoming an independent Medicines Pricing Commission (MPC). While establishing the CVMmay require only secondary legislation, the MPC would need to be underpinned by primarylegislation. We discuss these institutional proposals in turn.Commission on the Value <strong>of</strong> Medicines6.50 <strong>The</strong> CVM would comprise members drawn from NICE, SMC, AWMSG, the MHRA and otherinstitutions, ensuring that all four countries <strong>of</strong> the UK were represented. Further membersrelevant to specific decisions, such as clinical and academic specialists in specific diseaseareas, would be drawn in on a case-by-case basis from a list <strong>of</strong> accredited individuals.Preferably, at least one clinician, one pharmacist and one pharmacologist would contribute tothe price recommendation for every drug considered. All members <strong>of</strong> the commission wouldbe required to be free <strong>of</strong> conflicts <strong>of</strong> interest.6.51 Detailed economic evaluation would continue to be carried out by NICE, SMC, AWMSG andthe academic centres as an input into the decision making <strong>of</strong> the CVM. Common standardsgoverning their processes would be developed through the CVM. Clinical evaluation would becarried out by specialists from the NHS as at present. To ensure consistency in viewpoints,existing and new clinical networks would appoint liaison membersto inform CVM decisions. 836.52 <strong>The</strong> CVM would retain many <strong>of</strong> the advantages <strong>of</strong> our proposals for reform outlined above.For example it would help ensure efficient use <strong>of</strong> HTA assessment resources across the UK,while reflecting the legitimate desire to have many important functions – notably the provision<strong>of</strong> clinical guidelines to prescribers – produced at a devolved level. Bodies from the separatecountries <strong>of</strong> the UK, such as NICE, SMC and AWMSG, would directly influence prices acrossthe UK but continue to exist in their present form.82 ‘In carrying out the purposes mentioned in subsection (1) and in exercising any function otherwise conferred on them byor under this Act each Health Board shall act subject to, and in accordance with, such regulations as may be made, andsuch directions as may be given, by the Secretary <strong>of</strong> State; and such regulations and directions may be made or givengenerally or to meet the circumstances <strong>of</strong> a particular area or matter.’83 Many clinical networks exist in the NHS, from local initiatives to those for major conditions such as heart disease andcancer, led (in England) by National Directors.110
February 20076.53 <strong>The</strong> figure below illustrates how the CVM might work in practice. <strong>The</strong> model <strong>of</strong> anindependent body providing cost effectiveness evaluations as an input into the pricingdecision <strong>of</strong> a separate authority is one that has been employed to good effect elsewhere,notably Australia (see Annexe K).Figure 6.2: Commission on the Value <strong>of</strong> MedicinesIndustry bodyPPRS styleagreementDH, DHSSPSNI,SEHD, WAGHDPolicy parametersIndustryconsultativebodyPatientconsultativebodyCVMCommission on the Value <strong>of</strong> MedicinesMembers: AWMSG, NICE, SMC,MHRA and otherRecommendationson priceDHpricing unitDecision on pricingand reimbursementCompaniesCarry out HTA analysis for the CVMUK LevelAWMSGNICESMCDevolved LevelguidanceGuidelines and non-medicine guidanceKEY:InputLocal health authorities and prescribersGuidanceDecisionMedicines Pricing Commission6.54 A longer term option would be for the MPC to replace the CVM as a body with legal authorityfor making pricing and reimbursement decisions. In principle, a number <strong>of</strong> measures could beused to underpin the independence <strong>of</strong> the MPC. Principles for appointing and dismissingmembers and their length <strong>of</strong> tenure could be set out in legislation, for example. <strong>The</strong>re maybe a case, with a genuinely independent MPC, for a separate appeals panel to considercontested decisions.6.55 <strong>The</strong> revised process is shown in the diagram below, which illustrates how the MPC wouldwork in practice.111
<strong>The</strong> <strong>Pharmaceutical</strong> <strong>Price</strong> <strong>Regulation</strong> <strong>Scheme</strong>Figure 6.3: Medicines Pricing CommissionIndustry bodyPPRS styleagreementDH, DHSSPSNI,SEHD, WAGHDPolicy parametersIndustryconsultativebodyMPCMedicines Pricing CommissionMembers: AWMSG, NICE, SMC,MHRA and otherDecision on pricingand reimbursementPatientconsultativebodyCompaniesCarry out HTA analysis for the MPCUK LevelAWMSGNICESMCDevolved LevelguidanceGuidelines and non-medicine guidanceKEY:InputLocal health authorities and prescribersGuidanceDecision<strong>The</strong> case for an independent pricing body6.56 <strong>The</strong>re are arguments for and against a fully independent MPC. In principle, it seemsreasonable to strive to remove political influence from essentially technocratic decisions onthe consistent pricing <strong>of</strong> the clinical value <strong>of</strong> medicines – which can only properly bedetermined by specialists.6.57 Furthermore an independent pricing body could help create stability and improve investmentincentives by providing a mechanism by which Government could credibly commit to payingreasonable prices to companies in the future. In a variety <strong>of</strong> policy fields, Governments havesuccessfully created independent bodies with clear objectives set down in statute in attemptto improve dynamic incentives. <strong>The</strong> Bank <strong>of</strong> England and independent utility regulatorsprovide examples. 84 Creating an independent pharmaceutical pricing body would beconsistent with this broader trend towards the use <strong>of</strong> constrained discretion in policy making.It would also be consonant with the thrust <strong>of</strong> recent policy proposals in relation to the healthservice: these have suggested that the NHS should be run more independently <strong>of</strong> ministerialintervention, through the establishment <strong>of</strong> an NHS board.6.58 However, we regard this framework as a long-term possibility for a number <strong>of</strong> reasons. First,it would require legislation to implement – both to give the body, on a UK wide basis, pricingand reimbursement powers currently accorded to the Secretary <strong>of</strong> State and to bolster itsindependent status, as set out above.84 Commitment problems are discussed in greater length in Annexe L.112
February 20076.59 Second, while some companies have seen merit in the creation <strong>of</strong> an independent body inprinciple, it would take time for the policies and processes <strong>of</strong> a new PPRS, and the workingpractices <strong>of</strong> the CVM, to establish a track-record <strong>of</strong> credibility and fairness with companies.Once pricing decisions had been shown to be robust and fair and, ideally, to improve uptake<strong>of</strong> cost effective medicines in the NHS, moving to an independent structure would be moretenable.6.60 Third, the current expertise <strong>of</strong> the main constituent bodies <strong>of</strong> the Commission is in the field<strong>of</strong> technical analysis and assessment rather than commercial decision making. It wouldtherefore take the body time to build up the capacity for commercial negotiations.6.61 Ultimately, we think that either model set out here – either the medium term or long termapproach – could work. <strong>The</strong>re are examples <strong>of</strong> effective systems in other countries based oneither <strong>of</strong> these approaches (see Annexe K).Policy input and the role <strong>of</strong> PPRS6.62 In both the medium term and long term structures, we think there could be an important rolefor a PPRS-style agreement between industry and Government, to provide high-level inputinto pharmaceutical pricing and reimbursement arrangements.6.63 A value-based PPRS would clearly be a different sort <strong>of</strong> document to the present agreement,containing high level principles for the conduct <strong>of</strong> reviews and setting out certain keyparameters. Perhaps the most important among these would be the cost/QALY thresholdthat should apply to assessments. Annexe L <strong>of</strong> this report gives some considerations as tothe factors that should be taken into account in setting this threshold.6.64 We think it is appropriate that this threshold be determined in discussion between industryand Government, given the significant impact it has on NHS expenditure and companiesrevenues. 85 This would become increasingly important under any system in which pricing andreimbursement decisions are delegated entirely to an independent authority. 866.65 Other matters that might be set out in a PPRS agreement might be which costs and benefitsto consider in the assessment <strong>of</strong> the cost effectiveness <strong>of</strong> a medicine (for example, whetherto include benefits to carers and whether to include non-NHS costs) and priorities <strong>of</strong> socialequity such as the appropriate treatment <strong>of</strong> orphan medicines.6.66 <strong>The</strong> document would therefore be a higher level policy document than at present. It wouldnot be prescriptive as to the details <strong>of</strong> the methodologies and procedures to be followed bythe Commission – these would be set out in guidance that the Commission itself wouldissue. Moreover, it would not provide the main mechanism for enforcing decisions – in mostcases the bargaining position <strong>of</strong> the payer would be underwritten by the ability to refusereimbursement or, in the case <strong>of</strong> the risk sharing approach – through separate contractualmechanisms.85 Under current arrangements it seems to us to be exposing NICE, SMC and AWMSG to excessive pressure to expectthem to develop an appropriate cost effectiveness threshold without guidance or input from central Government.86 An alternative approach is that the body be allocated a fixed drug budget (the size <strong>of</strong> which would be determined throughperiodic negotiations), from which a cost / QALY would be derived. <strong>The</strong> arguments for and against this approach werediscussed in Chapter 5. As noted there, we think it is an option that should be seriously considered for the long run.113
<strong>The</strong> <strong>Pharmaceutical</strong> <strong>Price</strong> <strong>Regulation</strong> <strong>Scheme</strong>6.67 <strong>The</strong> PPRS would, rather, constitute a broad framework agreement within which more specificpieces <strong>of</strong> guidance operated and individual contracts negotiated. Negotiations would takeplace every five years or so, as at present. <strong>The</strong> scheme would therefore continue to provide aforum for industry / government dialogue, an aspect <strong>of</strong> current PPRS arrangements thatmany companies value.Conclusion6.68 <strong>The</strong> medium and long term arrangements proposed here would provide a practical basis forimplementing a value-based pricing regime in the UK, ensuring efficient use <strong>of</strong> HTAassessment resources across the country, while reflecting the legitimate desire to have manyimportant functions carried out at a devolved level. By building on existing expertise withinthe NHS we believe they will provide a robust and flexible framework for a new, value-basedPPRS in the long term, delivering benefits to patients and innovative companies alike.114
Published by the <strong>Office</strong> <strong>of</strong> <strong>Fair</strong> <strong>Trading</strong>Printed in the UK on paper comprising 75% post-consumer waste and 25% ECF pulpProduct code OFT885Edition 02/07 Printed: 02/07/300© Crown Copyright 2007