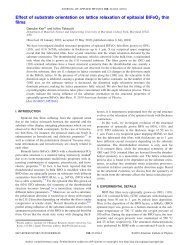
www.afm-journal.dewww.MaterialsViews.comFULL PAPERto this incompatibility, an elastic transition layer will form upontransformation, and both elastic energy and interfacial energy <strong>of</strong>the martensite twins will be stored. For some regimes <strong>of</strong> materialparameters (elastic moduli, transformation strain, and twinboundaryenergy) branching <strong>of</strong> the martensite becomes favorableand leads to a reduction <strong>of</strong> the total elastic plus interfacial energy atthe austenite/martensite interface. In either case the fullydeveloped austenite/martensite interface is associated <strong>with</strong> anenergy barrier that must be overcome during the forward andreverse transformation, thus giving rise to transformationhysteresis. [6,7] The energy dissipation that occurs during thecrossing <strong>of</strong> this barrier makes SMAs also useful as mechanicaldamping materials. [8]As the transformation hysteresis can be correlated to thecompatibility at the austenite/martensite interface and thecompatibility itself to the fatigue properties, a direct correlationbetween transformation hysteresis and fatigue properties for SMAis expected. The correlation between large inherent transformationhysteresis and poor functional fatigue properties for SMAscycled mechanically (pseudoelasticity) [9] or thermally (one-waySME) [10] has been well established. Thus, it is believed that thefunctional fatigue associated <strong>with</strong> the reversible martensitic phasetransformation can be reduced by developing SMAs <strong>with</strong>extremely small transformation hysteresis.In this paper, we demonstrate for the first time a targetedcombinatorial thin-film search <strong>with</strong>in a quaternary SMA thin filmsystem for which high-throughput measurements <strong>of</strong> thermalhysteresis and lattice parameters are implemented. Remarkably,our study leads to thin-film alloy compositions that have near-zerohysteresis, as determined by resistance measurements.Subsequently, we successfully transfer these thin-film results tobulk materials, and verify their substantially improved functionalstability against thermal cycling.ternary alloy systems (Ti–Ni–Pd, Ti–Ni–Pt, Ti–Ni–Au), a newtheory <strong>of</strong> hysteresis was recently proposed. [7] This theory is basedon the hypothesis that the main energy barrier, leading tohysteresis, arises from the growth <strong>of</strong> fully developed austenite/martensite interfaces. Thus, it highlights the fundamentalimportance <strong>of</strong> the l 2 ¼ 1 condition in order to find thermoelasticSMAs <strong>with</strong> near-zero DT. However, to date, no such compositionswere found for ternary Ti–Ni based SMAs. Therefore, a furthertuning <strong>of</strong> the lattice parameters by increasing the number <strong>of</strong>constituent elements, as proposed by James and Zhang, [12] isneeded. Specifically, they predicted that certain compositions<strong>with</strong>in the Ti–Ni–Cu–Pd alloy system would exactly fulfill thel 2 ¼ 1 condition. [12] This is reasonable, considering that the l 2values for Ti–Ni–Cu and Ti–Ni–Pd alloys showing a cubic (B2) toorthorhombic (B19) phase transformation were found to be closeto, but slightly smaller or greater, than 1, respectively. [6]In order to investigate the Ti–Ni–Cu–Pd system, we appliedthin-film sputter deposition <strong>of</strong> quaternary compositionspreads [16,17] and high-throughput characterization <strong>of</strong> the phasetransformationproperties (transformation temperatures, DT) andlattice parameters <strong>of</strong> martensite and austenite using temperaturedependentresistance measurements (R(T)) and synchrotron X-raymicrodiffraction (mXRD(T)), respectively (see Experimental fordetails).Figure 1 illustrates the composition variation <strong>of</strong> the quaternaryTi–Ni–Cu–Pd thin-film composition spread. The variation in Ticontent was confined to 47 to 64 at% (Fig. 1a) and the composition2. Results and DiscussionFor the search <strong>of</strong> thermoelastic SMAs <strong>with</strong> extremely smallthermal hysteresis width, the geometric non-linear theory <strong>of</strong>martensite (GNLTM) [11–14] has provided successful theoreticalguidance. [6] The theory describes several conditions in order for aSMA to show extremely low hysteresis. The first condition, detU ¼ 1, where Uis the transformation stretch matrix, represents thecondition <strong>of</strong> ‘‘no volume change.’’ The second condition, l 2 ¼ 1,where l 1 l 2 l 3 are the ordered eigenvalues <strong>of</strong> the transformationstretch matrix U, represents the presence <strong>of</strong> an invariant planebetween austenite and martensite, that is, ‘‘a perfectly coherentinterface.’’ At such an interface, the energy contributions to thebulk energy through the presence <strong>of</strong> an elastic transition layer orthe interfacial energy <strong>of</strong> fine arrays <strong>of</strong> twin bands is eliminated,thus leading to a decrease in the width <strong>of</strong> the thermal hysteresis(DT). Recently, microstructural investigations <strong>of</strong> Ti 50 Ni 50–x Pd xalloys by TEM confirmed the existence <strong>of</strong> twinless martensite atsuch perfect austenite/martensite interfaces for Ti 50 Ni 39 Pd 11 . [15]Using a combinatorial method, the predicted correlationbetween l 2 and DT was previously confirmed <strong>with</strong>in theTi–Ni–Cu system, whereas only a weak correlation between DTand volume change (det U) was found. [6] In view <strong>of</strong> thisexperimental evidence and based on investigations <strong>of</strong> otherFigure 1. Investigated compositions in the quaternary Ti–Ni–Cu–Pd thinfilmcontinuous composition spread plotted <strong>with</strong>in a) a section <strong>of</strong> thequaternary composition space, Ti contents: 47–64 at% and b) a projection<strong>of</strong> the quaternary composition space (tetrahedron) onto a pseudo-ternaryNi–Cu–Pd section. Color coding details are given in the text (visualizationby <strong>Quaternary</strong>Viewer [16]). Inset in b) shows a typical R(T) curve exhibitinga reversible phase transformation. Additionally the phase-transformationtemperatures O s, O f , A s , and A f are indicated as determined by the tangentmethod.1918 ß 2010 WILEY-VCH Verlag GmbH & Co. KGaA, Weinheim Adv. Funct. Mater. 2010, 20,1917–1923
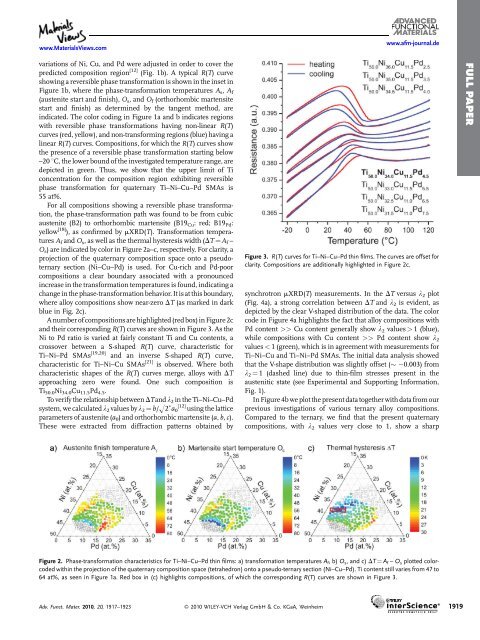
www.MaterialsViews.comwww.afm-journal.devariations <strong>of</strong> Ni, Cu, and Pd were adjusted in order to cover thepredicted composition region [12] (Fig. 1b). A typical R(T) curveshowing a reversible phase transformation is shown in the inset inFigure 1b, where the phase-transformation temperatures A s , A f(austenite start and finish), O s , and O f (orthorhombic martensitestart and finish) as determined by the tangent method, areindicated. The color coding in Figure 1a and b indicates regions<strong>with</strong> reversible phase transformations having non-linear R(T)curves (red, yellow), and non-transforming regions (blue) having alinear R(T) curves. Compositions, for which the R(T) curves showthe presence <strong>of</strong> a reversible phase transformation starting below–20 8C, the lower bound <strong>of</strong> the investigated temperature range, aredepicted in green. Thus, we show that the upper limit <strong>of</strong> Ticoncentration for the composition region exhibiting reversiblephase transformation for quaternary Ti–Ni–Cu–Pd SMAs is55 at%.For all compositions showing a reversible phase transformation,the phase-transformation path was found to be from cubicaustenite (B2) to orthorhombic martensite (B19 Cu : red; B19 Pd :yellow [18] ), as confirmed by mXRD(T). Transformation temperaturesA f and O s , as well as the thermal hysteresis width (DT ¼A f –O s ) are indicated by color in Figure 2a–c, respectively. For clarity, aprojection <strong>of</strong> the quaternary composition space onto a pseudoternarysection (Ni–Cu–Pd) is used. For Cu-rich and Pd-poorcompositions a clear boundary associated <strong>with</strong> a pronouncedincrease in the transformation temperatures is found, indicating achange in the phase-transformation behavior. It is at this boundary,where alloy compositions show near-zero DT (as marked in darkblue in Fig. 2c).A number <strong>of</strong> compositions are highlighted (red box) in Figure 2cand their corresponding R(T) curves are shown in Figure 3. As theNi to Pd ratio is varied at fairly constant Ti and Cu contents, acrossover between a S-shaped R(T) curve, characteristic forTi–Ni–Pd SMAs [19,20] and an inverse S-shaped R(T) curve,characteristic for Ti–Ni–Cu SMAs [21] is observed. Where bothcharacteristic shapes <strong>of</strong> the R(T) curves merge, alloys <strong>with</strong> DTapproaching zero were found. One such composition isTi 50.0 Ni 34.0 Cu 11.5 Pd 4.5 .To verify the relationship between DTand l 2 in the Ti–Ni–Cu–Pdsystem, we calculated l 2 values by l 2 ¼ b/H2 a [12] 0 using the latticeparameters <strong>of</strong> austenite (a 0 ) and orthorhombic martensite (a, b, c).These were extracted from diffraction patterns obtained byFigure 3. R(T) curves for Ti–Ni–Cu–Pd thin films. The curves are <strong>of</strong>fset forclarity. Compositions are additionally highlighted in Figure 2c.synchrotron mXRD(T) measurements. In the DT versus l 2 plot(Fig. 4a), a strong correlation between DT and l 2 is evident, asdepicted by the clear V-shaped distribution <strong>of</strong> the data. The colorcode in Figure 4a highlights the fact that alloy compositions <strong>with</strong>Pd content >> Cu content generally show l 2 values > 1 (blue),while compositions <strong>with</strong> Cu content >> Pd content show l 2values < 1 (green), which is in agreement <strong>with</strong> measurements forTi–Ni–Cu and Ti–Ni–Pd SMAs. The initial data analysis showedthat the V-shape distribution was slightly <strong>of</strong>fset ( 0.003) froml 2 ¼ 1 (dashed line) due to thin-film stresses present in theaustenitic state (see Experimental and Supporting Information,Fig. 1).In Figure 4b we plot the present data together <strong>with</strong> data from ourprevious investigations <strong>of</strong> various ternary alloy compositions.Compared to the ternary, we find that the present quaternarycompositions, <strong>with</strong> l 2 values very close to 1, show a sharpFULL PAPERFigure 2. Phase-transformation characteristics for Ti–Ni–Cu–Pd thin films: a) transformation temperatures A f ,b)O s , and c) DT ¼ A f – O s plotted colorcoded<strong>with</strong>in the projection <strong>of</strong> the quaternary composition space (tetrahedron) onto a pseudo-ternary section (Ni–Cu–Pd). Ti content still varies from 47 to64 at%, as seen in Figure 1a. Red box in (c) highlights compositions, <strong>of</strong> which the corresponding R(T) curves are shown in Figure 3.Adv. Funct. Mater. 2010, 20,1917–1923 ß 2010 WILEY-VCH Verlag GmbH & Co. KGaA, Weinheim 1919