PARAMETRIC STUDY OF REACTIVE MELT INFILTRATION f
PARAMETRIC STUDY OF REACTIVE MELT INFILTRATION f
PARAMETRIC STUDY OF REACTIVE MELT INFILTRATION f

Create successful ePaper yourself
Turn your PDF publications into a flip-book with our unique Google optimized e-Paper software.
1:" i2.M. 5.IAI\, ".-..", " M. (eJ~"'''''' tv:i. 5",14""'-(1., ·v\.ci S i.v"'f'c-. AMI) -Vel L3~J Apf;i.
Proceedings of the 1999 International Mechanical Engineering Congress and ExpositionNovember 14-19, /999, Nashville, TennesseeReaction-formed silicon carbide is chosen as a modelsystem for this study. The production of monolithic siliconcarbide system is appealing because the chemistry andpreform geometry are reasonably well characterized. We wiltfocus on infiltration that is driven solely by capillary pressure.The relevant thermophysical properties of the chemicalconstituents are given in Table 1.Table 1. Thermophysical properties of silicon, carbon.and silicon carbide.Property Si C SiCp (kg/m 3 ) 2400 1500 3120~ (kg/m·s) 5 x 10"'"MW (kglkmol) 28.1 12.0 40.1~ (m 3 Ikmol) 0.0117 0.008 0.0128Although the absolute viscosity of liquid silicon, J.1. is aweak function of temperature (Turovskii and Ivanova, 1974).we will neglect any temperature dependence. Note that thespecific molar volume, u t • varies substantially among thespecies. In fact, the volume occupied by a mole of SiC isapproximately 35% smaller than that of a mole each of Si andC. Based on overall mass conversion, Singh and Behrendtcomputed that the critical porosity,
Proceedings of the 1999 International Mechanical Engineering Congress and ExpositionNovember 14-19, 1999. Nashville. Tennesseeis introduced at the bottom of the preform and wicks up intothe preform due to capillary action.The general form for the conservation of mass is given foreach of the species by:~(PJiP/) + V . (p,iPii,) = R, 1= Si, C, SiC (2)atwhere Rt is the rate of production/destruction of species I ,and ;, is the species volume fraction. i.e .• the fraction of thevolume occupied by species I. The species volume fractionmust obey the constraints 0 ~ ;, ~ I and L,;, ~ 1. In anyregion that is completely filled, "i.,;, = 1. Since overall massmust be conserved, the conservation equation for the totalmass in the system is subject to the constraint "i. lRe = O. Theliquid phase, comprised of a single component. i.e., Si, is theonly phase with a nonzero velocity.We will model this process as a zeroth-order chemicalreaction. For stoichiometric conversion, this exothermicreaction is given by Sf + C -4 SiC • so that the local productionof species can be expressed as:R, = fJ 1] MH~ (3)where p = + I for the product and -I for the reactants, 11 is thenumber of moles consumed per unit time, and MH't is thespecies molecular weight. We note that none of the speciescan be updated to a negative value. Since we are providedwith an abundant source of Si, the amount of C availablelocally will limit the chemical conversion. Therefore, when allafthe C has been consumed locally, the chemical reactioncomes to a halt in that region.We will make the critical assumption that the overallvolume of the preform remains constant (Singh and Behrendt.1992). Using the above assumptions, the overall conservationof mass can be written as:V . (iPs/us,) = lJ('i StC - 'i.\'j - 'ic ) (4)where ~ := M~ I Pi is the specific molar volume.The expression for 11 is found by relating the geometricdescription of the pore closure to that obtained from theconservation of mass. The volume fraction of the solid phaseis 4> .. = tPc + ¢s,c' From mass conservation, the change insolid volume fraction with respect to time is:d.~ _ a;c iJ;SiC-----+--at at at (5)= 1] ('isle - fie)If we envision the preform porosity to be comprised of abundle of parallel capillary tubes, then the permeability for thismodeJ is found by:r2K=--(6)8where r is the pore radius and is the porosity (s = 1-
Proceedings of the J 999 International Mechanical Engineering Congress and ExpositionNovember 14-19, 1999, Nashville, Tennesseethe sidewalls. This ensures that the liquid silicon from thebath will not wick up the sidewalls, and that no fluid will escapefrom the system through the sidewalls. Therefore,homogeneous Neumann boundary conditions are applied tothe pressure at the side boundaries.After the pressure solve, we can directly calculate thevelocity from the pressure field by using d'Arcy's law, Eq. (9).The normal component of velocity at the sidewalls is zero, dueto the homogenous Neumann boundary condition used on thepressure field. Although we would expect some tangentialvelocity slip in the immediate vicinity of the sidewalls, theseeffects are confined to distances on the order of a porediameter (Kaviany, 1991). Therefore, we will assume that, atthe left and right boundaries. fJv/ox = O. In this set ofnumerical simulations, the infiltration process is essentiallyone-dimensional, as in experimental work of a similar process(Einset. 1993). This can be expected due to uniform initialporosity and pore size, the choice of boundary conditions onpressure and velocity, and the simplicity of the chemistry andpermeability models.The derivation of the energy equation, as well as the fulldetails of the above derivations. can be found in Nelson (1998)or Nelson and ColeUa (1999a, b).NUMERICAL PROCEDUREThe equations derived above are used to develop a finitevolumealgorithm for reactive melt infiltration. The discreteformulation in two dimensions is discussed in Nelson (1998)and Nelson and Colella (1999a). Briefly, the macroscopicvelocity is used to advance the front on a fixed mesh using afront-tracking technique developed by Chern and Colella(1988). coupled with a volume-of-fluid method and frontreconstruction. Chemical reaction is allowed to occur basedon the local species volume fractions and local reaction time.The updated species volume fractions are used to form a newpermeability field. Next, a Poisson problem is solved on theinfiltrated region only to find the new pressure field, using thetechnique of Johansen and Colella (1998). Fina"y, d'Arcy'slaw is used to find the new velocity field. The process isrepeated until all of the C in the preform is consumed or thefinal simulation time is reached.The mesh size was 32x128 on a 0.01xO.04 m domain sothat the mesh spacing Ax = Liy = 0.0003125 m. A descriptionof the discrete equations. as well as the effects of gridresolution and other sources of numerical error are discussedin Nelson and Colella (1999a) and Nelson (1998).RESULTSIn this section, we will explore the effects of varyingreaction rate, initial porosity and initial pore radius.Effect of reaction rateWith the initial porosity fixed at 0.50 and the initial poreradius at 0.17 Ilm, the infiltration curves for reaction rates of O.10. 9 , 10-8, and 10. 7 mls are shown below in Fig. 2. Thecapillary pressure corresponding to this case is 6.99x10 6 Pa.Fig. 2(a) presents the location of the front at the centerline,Yf(t) I while Fig. 2(b) shows yj2(t).I n the absence of chemical reaction, Y I (t) exhibits asquare-root dependence, and the slope of YI 2 (f>. called theintrinsic infiltration rate (Hillig, 1994b) and denoted as ~, isconstant. The front reaches the upper boundary of thepreform, located at 0.04 m, at I j=15.51 s.0.040.03Yf (m)0200010,00 O!---~~----"'I:-1=oO--~15(a)tillle (s)OJ)()2(b)time(s)Figure 2. Centerline infiltration profiles for $0 =0.50;ro =0.17 11m; kr =0 (1),10' 9 (2), 10-8 (3), and 10. 7 (4) m/s.(a) Yf(t) ; (b) y](t)For the chemical system of SilClSiC, the infiltrationprocess is retarded by the chemical reaction. For the lowreaction rate, kr =10. 9 mIs, the infiltration curves closely matchthe non reacting case for the first couple of seconds. After thatpoint, the front begins to lag behind the nonreacting case. Fig.2(b) shows that that ~ is not constant over this time interval.In contrast, Y f 2 for kr =10. 1 mls appears quite linear after halfa second. For kr =10-8 mIs, there is a short period of underone second during which the curves closely follow thenonreacting profiles. Up to about 8 seconds, the slope of yj2is continuously changing. After that time, ~ appears constant,nearly matching that of kr =10. 7 m/s.What explains this behavior? The infiltration movesthrough a sequence of flow regimes in which the forcesinduced by capillary action and by chemical reaction are incompetition (Nelson, 1998; Nelson and Colella, 1999a, b).Initially, the pressure forces dominate as the infiltrantimpulsively moves into the preform, indicated through theclose correspondence of Yt with the nonreacting case. Thiscan be seen in approximately the first two seconds of k, =10. 9mls and the first second of k, =10-8 m/s.In the second regime, the forcing term provided by thechemical reaction flares up and wanes. Within the preform,4
Proceedings of the 1999 International Mechanical Engineering Congress and ExpositionNovember 14-/9, 1999, Nashville, Tennessee-.e:. .:If ....!. :J( ~-:f""1:4..... ,. ..."(a) (b)1 ••,.iJiJE·'. 0,9'.J"f.ttio.eU€,'~~,.3f .••-l.,zf.t&Ill,IE-.IS2Ii ,M·,'• ...e.",I &.fM!:-UJ 0.4!-:::.......).£1(-'8t ·80.01 II,]'1ME- a(C)O.
Proceedings of the 1999 International Mechanical Engineering Congress and ExpositionNovember 14-19, J 999, Nashville, Tennessee0.0400.0020.0350.0300.025&0.020~0.015O.OlD0.0051:
Proceedings of the 1999 International Mechanical Engineering Congress and ExpositionNovember 14-19, 1999, Nashville, Tennesseecarry out the infiltration process to complete conversion forkr =10- 7 mls due to numerical instability; this is beingaddressed in a modified algorithm (Nelson and Colella,1999a).Notice that the most efficient reaction rate for infiltratingthe preform, Le., the lowest kr' does not imply the shortestconversion time, particularly at low initial porosities. Also notethat, as the reaction rate is increased at fixed porosity, thedifference between te,c and le.l decreases. It is zero for«1>0 =0.40, kr =10-8 mIs, indicating that the carbon behind thefront is essentially consumed as fast as the front can move.For kr =0, ~=1.0x10⁻⁴ mls over the range of porosity. Forkr =10-8 mls and 10- 7 mIs, we can see that ~ increases linearlywith porosity. We might expect this, because the permeabilityis proportional to the porosity, while capillary pressure remainsfixed. When chemical reaction occurs, the entry into the postreaction-dominatedregime is retarded as porosity decreases,reflecting the increased influence of the reaction-generatedforces on the infiltration dynamics. However, once in the postreaction-dominatedregime, the permeability in the fullyreacted zone behind the front is more influential on theinfiltration dynamics than the reaction-generated forces.3025 GI20105.04.54.03.5{ 3.0'2 2.5a...,. 2.0\,\\\(a)(b)\,~,-Go - - - --0D.55 0.60Figure 6. Influence of 0 in the post·reaction-ciominatedregime: (a) time of entry into this regime; and (b) intrinsicinfiltration rate.The time at which the infiltration moved from the reactiondominatedregime to the third post-reaction-dominated regime,13, shown in Fig. 6(a), was estimated from infiltration profiles.The intrinsic infiltration rate, ~, in this regime is presented inFig.6(b).Effect of initial pore radiusNext, we will examine the influence of the initial poreradius on the infiltration process, holding the porosity fixed at0 =0.50 and varying the reaction rate, kr' to 0, 10. 9 , 10-8,10- 7mls and the pore radius to 0.10, 0.14, 0.17 and 0.20 ~m. Thecapillary pressure corresponding to these pore radii rangesfrom 5.94x10 6 Pa to 1.88x10 7 Pa (see Eq. (11». For clarity,the infiltration curves are presented in sets by reaction rate inFig. 7 for the first 30 seconds of the infiltration.Decreasing pore radius retards the infiltration, asobserved by Einset (1996) experimentally. Ignoring thechemical reaction for the moment, this would be expectedsince the capillary pressure is inversely proportional to ro,while the permeability is proportional to ro2. Unlike theparameterization in porosity, the curves for k, =0 and 10. 9 mlsdo not collapse onto one another in Figs. 7(a) and (b). Wealso see the effects of chemistry in the curves for k, =10-8 and10- 7 mls in Figs. 7(c) and (d).The curves for k, =10. 9 mls (Fig. 7(b» are nearlyequivalent to the corresponding nonreacting case for the firstsecond or two. All of the preforms at this reaction rate are fullysaturated by 30 seconds except for 'b =0.10 j.lm. The intrinsicinfiltration rate, ~, shown in Fig. 7(t) is not constant for any ofthe pore radii over this time interval.The characteristic bump in the infiltration profile due to thepresence of the reaction-dominated regime is seen mostclearly in Fig. 7(c) for k, =10-8 mls under 10 seconds. Thecorresponding slope of y;'(t) in Fig. 7(9) is not linear duringthis time. The infiltration has moved beyond the reactiondominatedregime by 10 seconds in Fig. 7(c). This occursmore quickly for the higher reaction rate in less than a secondin Fig. 7(d). From Figs. 7(g) and (h), we can see that ~appears constant once the infiltration process has left thereaction-dominated regime.7
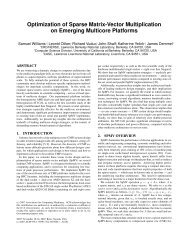
Proceedings of the /999 International Mechanical Engineering Congress and ExpositionNovember /4-/9, 1999. Nashville, Tennesseeo.ot0.04Yf (rn)0.030.20 020O.oI0,04}~j (rn)4..-_ ... --- 0.Q3/~ :::=~~~~;-~-~-X;~-~ -~---. 0101./ ~.~",. "",,'"I kr = 10- I80.00 Or,-.-........... -'-*l O,..........-"-~20~ ........... ~0 0.00 0~--'-'r-I>r--'--"""2~O--'-----'"-3r.JO 0.00 O'---~I 0:'-----:-20~-""""':::'!~ 300.00 0 10 20time (s) lime (s) time (s) time (5)(a) (b) (c) (d)0.002 0,0020,002YJ tm2)Ikr=tQ-1 I0.001 0,001OJ)OOo10 2030 0,000 0 10 20 30 0.00°0 10 2030 0,000 0 10 20time (s) lime (s) lime (s) lime (s)(e) (f) (g) (h)Figure 7. Effect of '0 on infiltration profiles for c:t>o =0.50; '0 =0.10 (1), 0.14 (2), 0.17 (3) and 0.20 (4) IJ.m: (a) Y IV), kr =0.0; (b)y{(t), k r =10·9 m/s; (c)Yf(t), k r =10-8 m/s; and(d)Yf(t), k r =10·7 m/s;(e)Y](I), kr=O.O;(f)y](t), k r =10"m/s; (9)YI(t). kr =10-8 m/s; and (h) YJ (I), kr =10. 7 m/s.The dependence of the total infiltration and conversiontimes on pore radius is shown in Fig. 8. A wide gap is onceagain apparent between le,l and le.r for kr =10. 9 m/s (unfilledand filled circles). For the lowest pore radius and readion rate(filled circle, left of arrow), the infiltration process had movedwell beyond the reaction-dominated regime when the upperboundary was encountered. On the other hand, much of theconversion took place in a fully saturated preform for the largerpore radii {filled circles, right of arrow}. Recall that, for a fullysaturated preform, the pore radius decreases linearly withtime, Eq. (1), to complete conversion. The trend of increasingle,r with increasing radius at high pore radii therefore indicatesthat, under these conditions. the absence of the front reducesthe effediveness of the conversion.Figure 9 shows the influence of pore radius on the start ofthe post-readion-dominaled regime and on the intrinsicinfiltration rate. Fig. 9(a) indicates that decreasing pore radiusreduces the temporal extent of the readion-dominated regime,an effed which is most pronounced at the lower reaction rate.Unlike the porosity-dependent parameterization, ~ is notconstant for kr =0 (squares), but rather increases withincreasing pore radius, due to increasing permeability. Asbefore, we should expect this because the capillary pressure isinversely proportional to ro ' while the permeability isproportional to rC. Fig. 9(b) indicates that ~ is linearlyproportional to ro and is not affected greatly by the reactionrate. These results imply that the infiltration in the postreaction-dominatedregime is governed primarily by thepermeability of the preform in the reacted zone behind thefront and by the capillary pressure.ISO'25tOOLil~ 7S-...Q..."--e- k,~;t ...1.50ro (x10' 1 m)- -0- - k,-,o·';to,J-.~.- k,-10-8; t.J- ___ - k,-tO"; t..,- • ...-.- k._tO·e;t ....Figure 8. Influence of ro on required time for completeinfiltration (unfilled symbols) and complete conversion(filled symbols) for kr =0, 0; 10. 9 • a; and 10-8 mis, +.8
Proceedings of the 1999 International Mechanical Engineering Congress and ExpositionNovember 14-19. 1999, Nashville, Tennessee1412102.-.-.-.-.-.~.-.-.-.-~.-.-.-.-~o 1.00 1.25 1.50 1.75 2.00(a) ro (x'o'? m)111.25 1.50(b) ro (x10·7 m)Figure 9. Influence of 'b in the post-reaction-dominatedregime: (a) time of entry into this regime; and (b) intrinsicinfiltration rate.CONCLUSIONSWe have examined the infiltration of liquid Si into aconstant-volume microporous C preform to form a monolithicSiC ceramic composite for the range of 0 =0.40-0.60,ro =0.10-0.20 ~m, and kr =0, 10. 9 , 10-8, 10. 7 m/s. The initialpore radius and porosity were uniform over the entire preform.We have seen that the infiltration dynamics are dependenton reaction rate, initial porosity and initial pore radius.Significantly, it is also a function of the flow regime arising fromthe competition between pressure and reaction forces. We didnot find a simple correlation for the time and distanceassociated with the reaction-dominated regime. However,numerical simulation can be used to predict these details.Initially, the pressure forces dominated as the infiltrantimpulsively entered the preform. later, the presence of thechemical reaction retarded the infiltration due to a competitionbetween the pressure forces and the volumetric forces due tothe chemical conversion. When the reactants in the entry tothe preform were consumed, the reaction zone was confinedto a small region behind the front. Furthermore, the infiltrationrate increased, although it was significantly smaller than that ofthe corresponding nonreacting case.In the first pressure-dominated regime and the earlystages of the second reaction-dominated regime, a porosityincrease of 50% had a negligible effect on the infiltrationprofiles, as seen in the data for kr =0 and 10. 9 m/s.The reaction-generated forces may impede or enhancethe flow, depending on the density variation among theproducts and reactants. For the SilClSiC system with a denseproduct, the conversion was shown to retard the flow. Thetemporal and physical extent of the reaction-dominated regimedecreased with increasing reaelion rate, decreasing poreradius and increasing porosity. In this regime, the velocitywithin the preform was retarded significantly due to thecurvature of the pressure profiles, causing a characteristicbump in the infiltration profiles. Theoretically, the flow canbecome stationary at the front; this is to be distinguished fromchoking in that this is a temporary phenomenon. For *r = 10-8mIs, the reaction-dominated regime was in evidence fromabout 2 to 10 seconds, while it was completed by one secondfor *r = 10- 7 m/s. The intrinsic infiltration rate was not constantin this regime. indicating that the location of the front did nothave a square-root dependence on time. Aside from theimplications on infiltration dynamics, the maximum processtemperature was found, in previous work, to occur in thisregime. The reaction-dominated regime ended soon after thecarbon in the initial entry zone was completely consumed.Beyond the reaction-dominated regime, the infiltrationsettled into a simpler pattern. The reaction zone was localizedto an area just behind the front. The intrinsic infiltration ratewas constant and proportional to the initial porosity and to theinitial pore radius. Although the permeability is proportional tothe square of the pore radius, the capillary pressure isinversely proportional to the pore radius, accounting for thisbehavior. The intrinsic infiltration rate was not greatlyinfluenced by the magnitude of the reaction rate in this regime.We therefore deduce that the infiltration was primarily affectedby the capillary pressure at the front and the permeability inthe fully reacted zone behind the front. Consequently, theintrinsic infiltration rate can be characterized by a constantbeyond the reaction-dominated regime, although the linerepresenting ~t must be offset from the origin to coincide withthe data.For this system, numerical simulation of the parameterspace provides the best prediction of optimal parameters forminimum conversion time. For an actual process, we shouldalso include preform length as a parameter, as that will affectwhether or not the process leaves the reaction-dominatedregime. For kr = 10. 9 mIs, the infiltration was completedduring the early stages of the reaction-dominated regime,except at the smallest pore radii. If the entire preform9
Proceedings o/the /999 International Mechanical Engineering Congress and ExpositionNovember 14-19, 1999, Nashville, Tennesseereached saturation during this time, the overall conversion timewas seen to increase with increasing pore radius. since theevolving pore radius decreased strictly linearly with time, asset by the chemistry of the system. In contrast, if theinfiltration moved into the post-reaction-dominated regime. asseen at lower pore radius, the conversion time decreased withincreasing pore radius. The presence of the advancing front,with its accompanying complex infiltration dynamics. can eitherimprove or reduce the efficiency of the conversion process,depending on the initial parameters. If the infiltration wasallowed to proceed through the sequence of infiltrationregimes, the overall conversion time decreased withincreasing porosity. pore radius and reaction rate.This sort of analysis could provide insight into the designof functionally graded materials. For example. localmodification of the pore radius or porosity in the post-reactiondominatedregime could be used to speed up the infiltrationrate. Such a modification in the reaction-dominated regimecould have major implications on the efficiency of the process.The advantage of a numerical simulation is that it could rangeover the desired parameter space with minimal effort allowingfor more precise optimization.AcknowledgmentsThe authors would like to acknowledge NASA GlennResearch Center and the Department of Energy for theirsponsorship of this work. The authors would also like to thankJay Singh and Arnon Chait for their insightful review of thispaper.ReferencesBehrendt. D.R. "Porous silicon carbide as a matrix forceramic composites." NASA TM BBB37 (1986).Behrendt, D.R. and M. Singh. "Effect of carbon preformpore volume and infiltrants on the composition of reactionformedsilicon carbide materials." J Mat Synthesis andProcessing 2: 117-123 (1994).Behrendt, D.R. and M. Singh. wTheoretical considerationsfor reaction-formed silicon carbide. n NASA TM 106414 (1993).Brandes, E.A., ed. Smithells Metals Reference Book, 6 thed. Butterworths (1983).Chern. I-L and P. Colella. "A conservative front trackingmethod for hyperbolic conservation laws". Unpublished paper(1988).Datta. S.K., N. Simhai, S.N. Tewari. J.E. Gatica, and M.Singh. "Permeability of microporous carbon preforms." MetTrans A 27A:3669-74 (1996).Einset, E. O. Private communication (1993).Einset, E. O. "Capillary infiltration rates into porous mediawith applications to Silcomp processing." J Am Ceram Soc79:333-338 (1996).Fitzer, E. and R. Gadow. "Investigations of the reactivity ofdifferent carbons with liquid silicon." In Proceedings ofInternational symposium on ceramic components for engines.Japan, 1983. KTK Scientific Publishers. Tokyo, Japan (1984).Haggerty, J.S. and Y.M. Chiang. "Reaction-basedprocessing methods for ceramics and composites." CeramEng and Sci Proc 11:757-781 {1990}.Hillig, W.B. UMaking ceramic composites by meltinfiltration." Am Ceram Soc Bull 73:56-62 (1994).Hillig, W.B. "Melt infiltration approach to ceramic matrixcomposites." Am Ceram Soc, Comm 71:C-96 to C-99 (1994).Hillig. W.B., R.L. Mehan, C.R. Morelock, V.J. DeCarlo andW. Laskow. "Silicon/silicon carbide composites." AmerCeram Soc Bull 54:1054-56 (1975).Johansen, H. and Colella. P. "A Cartesian grid embeddedboundary method for Poisson's equation on irregulardomains." J Comp Phys 147:60-85 (1998).Kaviany, M. "Principles of heat transfer in porous media."Springer-Verlag (1991).Kochendoerfer, R. "Liquid silicon infiltration: a fast andlow-cost CMC manufacturing process." In Composites:Proceedings of the 8th International Conference on CompositeMaterials. Held in Honolulu. HI, July 15-19, 1991, pp. 23-F-1 to23-F-9.3 (1991).Li, J.G. and H. Hausner. "Wettability of silicon carbide bygold, germanium and silicon." J Mat Sci Ltrs 10:1275-76(1991).Messner, R. and Y.M. Chiang. "Liquid-phase reactionbondingof silicon carbide using aUoyed Si-Mo melts." J AmerCeram Soc 73:1193 (1990).Minnear, W.P. "Interfacial energies in the Si/SiC systemand the Si+C reaction." J Amer Ceram Soc 65:C10·C11(1982).Nelson, E.S. wA numerical algorithm for the simulation ofreactive melt infiltration." Ph.D. Thesis. University of Californiaat Berkeley (1998).Nelson, E.S. and P. Colella. fAA numerical algorithm forreactive melt infiltration." To be submitted to J Comp Phys(1999a).Nelson, E.S. and P. Colella. "Infiltration dynamics inreactive melt infiltration." To be submitted to J Amer CeramSoc (1999b).Sangsuwan. P., S.N. Tewari. J.E. Gatica, M. Singh and R.Dickerson. ~Reactive infiltration of silicon melt throughmicroporous amorphous carbon preforms." To appear in MetTrans A (1998).Singh, M. and D.R. Behrendt. "Reactive melt infiltration ofsilicon-molybdenum alloys into microporous carbon preforms."Mat Sci Eng A 194:193-200 (1995).Singh. M. and D.R. Behrendt. "Microstructure andmechanical properties of reaction-formed silicon carbide(RSFC) ceramics." Mat Sci Eng A 187:183-187 (1994).Singh, M. and D.R. Behrendt. "Reactive melt infiltration ofsilicon-niobium alloys in microporous carbons." J Mat Res7:1701-1708 (1994).Singh. M. and D.R. Behrendt. "Studies on the reactivemelt infiltration of silicon and silicon-molybdenum alloys inporous carbon." NASA TM 105860 (1992).10
Proceedings of the 1999 International Mechanical Engineering Congress and ExpositionNovember 14-19, 1999, Nashville, TennesseeTurovskii, 8.M. and 1.1. fvanova. "Temperaturedependence of the viscosity of fused silicon." InorganicMaterials 10:2108-2111 (1974),Whalen, T.J. and A.T. Anderson. "Wetting of SiC, ShN-4.and carbon by Si and binary Si alloys," J Am Ceram Soc58:396-399 (1974).11