Aquatic System - Toronto and Region Conservation Authority
Aquatic System - Toronto and Region Conservation Authority
Aquatic System - Toronto and Region Conservation Authority

Create successful ePaper yourself
Turn your PDF publications into a flip-book with our unique Google optimized e-Paper software.
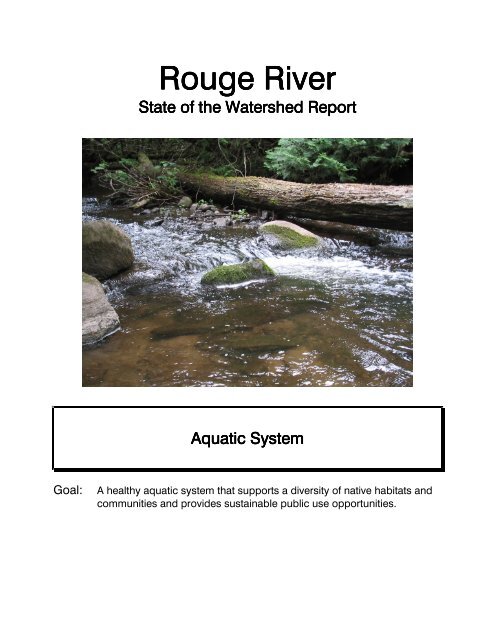
Rouge RiverState of the Watershed Report<strong>Aquatic</strong> <strong>System</strong>Goal:A healthy aquatic system that supports a diversity of native habitats <strong>and</strong>communities <strong>and</strong> provides sustainable public use opportunities.
<strong>Aquatic</strong> <strong>System</strong>Key Findings:• Based on the hydrogeologic conditions <strong>and</strong> fish community, the upper subwatersheds of the Main Rouge<strong>and</strong> Little Rouge River were historically coldwater habitat. Although this high quality habitat still characterizesthe headwaters, past clearing for agricultural practices <strong>and</strong> more recent urbanization as well as the presenceof dams <strong>and</strong> on-line ponds have resulted in more of these streams shifting to a cooler, <strong>and</strong> in some reaches,warmwater condition.• Middle reaches across the watershed were historically cool to warm water environments with the expectationof the thermal regime <strong>and</strong> instream habitat to support the greatest fish biodiversity in the watershed.Influenced by the Milne reservoir, the current conditions in the middle reaches of the Main Rouge River arelargely warmwater, relatively homogenous habitat <strong>and</strong> fewer specialist fish species than historically sampled.• The lower portion of the watershed is large riverine, warmwater habitat through the main stems <strong>and</strong> providesmigratory routes for lake-run fish species <strong>and</strong> generalist species that are resident. Some local contributionsof groundwater to smaller branches off the Main Rouge River support cooler habitat conditions but diversityis generally low, until the mouth of the river where lake effect <strong>and</strong> coastal marsh habitat result in a rise inspecies diversity. The relatively natural l<strong>and</strong>scape that is Rouge Park dominates the lower drainage basin ofthe Little Rouge River <strong>and</strong> helps to maintain the high quality habitat that supports a diverse warmwater fishcommunity.• Redside dace, a species of special concern federally listed under the Species at Risk Act <strong>and</strong> as anendangered species at the Provincial level, have been documented through the watershed study area overmany years; abundant <strong>and</strong> healthy populations still persist in the upper reaches of the Main <strong>and</strong> Little RougeRiver. There are smaller populations present in the mid <strong>and</strong> lower reaches of the Main Rouge River butwhere current habitat is no longer considered optimal for this species.• In addition to redside dace, the fish community within the Rouge River watershed has a number of othersensitive <strong>and</strong>/or indicator species such as brook trout, American brook lamprey, mottled sculpin <strong>and</strong>rainbow darter. Consistent with the stress of urbanization, the major impacts to all these species includeincreased flow velocities, increased turbidity <strong>and</strong> siltation <strong>and</strong> general warming of stream temperatures.• Through the evaluation of a suite of aquatic <strong>and</strong> fisheries data, “stream health” ranged from “C – B+” (fair togood) in the upper reaches; “D – C” (poor to fair) in the middle reaches <strong>and</strong> “D” (poor) in the lower reaches.The overall watershed condition considers cumulative effects <strong>and</strong> is most appropriately measured at thebottom of the watershed, which received a grade of “C” or fair.• Round goby <strong>and</strong> rusty crayfish are both invasive species that have been recently found (2006) in theRouge River watershed. The Rouge River is treated for sea lamprey through the spring application ofa lampricide (TFM); recent fish sampling (2003 <strong>and</strong> 2005) has not recorded the presence of thisinvasive species in the Rouge River.• Recent stream temperature monitoring has indicated specific reaches of the Rouge River are thermallyunstable. In particular the upper reaches of both the Main <strong>and</strong> Little Rouge River, which may be largelyrelated to thermal impacts of on-line ponds <strong>and</strong> instream barriers. The high <strong>and</strong> fluctuating streamtemperatures in the lower Little Rouge River may be in response to no tree canopy, a very wide <strong>and</strong> relativelyshallow summer baseflow that receives radiant heat from large instream boulders exposed to “super” solarheating.• In 2006, a formal instream barrier assessment identified 253 that are issues for fish passage. Fromthese, 29 have been identified for priority management. Despite the presence of many barriers, the
Rouge River is unique in that migratory species can move from the mouth of the river through to theheadwaters of both the Main Rouge <strong>and</strong> Little Rouge River through the active management of MilneDam <strong>and</strong> Too Good fishways.• Both the total amount of riparian natural cover (65%) <strong>and</strong> the portion of that which is treed cover (38%) in theRouge River watershed is similar to what is measured in other moderately urbanized watersheds, resulting ingrade of “A” (excellent) for riparian natural cover <strong>and</strong> “B” (good) for proportionate tree cover.• The watershed target of “no consumption advisories beyond the monthly maximum of not more than 8 mealsper month” is achieved resulting in a grade of “A” (excellent) for this indicator. There are numerous knownrecreational angling locations in the Rouge River, including lower portions of the main stream, areas throughRouge Park <strong>and</strong> down at the marsh. Recommendations coming out of the updated Rouge River FisheriesManagement Plan would have increased angling opportunities considered in the Milne Reservoir.Summary of Current Conditions <strong>and</strong> Ratings:Objective:Protect, restore <strong>and</strong> enhance the health <strong>and</strong> diversity of native aquatic habitats,communities <strong>and</strong> species.Overall RatingFair Provide for sustainable fishing opportunities <strong>and</strong> the safe consumption of fish Good
TABLE OF CONTENTS8.0 AQUATIC SYSTEM .......................................................................................................... 8-18.1 Introduction.................................................................................................................. 8-18.2 Underst<strong>and</strong>ing the <strong>Aquatic</strong> <strong>System</strong> in the Rouge River Watershed........................... 8-28.3 Measuring <strong>and</strong> Evaluating the <strong>Aquatic</strong> <strong>System</strong> .......................................................... 8-38.3.1 Reporting <strong>Aquatic</strong> Data: Appropriate Scale <strong>and</strong> Metrics....................................... 8-68.3.2 Methodology: Field Data Collection <strong>and</strong> Indices Calculations............................... 8-88.4 Existing Conditions.................................................................................................... 8-138.4.1 Watershed Scale.................................................................................................... 8-138.4.2 Fisheries Management Zone Conditions .............................................................. 8-278.5 Objectives for the <strong>Aquatic</strong> <strong>System</strong> ............................................................................ 8-628.6 Summary <strong>and</strong> Management Considerations ............................................................ 8-708.7 References ................................................................................................................. 8-72LIST OF FIGURESFigure 8-1: High Groundwater Discharge Areas in the Rouge River (pink) .............................. 8-4Figure 8-2: Predicted Groundwater Flow Patterns Showing <strong>Region</strong>al Sources (longer tracklines) <strong>and</strong> Local Sources (short track lines)........................................................... 8-5Figure 8-3: Target Species within Fisheries Management Zones ............................................. 8-7Figure 8-4: 2003/2005 Fisheries Sampling Sites (RWMP <strong>and</strong> FMP sites) ................................ 8-9Figure 8-5: Index of Biotic Integrity (IBI) Scores for all RWMP Sites ....................................... 8-14Figure 8-6: Fish Canonical Correlation Analysis (CCA) Scores Analyzed for 2002 L<strong>and</strong>coverTypes..................................................................................................................... 8-15Figure 8-7: Measured Thermal Regime ................................................................................... 8-17Figure 8-8: Thermal Stability..................................................................................................... 8-18Figure 8-9: Priority Instream Barriers ....................................................................................... 8-25Figure 8-10: Existing Conditions <strong>and</strong> Issues in Upper Main Rouge River (FMZ 1) ................ 8-28Figure 8-11: Existing Conditions <strong>and</strong> Issues in Middle Reaches of Main Rouge River (FMZ 10)............................................................................................................................... 8-32Figure 8-12: Existing Conditions <strong>and</strong> Issues in Berczy Creek (FMZ 2)................................... 8-36Figure 8-13: Existing Conditions <strong>and</strong> Issues in Bruce Creek (FMZ 3) .................................... 8-39Figure 8-14: Existing Conditions <strong>and</strong> Issues in the Headwaters of the Little Rouge River (FMZ4) ........................................................................................................................... 8-42Figure 8-15: Existing Conditions <strong>and</strong> Issues in Central Main Rouge River (Toogood Pond &Milne Reservoir) FMZ 5......................................................................................... 8-46Figure 8-16: Existing Conditions <strong>and</strong> Issues in Robinson Creek <strong>and</strong> Mt. Joy Creek (FMZ 6) 8-49Figure 8-17: Existing Conditions & Issues in Mid to Lower Reaches of the Little Rouge (FMZ 7)............................................................................................................................... 8-52Figure 8-18: Existing Conditions & Issues in Lower Main Rouge & Morningside Trib (FMZ 8).. 8-57Figure 8-19: Existing Conditions <strong>and</strong> Issues in Mouth of the Rouge River <strong>and</strong> Estuary (FMZ 9 8-60
LIST OF TABLESTable 8-1: Indices <strong>and</strong> Conditions/Criteria used by TRCA’s Benthic Aggregate Assessment(BAA,2004) ............................................................................................................ 8-10Table 8-2: Riparian Vegetation in the Rouge River Watershed ............................................... 8-19Table 8-3: Management Recommendations for Priority Barriers in the Rouge River Watershed............................................................................................................................... 8-21Table 8-4: 2007-2008 Sport Fish Consumption Guidelines*................................................... 8-26Table 8-5: Stream Health of Upper Main Rouge River - FMZ 1............................................... 8-29Table 8-6: Historic <strong>and</strong> Existing Fish Species in FMZ - 1 ........................................................ 8-31Table 8-7: Steam Health of Middle Reaches of Main Rouge River - FMZ 10.......................... 8-33Table 8-8: Historic <strong>and</strong> Existing Fish Species in FMZ 10 (Main <strong>and</strong> Beaver Creek) .............. 8-34Table 8-9: Stream Health of Berczy Creek - FMZ 2 ................................................................. 8-35Table 8-10: Historic <strong>and</strong> Existing Fish Species in FMZ 2 ........................................................ 8-37Table 8-11: Stream Health of Bruce Creek - FMZ 3................................................................. 8-40Table 8-12: Historic <strong>and</strong> Existing Fish Species in FMZ-3 ........................................................ 8-40Table 8-13: Stream Health of Little Rouge River - FMZ 4 ........................................................ 8-43Table 8-14: Historic <strong>and</strong> Existing Fish Species in FMZ 4 ........................................................ 8-44Table 8-15: Stream Health of Central Main Rouge River (Toogood Pond & Milne Reservoir)FMZ 5 .................................................................................................................... 8-47Table 8-16: Historic <strong>and</strong> Existing Fish Species in FMZ 5 ........................................................ 8-47Table 8-17: Stream Health of Robinson Creek <strong>and</strong> Mt. Joy Creek - FMZ 6............................ 8-50Table 8-18: Historic <strong>and</strong> Existing Fish Species in FMZ 6 ........................................................ 8-51Table 8-19: Stream Health of Mid to Lower Reaches of the Little Rouge River - FMZ 7......... 8-54Table 8-20: Historic <strong>and</strong> Existing Fish Species in FMZ 7 ........................................................ 8-55Table 8-21: Stream Health of Lower Main Rouge River <strong>and</strong> Morningside Tributary - FMZ 8. 8-58Table 8-22: Historic <strong>and</strong> Existing Fish Species in FMZ 8 ........................................................ 8-58Table 8-23: Historic <strong>and</strong> Existing Fish Species in FMZ 9 ........................................................ 8-61Table 8-24: Index of Biotic Integrity (IBI) Scores <strong>and</strong> Grade Equivalents ............................... 8-63
Unique Rouge River Watershed FeatureThe Rouge River Watershed provides the only Lake to Headwater MigratoryFish Passage through both Main Channel <strong>and</strong> Subwatersheds in TRCA’sJurisdictionCHAPTER8AQUATIC SYSTEM8.0 AQUATIC SYSTEM8.1 Introduction<strong>Aquatic</strong> management is a balance between biologically underst<strong>and</strong>ing what the system needsto maintain ecological integrity <strong>and</strong> the requirements, desires <strong>and</strong> values of humancommunities that occupy the l<strong>and</strong>scape. The link, which is imperative to recognize <strong>and</strong>accept, is that what happens overl<strong>and</strong> affects the structure <strong>and</strong> function of dynamics in thestreams. If this interdependency is supported by broader societal objectives <strong>and</strong> given priorityimportance, then alteration to the l<strong>and</strong>scape must be carried forward within the context ofexceptional levels of protection for sensitive <strong>and</strong> critical aquatic regimes. Managementstrategies have to provide the direction that effectively guards against structural <strong>and</strong> functionaldegradation of integrated natural systems.A logical management paradigm to operate under is one that has clear scientificdocumentation of the critical components that support a functioning ecosystem before anychanges or impacts might be sustained. These are the existing conditions, the benchmarks forwhich protection/restoration, at best, <strong>and</strong> mitigation, at the least, needs to be measured. Foraquatic systems, there is a continuum of instream considerations that shift from the headwatersdown to the mouth <strong>and</strong> include: fish <strong>and</strong> invertebrate species, biodiversity, invasive species,habitat structure <strong>and</strong> function, water quality, temperature, nutrient sources/processes, <strong>and</strong>barriers to fish passage. For the most part, these “metrics” are all influenced by key processesthat generally operate at larger, regional scales: groundwater regime (i.e. hydrogeology) <strong>and</strong>surface flow regime (i.e. hydrology, erosion, sediment/nutrient transport). In the absence of acomprehensive record of baseline conditions, there is little defensible recourse to directrestoration once a natural system has undergone major shifts. This report documents theexisting conditions using the most complete data sets, recent assessment tools <strong>and</strong> applyingexpert ecological underst<strong>and</strong>ing to organize, interpret <strong>and</strong> integrate aquatic themes with theother technical disciplines that ultimately influence overall stream health <strong>and</strong> associated bioticcommunities.8-1
The current rate <strong>and</strong> distribution of urbanization in the Rouge River watershed have seriousimplications around whether or not ecological integrity of the river system will persist in amanner that people have come to recognize <strong>and</strong> value. There is the ever present challenge toprotect fragmented habitat from further encroachment when faced with the rationale that “justone more culvert” isn’t going to matter. It becomes ever harder to push for better managementof systems already showing signs of some degradation. Both scenarios are issues ofcumulative impacts in that what happens upstream may seem locally benign or within anacceptable margin of change, but the additive results of altering influences or practices thatincrease in occurrence through the watershed can erode the system’s ability to buffer thenegatives impacts. The Rouge River Watershed Plan <strong>and</strong> Fisheries Management Plan (FMP)are the essential policy <strong>and</strong> resource documents (respectively) that will direct the bestopportunities for sound ecological management, but it is this State of the Watershed thatprovides the context <strong>and</strong> objective basis for determining priority protection of existing habitat oracceptable change in light of cumulative impacts.8.2 Underst<strong>and</strong>ing the <strong>Aquatic</strong> <strong>System</strong> in the Rouge River WatershedIt is likely that the condition of the Rouge River watershed aquatic habitats pre-Europeancontact had significant groundwater flow <strong>and</strong> therefore had more extensive coldwater habitats,with the exception of the lower Little Rouge River where the surficial geology suggests a moresurface water driven system. The conversion of the watershed from forest to agriculture largelyin the 19th <strong>and</strong> 20th centuries shifted the hydrology to more surface flow based <strong>and</strong> likelyincreased the proportion of the watershed that is dominated by more warmwater habitats.While there are headwaters in the watershed that continue to support remnant populations ofcoldwater species such as brook trout, there has been a general trend toward conversion ofhabitats to more warmwater types. For example, there are records of species such as greensunfish in headwater areas <strong>and</strong> an increasingly warmwater/generalist lacustrine-type fishcommunity in the mid parts of the watershed. Despite this trend, the relative abundance ofboth brook trout <strong>and</strong> redside dace (a minnow species considered Provincially “threatened” <strong>and</strong>a Federal “species of concern”) populations set the Rouge River system apart from other<strong>Toronto</strong> <strong>Region</strong> <strong>Conservation</strong> <strong>Authority</strong> (TRCA) watersheds. The presence of a naturalwarmwater fishery in the Little Rouge River, which has maintained good biodiversity in the faceof upstream l<strong>and</strong>scape change (agriculture <strong>and</strong> urban), also highlights the uniqueness of thiswatershed.The objectives for the aquatic component of the Rouge River Watershed Plan call formaintenance of existing conditions with recovery of past conditions, where possible. With thisas a base, we consider aquatic habitat degradation as any change in habitat structure orfunction that moves away from that objective. So, degradation includes not only theconversion of historic coldwater to warmer habitats but also cooling of historic or existingwarmwater habitats.The groundwater regime is a key factor in explaining existing aquatic habitat in the RougeRiver. Both local <strong>and</strong> farther reaching groundwater sources, i.e., discharge from the OakRidges Moraine (ORM), help to define <strong>and</strong> maintain the relatively good quality coldwaterhabitat in the headwaters. The cool water reaches appear more reliant on local groundwaterrecharge/discharge system, in particular Robinson Creek <strong>and</strong> Morningside Tributary. Althoughthe mid to lower reaches of the Little Rouge River are largely warm water, there are two first8-2
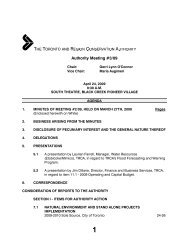
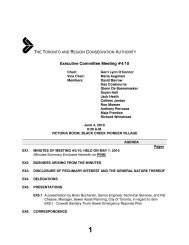
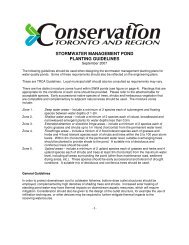
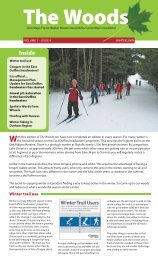
order coldwater tributaries that appear to have local groundwater sources (KatabokokonkCreek <strong>and</strong> unnamed tributary that both flow into the main branch of the Little Rouge).The groundwater model suggests that approximately 2/3 of groundwater discharge enters thesystem via small, low order streams (see Chapter 4 Groundwater). When integrated with thefisheries data, it is in these small streams that healthy populations of brook trout <strong>and</strong> redsidedace are predominately found. Challenges to maintaining existing groundwater flow regimesmay increase for streams reliant on local recharge/discharge as these areas are within theurbanizing boundary. Unless mitigated, the change in impervious cover during development inthis area of recharge may result in flow loss to these streams. Two figures illustrate thewatershed areas that are predicted to have high groundwater discharge (>2.5 L/s) based ongeology (Figure 8-1) <strong>and</strong> whether that groundwater is sourced locally (short tracks) orregionally (long tracks) (Figure 8-2). It is noted that the fisheries data <strong>and</strong> field knowledge oflocal stream habitat supports the groundwater model results.8.3 Measuring <strong>and</strong> Evaluating the <strong>Aquatic</strong> <strong>System</strong>There are two types of measurements taken to evaluate the aquatic system: biotic <strong>and</strong> abiotic.biotic measures refer to living organisms, both plant <strong>and</strong> animal. Species numbers, distribution<strong>and</strong> community structure can provide a good measure of environmental condition at the localsite level <strong>and</strong>, in some cases, over a larger region. Abiotic measures refer to physical orchemical factors that respond to environmental change. For example, other chapters havediscussed how human l<strong>and</strong> use change has altered watersheds by modifying channelstructure, altering baseflows, increasing the volume <strong>and</strong> frequency of runoff <strong>and</strong> peak flows,chemical contamination of ground <strong>and</strong> surface water, erosion <strong>and</strong> sediment loading <strong>and</strong>altering water temperature.Having identified the two categories of measures, the decision around which of the many biotic<strong>and</strong> abiotic metrics are chosen for an evaluation is fundamental to a meaningful analysis. Withthat, pinpointing thresholds at which ecological integrity is put at risk due to l<strong>and</strong>scape changeis a difficult procedure owing to the synergistic effects of changes to water quality, quantity,riparian vegetation, temperature, human use, <strong>and</strong> a host of other factors. By convention,knowledge of the natural physiographic setting coupled with indices that examine speciessensitivity to physical in-stream parameters (e.g. Fish <strong>and</strong> Invertebrate Indices of Biotic Integrityor other measures (e.g. stream thermal stability, baseflow <strong>and</strong> surface flows) have been usedto assess the aquatic system. While useful, there is still interpretation associated with thesetechniques <strong>and</strong> growing evidence that the current application (as a metric) of these commonlyused indices/measures may not be appropriate at large spatial scales or within the context ofan urbanized watershed. That is, the context <strong>and</strong>/or purpose for which some indices wereoriginally developed may not transfer well to measuring the impacts of change to thel<strong>and</strong>scape. Metrics that arguably have interpretive limitations will be identified <strong>and</strong> discussed inthe following section.8-3
Figure 8-1: : High Groundwater Discharge Areas in the Rouge River (pink)8-4
Figure 8-2: : Predicted Groundwater Flow Patterns Showing <strong>Region</strong>al Sources (longer tracklines) <strong>and</strong> Local Sources (short track lines)8-5
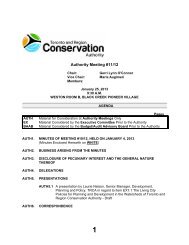
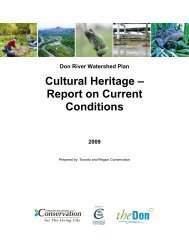
8.3.1 Reporting <strong>Aquatic</strong> Data: Appropriate Scale <strong>and</strong> MetricsEntire Watershed ScaleThere are different ways to present <strong>and</strong> discuss the various data used to evaluate an aquaticsystem’s health. A st<strong>and</strong>ard way is to report at the full watershed scale. This is appropriate formetrics that underlie the aquatic system, as they are arguably the drivers of instream conditionsthat change across a l<strong>and</strong>scape from source to mouth. Examples of such metrics are regionalgeology <strong>and</strong> associated hydrologic regime, stream slope, l<strong>and</strong>cover distribution (i.e. urban,agriculture, natural) <strong>and</strong> cumulative effects. Similarly, considering the fish community structure<strong>and</strong> thermal regime of the whole system, as it flows from headwaters to the lake, provides thecontext for management goals <strong>and</strong> strategies that have watershed wide implications (e.g.maintenance of a coldwater fishery would be very different than for a warmwater one).Other metrics that are not affected by spatial scale are simple linear measurements that aresummations of habitat availability or fragmentation across the watershed (e.g. riparian zonevegetation coverage or location of instream barriers). Social considerations, such as anglingopportunity <strong>and</strong> fish consumption issues are spatially discreet with no attempt to extrapolatethis data to other parts of the watershed, making watershed scale reporting inappropriate.Fisheries Management Zone ScaleFish Management Zones (FMZs) have been determined for the Rouge River watershed(technical explanation of the delineation of these zones appears in the Rouge River WatershedScenario Modelling <strong>and</strong> Analysis Report (TRCA, 2007) <strong>and</strong> Fisheries Management Plan (TRCAin progress). FMZs are reasonably consistent with subcatchment drainage areas <strong>and</strong> areconsidered fairly homogeneous in hydrology, geology <strong>and</strong> thermal regimes. Fish communitiesoccurring within these zones are also similar. These combined factors give strength to theargument that it is reasonable to extrapolate Fish Index of Biotic Integrity (IBI) scores, BenthicAggregate Assessment (BAA) scores, temperature instability ratings <strong>and</strong> baseflow indexcalculations for a site up to the fish management zone level. Summarizing these metrics into anoverall watershed interpretation (or higher) is less robust <strong>and</strong> introduces a bias towardsdegraded areas (Stanfield <strong>and</strong> Gibson, in review).The hydro-geologic footprint of any given FMZ is not common to the entire watershed <strong>and</strong>therefore assumptions used to interpret one area may not hold to another. A total of 10 FMZswere determined for the Rouge River watershed <strong>and</strong> are illustrated in Figure 8-3. Each FMZ isdiscussed in detail with respect to management issues, stream health <strong>and</strong> fish communitycharacteristics (see Section 8.4.2).For a comprehensive discussion on why certain metrics are considered appropriate only at thespecified spatial scales, which is a departure from past reporting of watershed health by TRCA(i.e. Report Cards), is provided in Appendix A of this chapter.8-6
Figure 8-3: Target Species within Fisheries Management Zones8-7
8.3.2 Methodologyology: Field Data CollectionC<strong>and</strong> Indices CalculationsIn 2001, TRCA established the <strong>Region</strong>al Watershed Monitoring Program (RWMP) to provide acomprehensive, integrated, <strong>and</strong> coordinated approach to environmental monitoring in theGreater <strong>Toronto</strong> Area. The program was designed to answer two basic questions: What is thecondition (i.e. health) of our watersheds <strong>and</strong>, is it changing over time? There are four broadmonitoring themes in the program, including <strong>Aquatic</strong> Habitat <strong>and</strong> Species, Terrestrial NaturalHeritage, Water Quality, <strong>and</strong> Water Quantity. RWMP site locations were selected to providesufficient area coverage for the watershed <strong>and</strong> associated subwatersheds <strong>and</strong> generally limitedto wadeable stream water depths (i.e. < 1 metre) as per the Ontario Stream AssessmentProtocol (OMNR, 2000 OSAP: version 2.1; Stanfield, 2005 version 7).It should be noted that monitoring sites selected through the RWMP could not be relied uponalone for full coverage of all habitats across the watershed which was required for the RougeRiver Fisheries Management Plan (FMP) process. Therefore, additional fish collection siteswere established for the FMP <strong>and</strong> this data is incorporated into the analysis of the watershed.Fish DataFish data presented in this chapter were derived from Fish Collection Records (OMNR),anecdotal reports, historic information (1940s – 1990s) <strong>and</strong> recent aquatic surveys by theRWMP (2003) <strong>and</strong> additional TRCA sampling for the development of the FMP (2003 <strong>and</strong> 2005).The RWMP conducts fish surveys at 26 fixed stations to be repeated every 3 years. Theadditional FMP stations totaled 11 (2003) <strong>and</strong> 24 (2005) but will not be repeated in entirety infuture years. Locations of the RWMP <strong>and</strong> FMP monitoring sites are illustrated in Figure 8-4.Depending on the source of the data, historic fish sampling was generally conducted usingseine nets or backpack electrofishing. Prior to 2000, the TRCA electrofishing protocol followedthe OMNR Electrofishing Guidelines <strong>and</strong> Procedures (Goodchild,1986). The fisheries surveysconducted by TRCA since 2000 have used a single pass electrofishing method as detailed inthe Ontario Stream Assessment Protocol (OSAP), version 5.1 (OMNR, 2003 OSAP: version5.1). The locations <strong>and</strong> data of all past <strong>and</strong> present fish collections have been digitized, forminga database of 360 fish sampling stations (historic <strong>and</strong> present).Fish IBI index CalculationTo calculate the IBI, nine measures of fish community composition are grouped into fourgeneral categories: species richness, local indicator species, trophic composition, <strong>and</strong> fishabundance. IBI scores can be either poor, fair, good or very good. Further detail on generatingFish IBI scores <strong>and</strong> assumptions are provided in the Rouge River Watershed ScenarioModelling <strong>and</strong> Assessment Report (TRCA, 2007).Fish Canonical Correlation Analysis (CCA) ScoresThe L<strong>and</strong>scape <strong>and</strong> Stream Assessment Tool (LSAT) is a GIS application that runs themodelled relationships between fish community <strong>and</strong> LDI, geology, slope <strong>and</strong> the area of asubcatchment (e.g. Fish Management Zone). The output parameter is referred to as a FishCCA Score <strong>and</strong> represents species that “typically” inhabit a certain range of habitat from“coldwater” to “cool” to “warm” to “warm tolerant” (or degraded). Further detail on LSAT,generating CAA scores <strong>and</strong> model assumptions are found in the Rouge River WatershedScenario Modelling <strong>and</strong> Assessment Report (TRCA, 2007).8-8
Figure 8-4: 2003/2005 Fisheries Sampling Sites (RWMP <strong>and</strong> FMP sites)8-9
Benthic Invertebrate DataThe <strong>Region</strong>al Watershed Monitoring Program (RWMP) also collected benthic invertebratesfollowing the OSAP v.5.1 (OMNR, 2003 OSAP: version 5.1) at the same 26 fixed fish samplingsites (Figure 8-4). Each site was surveyed once during the summer months June to September,2003. Samples were collected using a traveling kick <strong>and</strong> sweep-transect method (OMNR, 2000OSAP: version 2.1). This method maximizes reproducibility between years <strong>and</strong> provides amore complete community assessment as sampling is conducted in all stream microhabitats(e.g. riffles, pools, glides). The sample is a composite of all transects with a minimum of 300invertebrates identified to the lowest practical level (i.e. typically genus or species).The TRCA has adopted the analytical method referred to as Benthic Aggregate Assessment(BAA) which employs a decision rule system using a series of 10 common benthic invertebrateindices, each with their own criteria that are deemed characteristic of a healthy streamcondition Table 8-1.Table 8-1: : Indices <strong>and</strong> Conditions/Criteria used by TRCA’s Benthic Aggregate Assessment(BAA,2004)IndexImpairedPotentiallyUnimpairedSource(s)Impaired% Worm > 30 10 to 30 < 10 Griffiths (1998), David et al. (1998)% Midge > 40 10 to 40 < 10 Griffiths (1998)% Sowbug > 5 1 to 5 < 1 In part from Griffiths (1998)Number of Groups 13 David et al. (1998)Diversity 3 Wilm <strong>and</strong> Dorris (1968)% Dominant Group >45 40 to 45 50 45 to 50% Insects < 40 or 40 to 50, or 50 to 80 David et al. (1998)> 90 80 to 90Hilsenhoff BioticIndex>7 6 to 7
the warmest months of the summer for the period between July 1st <strong>and</strong> September 10th. Thetemperatures selected for thermal analysis were based on the following points:• taken after 12:00 pm <strong>and</strong> as close as possible to 4:00 - 5:00 pm;• taken between July 1st <strong>and</strong> September 10th;• taken on days when maximum daily air temperature exceeds 24.5°C; <strong>and</strong>• during a heat wave (> two days) <strong>and</strong> no rainfall to affect baseflowThe stream temperatures are then compared to the maximum air temperature recorded on adata logger that has been setup within the watershed. The calculation for thermal stability isdetermined through a formula in the HABPROGS database (developed by OMNR to managestream habitat data collected through OSAP) that relates the air temperature to the watertemperature that occurs at the site under the above noted conditions.Method 2: WehrlyThe OSAP method of assessing thermal stability relates air temperature to water temperaturehowever a second temperature analysis was conducted to provide more detail about thethermal conditions on selected watercourses. The second method used was the “Wehrly”thermal habitat classification analysis (Wehrlyet al. 1999). This method establishes thermalstability <strong>and</strong> thermal habitat based on the fluctuation in every temperature point logged for thefirst three weeks in July. The result is a thermal stability rating of either: stable, moderatelystable or extremely unstable <strong>and</strong> a thermal habitat rating of either: cold, cool or warm. By usingmore of the data (2016 data points) than the OSAP method (one stream temperature, one airtemperature) it was felt that the results from the “Wehrly” method were more representative ofthe actual stream conditions. Additionally, it was felt that the “Wehrly” method more specificallyaddresses the level of groundwater input into the system.Riparian Vegetation <strong>and</strong> Wetl<strong>and</strong>sInformation on historic <strong>and</strong> existing wetl<strong>and</strong>s were gathered through TRCA’s Terrestrial NaturalHeritage Program. Wetl<strong>and</strong>s two hectares in size or more have been evaluated using thefederal/provincial system <strong>and</strong> classified as nationally, provincially, regionally or locally rare(OMNR, 1994).The riparian vegetation zone delineation is a GIS mapping exercise that produces a st<strong>and</strong>ardreporting of riparian width of 30m from the centre line of the stream; this information is coupledwith air photo interpretation of the watershed (2002). GIS calculations are specific to a givenstream order whereby ten stream widths are r<strong>and</strong>omly selected for a given stream order (1999water layer data) <strong>and</strong> the average of these stream widths is applied to determine the location ofthe centre line.Sample calculation:Centreline + 30mAverage stream width based on 10 transects in a given stream order = 8 mDistance from centerline = 38m8-11
Total Stream LengthThe entire watershed was walked during the Rouge River barrier assessment. As part of thisexercise, the number of kilometers were tallied as a linear driving distance between roadcrossings <strong>and</strong>/or to the top of a headwater system. The sinuosity of streams was taken intoaccount, where possible, through direct measurements at barrier sites. An alternate method ofcalculating stream length is through a GIS exercise that takes the linear measure of streamsfrom the digital watercourse layer. It was felt that the existing watercourse layer for the RougeRiver needs to be updated <strong>and</strong> that the barrier assessment accounting of total stream lengthwas more accurate for existing conditions.Instream BarriersIn 2006, field staff walked all the watercourses in the Rouge River recording all instreamstructures. An instream structure is any structure that comes in contact with the flow, <strong>and</strong>/orspans a watercourse (e.g. dam, weir, culvert, road, bridge, debris jam, beaver dam, etc.) Thefollowing measurements were systematically collected at each intersection of the watercoursewith a structure:• photographic record of structure;• type of structure (e.g. span bridge, open foot culvert);• stream width;• bank condition;• channel condition;• presence or absence of groundwater discharge evidence (e.g. iron staining,watercress);• upstream <strong>and</strong> downstream photos of the structure;• UTM coordinates using a h<strong>and</strong>held GPS unit.For those structures that were deemed a barrier to fish passage, all the above information isrecorded in addition to:the depth of pool (the deepest portion of water downstream of the barrier but within 1metre (perpendicular) to the barrier;height from the lip of the barrier to the stream bed below;height from the lip of the barrier to the surface of the water.These additional measurements help us underst<strong>and</strong> what species of fish may or may not beable to pass over a barrier <strong>and</strong> will help in the prioritization of future barrier mitigation work.Human Use: fish consumption, recreational angling <strong>and</strong> baitfish harvestEvery 2 years, the Ontario Ministry of the Environment (OMOE) publishes the fish consumptionguidelines for various water bodies <strong>and</strong> riverine systems across Ontario (OMOE, 2007). Themost recent publication includes methods for determining consumption guidelines. Anotheragency, the Ontario Ministry of Natural Resources (OMNR) is responsible for issuing permits forrecreational angling <strong>and</strong> baitfish harvest. One past method to track the recreational anglingactivity was through creel surveys that the OMNR would conduct.8-12
8.4 Existing Conditions8.4.1 Watershed ScaleFish Community StructureThe Rouge River fish community is currently most diverse in the upper reaches (1/3) of thewatershed. The communities occupying these reaches span true coldwater species (e.g. brooktrout) to warm water species more typical of larger order streams (e.g. largemouth bass, yellowperch). Moving further down the system to the middle reaches, the diversity is actually thelowest <strong>and</strong> largely made up of warm water species that are not habitat specialists; loss ofspecies associated with riparian wetl<strong>and</strong> habitat (e.g. brassy minnow) has been observed inthis region <strong>and</strong> an increase in generalist species <strong>and</strong> exotics that would be more associatedwith coastal, lentic habitat (e.g. carp). The obvious exceptions are the isolated populations ofredside dace that persist in these middle reaches. Diversity begins to rise through the lowerwatershed to the mouth of the main branch as it is influenced by lake-based species. The LittleRouge River is showing considerably less signs of stress. This system maintains cold <strong>and</strong> coolwater areas in the headwaters <strong>and</strong> the expected structure of warmwater species biodiversityfrom the middle reaches down to the mouth. Details of target species, fish community structure<strong>and</strong> shifts over time are provided for ach FMZ in Section 8.4.2.Fish IBIThe fish IBI scores are largely “very good-good-fair in the headwaters <strong>and</strong> middle reaches butscores reflecting “fair - poor” are measured more frequently <strong>and</strong> consistently in the lowerreaches of the Main Rouge River (Figure 8-5). The populations of redside that are consideredmost at risk of extirpation occur in these cumulative impact reaches: middle reaches of theMain Rouge River (FMZ 10) <strong>and</strong> Morningside Tributary (FMZ 8). The furthest downstreamRWMP station, which is most reflective of additive upstream influences, was “poor” in both2003 <strong>and</strong> 2005. It is important to consider that the contributions of the Little Rouge River (IBIscores “good” in 2003 <strong>and</strong> “fair” in 2005) are buffering the cumulative impacts experienced inthe main watershed as the river empties into the marsh <strong>and</strong> larger Lake. Detailed discussionsof the fish IBI, in the context of stream health, for each FMZ is provided in Section 8.4.2.Fish Canonical Correlation Analysis (CCA) ScoresThe predicted Fish CCA scores selected for interpretation measure the stream condition of themost downstream point of a given subcatchment. In the headwaters, this effectively translatesas a thermal habitat gradient generally going from cold to cool (though with sufficientgroundwater discharge, small streams can remain cold through the system). However, wherel<strong>and</strong>scape alteration <strong>and</strong> on-line ponds occur in the upper reaches of the Rouge River, thecumulative thermal habitat (bottom reaches) supports only cool (FMZ 1 <strong>and</strong> 3) or warmwater(FMZ 2 <strong>and</strong> 4) fish communities, even though high groundwater discharge zones <strong>and</strong>coldwater habitat are still present in the upper reaches. Similar habitat gradients continue downthrough the watershed, but as the systems move towards warmwater in the lower portions <strong>and</strong>the cumulative impacts of increased urbanization occur, the range in habitat type isconsiderably smaller. Below Hwy 407, the predicted habitat is confined to the warmwater rangeof tolerant fish species (FMZ 7, 8 <strong>and</strong> 9). These are modelled results only, meant to provideanother level of interpretation to metrics like IBI scores <strong>and</strong> empirical fish data. A more detailed8-13
discussion of Fish CCA scores <strong>and</strong> their limitations is provided in the Rouge River WatershedScenario Modelling <strong>and</strong> Analysis Report (TRCA, 2007) (See Figure 8-6).Figure 8-5: : Index Iof BioticIntegrity (IBI) Scores for all RWMP Sites8-14
Figure8-6: : Fish Canonical CCorrelation Analysis (CCA) Scores Analyzed for 2002 L<strong>and</strong>coverTypes8-15
<strong>Aquatic</strong> Invasive Species (AIS)A specific note of concern for the Rouge River is the recently confirmed entry of the aquaticinvasive species (AIS) round goby. This invasive has been spreading through Lake Ontariowaters for a number of years <strong>and</strong> has begun to move into the riverine systems. Unlikewatersheds like the Humber, Don <strong>and</strong> Mimico, the Rouge River has no barrier at the mouth toprevent the potential spread of goby into the main branch. Although there is the dam at MilneReservoir that can control access to headwaters via a manually operated cage/gate system, theLittle Rouge River has no such barrier <strong>and</strong> is quite vulnerable to gobies spreading throughoutthis system.There is very little underst<strong>and</strong>ing of the biology of this species (e.g., migration or distributionpatterns <strong>and</strong>/or cues, reproductive potential, possible predators, nutritional value as a foodresource to other fish, etc.). What is known is their preferred habitat is benthic. They displayaggressive, competitive behaviour with native benthic species (e.g. sculpins) <strong>and</strong> have asucker-disk on their abdominal area that may allow them to effectively “climb over” barriers.The updated Rouge River FMP will make recommendations around the threat of AIS but in theabsence of an existing response protocol <strong>and</strong> limit biological knowledge it is difficult to predictthe true impact of this species on the present ecosystem.Thermal RegimeThe Rouge River watershed is characterized by a coldwater system that dominates theheadwaters <strong>and</strong> a warmwater system that defines the Little Rouge River <strong>and</strong> lower reaches ofthe Main Rouge River. Middle sections of the watershed exist through a gradient of cool towarm water conditions (Figure 8-7). Thermal instability is measured when a stream experiencesa wide enough range in temperature as to cross through one or more thermal categories (cold,cool or warm). The frequency that this range is measured <strong>and</strong> the length of time the streammight remain at stressfully high temperatures will also affect the thermal stability rating.Coldwater systems are generally thought of as ‘stable’ as they are sourced by groundwater thatdoes not fluctuate widely. However, the headwaters of Bruce <strong>and</strong> the Little Rouge havemeasured evidence (i.e. temperature loggers) that within a reach, temperatures are shiftingbetween cold then warm then cold again (Figure 8-8). This thermal fluctuation is coincidentwith numerous on-line ponds <strong>and</strong> loss of riparian cover. Other areas that are extremelyunstable are found in the lowest reaches of the Little Rouge River (main channel rises above32°C through July <strong>and</strong> August) where summer stream depth is very shallow <strong>and</strong> there isminimal tree cover.8-16
Figure 8-7: Measured Thermal Regime8-17
Figure 8-8: : Thermal Stability8-18
Riparian Wetl<strong>and</strong>s <strong>and</strong> VegetationEnvironment Canada (2004) has produced a guideline document (2 nd edition) around howmuch habitat is enough. From this document, TRCA Watershed Plans have applied a target of100% natural cover along the riparian zone through the watershed, with 75% of that consistingof forest cover. Through continued assessment of target achievement over time, it may bedetermined that a lower, more realistic riparian cover target be assigned. Further, this target isa linear measurement <strong>and</strong> dos not contain the data to infer riparian function (e.g. plantcommunity composition <strong>and</strong> relative health are not measured)Based on this analysis, 65% ofthe riparian area in the watershed has natural cover (much if this area is assumed to be presentin the Rouge Park holdings), with approximately 54% of that forest cover. Table 8-2summarizes the current amount of riparian cover found in the whole Rouge River watershed.Table 8-2: : Riparian Vegetation in the Rouge River WatershedRouge RiverWatershed% Total PotentialRiparian AreaTotal ExistingTotal Existing RiparianTotal Potential Riparian AreaRiparian Area withArea Without(TPRA) (ha)Natural Cover (ha)Natural Cover (ha)2626 1704 922100 65 35RiparianRiparianRiparianRiparianBreakdown ofFORESTMEADOWSUCCESSIONALWETLANDExisting Habitat(ha)(ha)(ha)(ha)Type (ha)922 603 83 96% Total PotentialRiparian Area 35 23 3 4There are efforts underway within the watershed to increase the riparian zone, particularlywithin Rouge Park in support of the overall philosophy <strong>and</strong> intent written in the Rouge ParkManagement Plan (MNR, 1994). To further this endeavour, Rouge Park is currently developinga specific reforestation plan as part of the Little Rouge Corridor Management Plan (inpreparation) <strong>and</strong> Rouge Park Alliance ENVision report (in preparation). TRCA also undertakesriparian planting through its Restoration Services group. However, all this work needs to betracked, mapped <strong>and</strong> re-evaluated in the field at various intervals to gauge the success of thework <strong>and</strong> to document the total area of habitat gained beyond the initial planting event.Additionally, all such information should pass through a single coordinating agency todocument <strong>and</strong> track the work undertaken. Currently, this is not being performed <strong>and</strong> should bea focus for future management.Priority Barriers for Management in the Rouge River WatershedA barrier survey <strong>and</strong> assessment for the entire watershed was initiated in 2005 <strong>and</strong> completedin October 2006. Of the total watershed stream length of 427 km, 353 km were surveyed. Atotal of 806 structures were assessed, including road <strong>and</strong> rail crossings as well as dams, ofwhich 253 were documented as barriers to fish passage.8-19
The report entitled “TRCA <strong>Aquatic</strong>s Group 2006-2007 Instream Barrier Assessments, RougeRiver Watershed, RAP Summary Report” was prepared in April 2007 <strong>and</strong> is an appendix to theRouge FMP (in preparation). The barrier report contains mapping <strong>and</strong> inventory results of all806 structures, with the 253 fish barriers mapped separately <strong>and</strong> discussed in detail. Alsoincluded are recommendations on the management actions required for fish barriers, whichcould entail mitigation or maintenance of the structure.In stream barriers were assessed as impeding fish passage under summer low flow conditions.This can mean that when water levels in the stream are relatively high (spring, fall), fish are notimpeded by the barrier. So, within the context of low flows, an instream barrier may have one orseveral impacts on the fish community <strong>and</strong> habitat in the vicinity of the barrier. These possibleimpacts include: preventing upstream movement of all fish species, preventing upstreammovement of non jumping fish species, creating pond habitat upstream of the barrier, warmingof stream temperature, fragmenting local fish populations, interfering with sediment transport<strong>and</strong> partitioning resident fish species from migratory species.For the purposes of fisheries management, certain critical impacts or functions of barrierscan be defined <strong>and</strong> used as the basis for identifying management priorities. These include:• strategically beneficial barriers which either exist or could be constructed, topartition resident species from migratory species OR invasive species;• barriers which have negative impacts such as fragmenting fish populations orwarming stream temperatures especially in cold water habitat.Another important ecological consideration for determining priority management waswhether the system at the FMZ scale still had good stream condition <strong>and</strong> was not slated ashigh future development areas.The entire barrier database was examined in order to identify priority barriers for each ofthe Fisheries Management Zones. A total of 29 key barriers to fish passage, which meet thecriteria for being priority barriers were identified, with the top 3 being located in the BruceCreek subwatershed (FMZ 3). Managing these selected priority barriers will provide themaximum benefit to the fish community. Table 8-3 <strong>and</strong> Figure 8-9 contain information onthe priority barriers <strong>and</strong> where they are located. There is a management recommendationto consider installing a removable barrier at the mouth of the watershed to protectionupstream areas from invasive species. This proposed barrier is shown as a dot on Figure8-9 just below the confluence of the Main Rouge <strong>and</strong> the Little Rouge River.8-20
Table 8-3: : Management Recommendations for Priority Barriers in the Rouge River WatershedPriority FMZReach (ifapplicable)Strategic ExistingBarriers to Remainfor SpeciesPartitioningProposed Priority Barriers to beMitigated or RemovedProposed New Barriersfor Species Partitioning<strong>and</strong> AIS ManagementRationale1* 3 Large concrete dam upstreamof Stouffville Road should beremoved or bypass channelcreated2* 3 Large concrete dam on privateproperty between StouffvilleRd. <strong>and</strong> Bethesda Rd.Thermal impacts from topdraw dam;Barrier to fish movement(brook trout zone)Thermal impacts from topdraw dam; Barrier to fishmovement (brook troutzone)3* 3 Bruce's Mill Dam Barrier to fish movement(potential to extendredside dace habitat)4* 3 Low dam/weir u/s of Elgin MillsRd., W. of Kennedy5* 3 Old concrete dam u/s of ElginMills,east of KennedyBarrier to redside dace<strong>and</strong> non-jumping fishmovementBarrier to fish movement(redside dace zone)* The top 5 priority barriers, if removed would open a significant amount of upstream habitat (>500m). The condition of that habitat variesbetween sites but would provide incentive for enhancement, rehabilitation or restoration.6 4 KennedyTributaryLarge concrete dam south ofStouffville Rd. should beremoved, bypassed orconverted to bottom drawThermal impacts from topdraw dam; Barrier to fishmovement (redside dacezone)7 4 McCowanTributaryLarge concrete dam d/s of 19thshould be removed, bypassedor converted to bottom drawThermal impacts from topdraw dam; Barrier to fishmovement (brook troutzone)8-21
8 4 KennedyTributary9 4 McCowanTributary10 4 McCowanTributaryConcrete dam 66cm in heightSE of McCowan <strong>and</strong> 19th isfirst barrier u/s of Lake Ontario,but should be removed,bypassed or converted tobottom drawConcrete dam u/s of StouffvilleRd. should be removed orbypassedSmall weir on Spring LakesG.C. u/s of Stouffville Rd.should be removed11 4 MarkhamTributaryConcrete dam 95cm in heighton Spring Lakes G.C. u/s ofStouffville Rd <strong>and</strong> west of Hwy48 should be removed12 2 Concrete dam on privateproperty S. of Major MacKenzie<strong>and</strong> E. of Warden should havebypass channel created13 2 Perched culvert under ElginMills should be mitigated by arocky ramp14 3 Small old concrete dam onAngus Glen Golf Course isfailing <strong>and</strong> should be removed15 3 Perched culvert u/s ofBethesda Rd. should bemitigated16 4 McCowanTributarySmall weir constructed of 4 by4 beams d/s of Bethesda Rd.should be removed8-22Thermal impacts from topdraw dam; Barrier to fishmovement (redside dacezone)Barrier to fish movementBarrier to fish movementThermal impacts from topdraw dam; Barrier to fishmovement (brook troutzone)Barrier to fish movementBarrier to fish movementBarrier to small fishmovementPerched culvertfragments coldwaterbrook trout habitatBarrier to fish movement(brook trout zone)
17 4 McCowanTributary18 1 WestTributarySmall weir constructed of steelbeams u/s of Bethesda shouldbe removedWeir at Nursery on Bayview u/sof Elgin Mills should beremoved19 1 WestTributaryOld concrete dam u/s of privatedrive opposite Subcisco Ave.should be removed20 10 Road culvert under MajorMacKenzie, E. of Leslie St, hasa drop structure.21 10 E. of Woodbine Ave <strong>and</strong>upstream of Hwy 7, gabionbaskets lining stream channelshould be removed22 6 RobinsonCreekWeir at Robinson St. crossingshould be mitigated with arocky ramp23 6 RobinsonCreekWeir immediately upstream ofHwy 7 should be mitigated.24 6 RobinsonCreekConcrete dam 300 metresnorth of Hwy 725 1 LeslieTributaryConcrete dam on privateproperty upstream of 19th Aveshould be removed8-23Barrier to fish movement(brook trout zone)Thermal impacts from topdraw dam; Barrier to fishmovement (brook troutzone)Thermal impacts from topdraw dam; Barrier to fishmovement (brook troutzone)Drop structure blockssmall fish movement inthis cool water zoneGabion baskets liningstream channel mayblock movement of nonjumping fishWeir blocks fishmovement (redside dacezone)Weir blocks fishmovement (redside dacezone)Fragments reside dacehabitat (but may chooseto retain as speciespartition from rainbowtrout)Dam is a barrier to fishmovement (possibleredside dace zone)
26 8 MorningsideCreekWeirs that concentrate flowlocated 350 m upstream ofconfluence with Main Rougeshould be removed ormitigated27 10 Beaver Creek Online dam at secondstormwater mgmt pond couldbe mitigated28 10 Beaver Creek Online dam at first stormwatermgmt pond could be mitigated29 10 Beaver Creek Perched concrete culvert underBok Trail could bemitigated`with a rocky rampTBD 9 Mouth of theRouge8-24The feasibility ofconstructing a barrierstructure to controlupstream access intothe entire watershedshould beinvestigated.Thepurpose of thisstructure would be topermit passage ofnative or naturalizedfish species <strong>and</strong> toprevent passage ofinvasive species suchas sea lamprey <strong>and</strong>round goby.A possiblelocation would bedownstream of Hwy401.weirs prevent upstreammovement of nonjumpingfish speciesThermal impacts from topdraw dam Barrier to fishmovementThermal impacts from topdraw dam Barrier to fishmovementPerched culvertfragments warmwater fishhabitat
Figure 8-9: : Priority Instream Barriers8-25
Fish ConsumptionFish consumption advisories are in effect for salmonids that enter the watershed via LakeOntario, where the source of initial contamination is assumed. Several different speciescaught in Milne Reservoir <strong>and</strong> in the Rouge River Marsh also have consumption guidelinesaccording to the size of the individual fish (Table 8-4). There are now slightly morerestrictive guidelines (i.e. number of fish) for pregnant women <strong>and</strong> very young children (notshown). With the exception of the aforementioned update, the consumption guidelines arere-evaluated on a 2 year basis <strong>and</strong> have not changed in the Rouge River watershed sincethe 2005-2006 publication. The water quality chapter of this SOW report contains thedetails around what contaminants are of concern.Table 8-4: : 2007-2008 2008 Sport Fish Consumption Guidelines*Sample SiteRouge River(Lake run salmonids)SpeciesChinook salmonCoho salmonRainbow troutBrown troutNumber of Meals Safe for ConsumptionCFish Length(cm)55-7030-4030-4040-5035-40Number ofMeals14421Fish Length(cm)>7065-7050-6065-70>40cmNumber ofMeals01110Milne ReservoirLargemouth bassRock bassBlack crappieCarp25-3015-2020-2525-308888 25-55 4Rouge River Marsh*(OMOE, 2007)Largemouth bassSmallmouthRock bassPumpkinseedBrown bullhead catfishCarp20-3520-4015-2515-2015-4040-4545-50888888435-4040-4550-6065-70>7544210Recreational Angling OpportunitySeveral fish management zones have been identified as either currently known places forrecreational fishing: Little Rouge River (FMZ 7); Lower Main Rouge River (FMZ 8); RougeRiver Marsh (FMZ 9)) or recommended in the updated Rouge Fisheries Management Plan(in preparation) as a “new” recreational angling location: Milne Reservoir (FMZ 5). Creelsurveys, which provide anecdotal information about what <strong>and</strong> where people fish, wereundertaken in the past by the Ministry of Natural Resources but have not been conductedin recent years.8-26
Baitfish HarvestBaitfish, generally speaking, are small minnows <strong>and</strong> other species of similar size (includingcrayfish) that are the food resource of larger fish. Anglers will collect these small species asbait for attracting game fish (e.g. salmon, trout <strong>and</strong> bass). A baitfish harvest licensee isrequired to report total annual catch amounts. Between 2000 <strong>and</strong> 2002, the baitfishharvest ranged from 330 lbs in 2000, to 91 lbs in 2001 to 330 lbs in 2002. It is not clearwhere the major extraction locations are within the watershed, <strong>and</strong> what the numbers of thevarious species are that are being harvested. However, it is still useful to gauge the relativeresource use of the watershed. More detailed information around baitfish harvest pressurein the Rouge River is presented in the updated Rouge River FMP (in progress).Cumulative EffectsThe Fish IBI is a measure of fish community attributes that is used to identify the generalhealth of the broader community. Cumulative effects from l<strong>and</strong>scape change <strong>and</strong> varioushuman activities are being detected in the Rouge River watershed. The fish IBI scores arelargely “very good-good-fair in the headwaters <strong>and</strong> middle reaches but scores reflecting“fair - poor” are measured more frequently <strong>and</strong> consistently in the lower reaches of theMain Rouge River. The populations of redside that are considered most at risk ofextirpation occur in these cumulative impact reaches: middle reaches of the Main RougeRiver (FMZ 10) <strong>and</strong> Morningside Tributary (FMZ 8). The benthic invertebrate community(BAA scores) generally reflect the same downstream trends shown in the fish communityhealth.The furthest downstream RWMP station, which is most reflective of additive upstreaminfluences, was “poor” in both 2003 <strong>and</strong> 2005. It is important to consider that the contributionsof the Little Rouge River (IBI scores “good” in 2003 <strong>and</strong> “fair” in 2005) are buffering thecumulative effects experienced in the main branch as the river empties into the marsh <strong>and</strong> LakeOnatrio. To maintain or improve this relatively “high quality” water source, all efforts to increaseforest cover in the Little Rouge River watershed <strong>and</strong> manage future development in asustainable manner should be considered priority recommendations.8.4.2 Fisheries Management Zone ConditionsFMZ 1: Upper Reaches of Main Rouge RiverFigure 8-10 summarizes the existing conditions for the upper reaches of the Main Rouge River(FMZ1). Located in the upper-west corner of the watershed, this zone represents theheadwaters of the Main Rouge River <strong>and</strong> supports both key target species, brook trout <strong>and</strong>redside dace, in relatively high abundance compared to other FMZs. In addition, Americanbrook lamprey <strong>and</strong> mottled sculpin are also found, both of which are cold-cool water species.Strong groundwater discharge zones characterize the reaches that brook trout <strong>and</strong> redsidedace occupy. The groundwater table in this zone is shallow <strong>and</strong> particle tracking resultssuggest a reliance on local recharge areas. Thus, there are concerns that future developmentprotects the volume <strong>and</strong> pattern of groundwater discharge within this area. In addition, aprivate l<strong>and</strong>owner maintains an active well head that currently sources groundwater to anupper tributary. If this practice is stopped, the affected stream may go dry.8-27
Figure 8-1010: Existing Conditions <strong>and</strong> Issues in Upper Main Rouge River (FMZ 1)1Note: The thermal regime represents actual stream temperatures which have been interpreted for development <strong>and</strong>application of Timing Windows as found in the Rouge River FMP.8-28
Currently, there is stocking of rainbow trout <strong>and</strong> brown trout into headwater habitat utilized bynative brook trout. There are questions around potential competition for resources amongstthese species <strong>and</strong> whether stocking practices should continue. This issue is being introducedin the State of the Watershed Report as simply an existing condition. A detailed discussionaround stocking <strong>and</strong> management recommendations can be found in the Rouge River FMP.Related to this issue is one of species partitioning <strong>and</strong> whether there are existing instreambarriers that should remain. As such, there is currently a weir at the bottom of this FMZ thateffectively partitions brook trout populations from migrating salmonids (but not from stockedfish). The Rouge River FMP will also discuss management options around instream barriers asthey pertain to maintenance (species partitioning) or mitigation (to allow for fish passage).Stream Health: FMZ 1Table 8-5 summarizes the indicators of stream health for the upper reaches of the Main RougeRiver (FMZ1). From the IBI ratings, the reaches on the western half of FMZ1 range from poorgood-fairmoving upstream to downstream, respectively (Table 8-5). Brook trout are known toreside in some of these reaches, but the upstream “poor” rating is likely due to the fact thatbrook trout were not actually collected at this station during the 2003 event. Streamtemperatures are “moderately stable” as interpreted by the OSAP method, but analysis of thecontinuous temperature logger data (Wehrly et al., 1999) identifies the lower reaches of thisFMZ to be extremely unstable. As discussed, the confidence is higher with the continuouslogger data <strong>and</strong> will be deferred to in discussions for remaining FMZs (if available). The BAAratings are all “good” for this stream area, including the downstream reaches. This is likely anexample of benthic invertebrates not being a sensitive indicator to incremental impacts fromurbanization. If the insect community has not shifted to a tolerant one, it suggests the currentimpacts are not extreme. Further, sedimentation of brook trout spawning sites is not likelyoccurring at this point in time as benthic invertebrate species that are sensitive to fine sedimentare still present. Surface flow analysis has identified issues of erosion through the bottom ofthis zone, but the deposition of eroded material largely affects downstream habitat (FMZ 10).Having said that, some cumulative impacts within FMZ1 are being measured as unstable (i.e.high) stream temperatures <strong>and</strong> relative decline in downstream health (IBI score of “fair” at thefurthest downstream point). This is not unexpected given the upstream proximity of anurbanized l<strong>and</strong>scape (Richmond Hill).Table 8-5: Stream Health of Upper Main Rouge River - FMZ 1Target SpeciesBKT, RSD, ABL,MS, RDIBI RatingBAA RatingTemperature RatingCCA CA Score2003 2005 2003 2003 (OSAP) 2005 (Wehrly) 20020 VG3 G2 F1P0VG1 G1 F1P4 unimpaired1 pot. imp.1 stable3 mod. stable1 no sample2 stable3 mod. stable2 unstablewarm: lower rangecool: upper rangeNumber of Stations 5 3 5 5 7Note: the listed “year” indicates from which data set the ratings/scores are based upon. 2003 IBI combines RWMP<strong>and</strong> FMP stations sampled in that year. 2005 IBI are only FMP stations. See Figure 8-5 for IBI Station Locations. VG=Very Good, G = Good, F= Fair, P = Poor.8-29
The predicted CCA score identifies streams on this west half as at the threshold between cool<strong>and</strong> warmwater habitat <strong>and</strong> not expected to support brook trout. However, recent field surveys(2005 <strong>and</strong> 2006) have confirmed that brook trout are present <strong>and</strong> successfully spawning in thewestern reaches. It is believed that this existing coldwater habitat is still present <strong>and</strong> relativelyhigh quality due to (unintentional) augmentation of groundwater contributions along BayviewAvenue. This condition would not have been accounted for by the modelling relationships onwhich the LSAT “tool” uses to predict fish CCA Scores (see Rouge River Watershed ScenarioModelling <strong>and</strong> Analysis Report for details (TRCA, 2007). The proposed widening of thisroadway is expected to result in the loss of (augmented) groundwater contributions. Positionthis with the urban impacts already being sustained <strong>and</strong> it may all be enough to push thissystem to the predicted warmwater condition. As urbanization exp<strong>and</strong>s across this FMZ, furtherimpacts to the coldwater habitat are possible without sound mitigation to maintain the currenthydrologic function.The eastern half of this FMZ supports redside dace in the downstream reaches. The mostupstream station received an IBI rating that shifted from “fair’ in 2003 to “poor” in 2005 but theBAA rating <strong>and</strong> stream temperatures in this headwater area do not indicate impairment orinstability. The IBI scores for this whole FMZ used the criteria for coldwater habitat, but brooktrout have not been collected this high up in the system. From this, headwater conditions usingthis index would not necessarily receive a high rating even though ecological function is intact.The predicted CCA scores for the eastern tributaries are within a range supporting marginallycool water habitat. This is consistent with the split in distribution between brook trout to thewest <strong>and</strong> redside dace on the east.Fish Community Structure: FMZ 1The various fish species sampled in recent survey years (16 in 2003/2005) are listed in Table8-6 along with all other species that have been recorded in streams within FMZ 1 (25 totalspecies). The present fish community is reasonably diverse <strong>and</strong> represents the full thermalhabitat spectrum, that is, from coldwater (e.g. brook trout, American brook lamprey), throughcool water (e.g. redside dace, white sucker) <strong>and</strong> exp<strong>and</strong>ing into warmwater (e.g.pumpkinseed). This FMZ is considered coldwater based on hydrogeology <strong>and</strong> past/presentcoldwater fish species; therefore, the expected fish community structure would becharacterized by relatively low diversity, in line with coldwater regimes. Essentially there aremore types of species present today than the past records indicate or would be expected incoldwater habitat. It is suggested that thermal warming impacts from on-line ponds haveeffectively increased the habitat diversity. Warmer water species may have moved up from thelower parts of the system as they can exploit the now warmer temperatures present in theseupper reaches.Adding to the diversity in this zone are stocked coldwater species: rainbow trout <strong>and</strong> browntrout. Natural reproduction may be occurring, particularly with resident brown trout, but specificsurveys have not confirmed this status. The 1999 collection record of Atlantic salmon, anextirpated native species, should be explained: this species does not show up in any historiccollection record (1950s) <strong>and</strong> the recent presence is assumed to be a result of “escapees” fromlocal hatcheries <strong>and</strong> are not naturally reproducing in the system.8-30
Table 8-6: : Historic <strong>and</strong> Existing Fish Species in FMZ - 1Species NameScientific NameLast Recordamerican brook lamprey Lampetra appendix 8/16/2005atlantic salmon Salmo salar 9/29/1999black crappie Pomoxis nigromaculatus 8/30/2000blacknose dace Rhinichthys atratulus 8/16/2005bluntnose minnow Pimephales notatus 7/22/2003brook stickleback Culaea inconstans 8/16/2005brook trout Salvelinus fontinalis 7/18/2005brown bullhead Ameiurus nebulosus 5/17/2000common carp Cyprinus carpio 8/8/2001common shiner Luxilus cornutus 8/16/2005emerald shiner Notropis atherinoides 8/8/2001fathead minnow Pimephales promelas 6/27/2005goldfish Carassius auratus 8/26/2002johnny darter Etheostoma nigrum 8/16/2005koi Coregonus kiyi 8/8/2001longnose dace Rhinichthys cataractae 8/16/2005mottled sculpin Cottus bairdi 8/27/2003northern hog sucker Hypentelium nigricans 9/21/1998northern redbelly dace Phoxinus eos 8/16/2005pumpkinseed Lepomis gibbosus 7/24/2003rainbow darter Etheostoma caeruleum 8/16/2005rainbow trout Oncorhynchus mykiss 7/18/2005redside dace Clinostomus elongatus 8/16/2005rock bass Ambloplites rupestris 8/27/2002tadpole madtom Noturus gyrinus 5/26/1972white sucker Catostomus commersoni 8/16/2005Note”: Detailed fish collection records <strong>and</strong> data, in electronic format, are available upon request from TRCA <strong>Aquatic</strong>Group.FMZ 10: Middle Reaches of Main Rouge RiverFigure 8-11 summarizes current conditions in the middle reaches of the Main Rouge River <strong>and</strong>Beaver Creek. The main branch, as it flows through the mid-western area of the watershed,supports two target species (redside dace <strong>and</strong> American brook lamprey, although the latterwere not found in the most recent sampling records) <strong>and</strong> is influenced by upstream conditionsin FMZ 1 as well as adjacent l<strong>and</strong>use. An issue that has been identified by the surface watermodelling is the erosion potential at the downstream end of FMZ 1. This may have influenceson the substrates available to biota through middle reaches, but to date, this level of habitatinvestigation has not been undertaken. However, excessive sedimentation has been identifiedall through Beaver Creek creating a homogeneous instream environment inconsistent withsupporting a diverse fish community. Beaver Creek does flow through a very urbanizedl<strong>and</strong>scape with sedimentation being associated with stormwater impacts, not stream channelerosion.8-31
Figure 8-1111: : Existing Conditions <strong>and</strong> Issues in Middle Reaches of Main Rouge River (FMZ 10)Note: The thermal regime represents actual stream temperatures which have been interpreted for development<strong>and</strong> application of Timing Windows as found in the Rouge River FMP.8-32
Groundwater discharge has been observed in the upper reaches of this zone within the mainbranch. Results from particle tracking modelling identify regional, deep aquifers as the likelysource of groundwater. Migratory salmonids have unlimited access through this zone <strong>and</strong> theremay be opportunity for nursery habitat or staging (i.e., entering the system early in thespawning season <strong>and</strong> waiting until conditions are appropriate). There are no significantgroundwater contributions to Beaver Creek <strong>and</strong> multiple instream barriers to fish passage.Stream Health: FMZ 10Table 8-7 summaries the indicators of stream health for FMZ 10. There is only one monitoringstation in this zone. It is located at the downstream portion of the upper Rouge River but abovethe confluence with Beaver Creek (see Figure 8-11). Any cumulative effects from the headwaterreaches would be measured here. The IBI score remains fair through this reach despite a moreurbanized environment suggesting that the groundwater discharge plays an important role inprotecting downstream habitat (e.g. water quality, stream temperature).Table 8-7: Steam Health of Middle Reaches of Main Rouge River - FMZ 10Target SpeciesRSD, ABL, RDIBI RatingBAA RatingTemperature Rating2003 2005 2003 2003 (OSAP) 2005 (Wehrly) 20020 VG 0 VG 1 unimpaired 1 mod stable 1 mod stable0 G 0 G(Main Branch) (Beaver Ck)2 F 0 F0 P 0 PPredicted CCA CA Scorewarm: lower range(Main Branch)warm: upper range(Beaver Creek)No. Stations 2 0 1 1 1Note: the listed “year” indicates from which data set the ratings/scores are based upon. 2003 IBI combines RWMP<strong>and</strong> FMP stations sampled in that year. 2005 IBI are only FMP stations. See Figure 8-5 for IBI Station Locations. VG=Very Good, G = Good, F= Fair, P = Poor.The past (2003) <strong>and</strong> recent (2006) temperature data, together with the CCA Scores indicate amoderately stable thermal regime supporting a cool – to –warm habitat gradient flowing fromthe upstream to the furthest downstream point in this zone.BAA scores do not identify fines as an issue as turbidity-sensitive invertebrates are still present(eroding material from upstream is assumed to be coarse). These interpretations arereasonable in light of the similarly sensitive target species, redside dace, also being present,although their population is small <strong>and</strong> confined to the stretch of habitat downstream of thegroundwater discharge zone.The only fish sampling station in Beaver Creek was conducted in 2003 as part of the FMPsurvey <strong>and</strong> an IBI score of “fair” was calculated. Temperature data (2005) from this reachindicates a moderately stable thermal regime. There is no benthic invertebrate data for thiswatercourse. Despite the comparable IBI <strong>and</strong> thermal ratings, Beaver Creek does not supportany target species, but some minnow <strong>and</strong> other warm water species are present (see nextsection). Consistent with the present fish community, CCA scores predict a habitat that passesthe threshold of many warm water species tolerance to impacts associated with an urbanizedl<strong>and</strong>scape.8-33
Fish Community Structure: FMZ 10Table 8-8 lists all the 26 species historically found in this zone. The 16 species found in the2003 survey suggests this community has shifted over decades from specialist species to moregeneralists. There has been a loss of the cool-warm water community diversity appropriate formiddle reaches. As the majority of recently sampled species are warmwater <strong>and</strong> tolerant of awide spectrum of habitat <strong>and</strong> water quality conditions. There are two exceptions to note:redside dace <strong>and</strong> rainbow darter. The status <strong>and</strong> sensitivity of redside dace has beendiscussed. Its continued presence in this reach indicates stream conditions still have ameasure of integrity, at least at the site scale. Redside dace do not have an established CCAAxis score but rainbow darter does. Under current conditions, the predicted CCA Score atwhich rainbow darters begin to disappear from the sampling record is being approached.Rainbow darter is a species that has been lost in neighbouring watersheds <strong>and</strong> monitoring ofpresent populations in the Rouge River is critical to know if environmental degradation isadvancing.Table 8-8: Historic <strong>and</strong> Existing Fish Species in FMZ 10 (Main <strong>and</strong> Beaver Creek)Species NameScientific NameLast Recordamerican brook lamprey Lampetra appendix 11/14/2000blacknose dace Rhinichthys atratulus 9/2/2003bluntnose minnow Pimephales notatus 8/8/2003brook stickleback Culaea inconstans 9/2/2003brown trout Salmo trutta 11/14/2000central stoneroller Campostoma anomalum 8/21/2000common carp Cyprinus carpio 7/21/2003common shiner Luxilus cornutus 7/29/2003creek chub Semotilus atromaculatus 9/2/2003fathead minnow Pimephales promelas 9/2/2003finescale dace Phoxinus neogaeus 7/12/1999golden shiner Notemigonus crysoleucas 5/26/1954goldfish Carassius auratus 9/2/2003johnny darter Etheostoma nigrum 8/8/2003largemouth bass Micropterus salmoides 8/21/2000longnose dace Rhinichthys cataractae 8/8/2003northern redbelly dace Phoxinus eos 8/8/2003pumpkinseed Lepomis gibbosus 7/29/2003rainbow darter Etheostoma caeruleum 7/29/2003rainbow trout Oncorhynchus mykiss 7/29/2003redside dace Clinostomus elongatus 8/21/2000rock bass Ambloplites rupestris 6/16/1992spottail shiner Notropis hudsonius 7/12/1995stonecat Noturus flavus 7/29/2003tadpole madtom Noturus gyrinus 6/16/1992white sucker Catostomus commersoni 9/2/2003Note”: Detailed fish collection records <strong>and</strong> data, in electronic format, are available upon request from TRCA <strong>Aquatic</strong>Group.8-34
FMZ 2: Berczy CreekFigure 8-12 summarizes the existing conditions of Berczy Creek (FMZ 2) located in theheadwaters of the Rouge River watershed. Overall, the habitat in the zone is of high quality,evidenced by an abundant redside dace population present in the lower reaches of BerczyCreek likely maintained by the presence of local groundwater discharge. There are no brooktrout in this zone as the headwater habitat is generally warmer relative to adjacentsubwatersheds. There is an instream barrier that splits the available redside dace habitat,allowing only downstream movement of redside dace as they can not re-negotiate the barrier<strong>and</strong> return to upstream habitat. Both rainbow trout <strong>and</strong> brown trout are stocked above thisbarrier into redside dace habitat. Sampling records have found adult rainbow <strong>and</strong> brown troutabove the barrier, so it is assumed that these species are able to jump the existing structure.Upstream l<strong>and</strong>use is largely agricultural with limited forest cover which may be a factor inwarmwater conditions persisting in upstream reaches. Multiple golf courses are also presentwhich can have impacts on water quality/quantity <strong>and</strong> loss of riparian vegetation.Stream Health: FMZ 2Table 8-9 summarizes the indictors of stream health for Berczy Creek (FMZ 2). <strong>Aquatic</strong>systems warm with downstream progression unless, as in Berczy, large amounts ofgroundwater discharge occur along the way. The cool- warm trend in Berczy is interrupted midwaythrough the zone as groundwater inputs modify the habitat <strong>and</strong> we see populations ofredside dace supported. The stream data (IBI <strong>and</strong> CCA scores) mark this trend with “fair’ to“good” ratings upstream <strong>and</strong> downstream of the discharge zones, respectively, with thefurthest downstream habitat becoming warmwater.The unstable temperature calculation in 2005 is confined within the short warmwater reachabove the groundwater discharge zone, suggesting upstream impacts maybe occurring inaddition to the natural warming gradient. However, the groundwater appears to mitigate theupstream warming trend at the reach level. The benthic invertebrate data follows a differenttrend with the impaired site occurring within the discharge zone <strong>and</strong> the non-impaired sitescoincident with only “fair” IBI ratings. The confounding issues around benthic invertebrates arediscussed in Appendix A <strong>and</strong> from that, it is possible that the benthic communities in thesesites are more sensitive to habitat than water quality.Table 8-9: Stream Health of Berczy Creek - FMZ 2Target SpeciesRSD, ABL, BM, RDIBI RatingBAA RatingTemperature RatingCCA CA Score2003 2005 2003 2003 (OSAP) 2005 (Wehrly) 20020 VG1 G3 F0 P0 VG1 G0 F0P2 unimpaired1 impaired3 mod stable 2 mod stable1 unstablewarm: mid-rangeNo. Stations 4 1 2 3 3Note: the listed “year” indicates from which data set the ratings/scores are based upon. 2003 IBI combines RWMP<strong>and</strong> FMP stations sampled in that year. 2005 IBI are only FMP stations. See Figure 8-5 for IBI Station Locations. VG=Very Good, G = Good, F= Fair, P = Poor.8-35
Figure 8-1212: : Existing Conditions <strong>and</strong> Issues in Berczy Creek (FMZ 2)Note: The thermal regime represents actual stream temperatures which have been interpreted for development <strong>and</strong> application ofTiming Windows as found in the Rouge River FMP.8-36
Fish Community Structure: FMZ 2Table 8-10 lists all the species historically <strong>and</strong> presently found in Berczy Creek (33). Species foundin the most recent surveys (19) provide some information as to how this community has shifted overdecades. Similar to the headwaters of the Main Rouge River (FMZ 1), the species that are“missing” from recent surveys are more pond-based habitat users (or large rivers), a type of habitatnot generally sampled anymore. There is good continuity between the historic community <strong>and</strong>existing populations of typically stream-based fish. This implies if stream conditions have degraded,it has not been to a significant degree. The biodiversity is also high, covering cold–warmwaterspecies. It should be noted that species requiring very cold water (i.e., brook trout, sclupins) havenever been sampled in this zone. This supports the supposition that Berczy is a naturally warmerheadwater system than others in the Rouge River (FMZ1, FMZ 3, FMZ 4), able to provide greaterthermal habitat for a wider range of species.Table 8-1010: : Historic <strong>and</strong> Existing Fish Species in FMZ 2Species NameScientific NameLast Recordamerican brook lamprey Lampetra appendix 8/5/2003b<strong>and</strong>ed killifish Fundulus diaphanus 7/4/1980black crappie Pomoxis nigromaculatus 9/20/2005bluegill Lepomis macrochirus 7/6/2001bluntnose minnow Pimephales notatus 9/20/2005brassy minnow Hybognathus hankinsoni 7/6/2001brook stickleback Culaea inconstans 9/20/2005brown bullhead Ameiurus nebulosus 5/1/1987brown trout Salmo trutta 9/20/2005central stoneroller Campostoma anomalum 9/28/2000common carp Cyprinus carpio 7/6/2001common shiner Luxilus cornutus 9/20/2005creek chub Semotilus atromaculatus 9/20/2005emerald shiner Notropis atherinoides 7/12/1999fathead minnow Pimephales promelas 9/20/2005finescale dace Phoxinus neogaeus 7/12/1999goldfish Carassius auratus 8/5/2003hornyhead chub Nocomis biguttatus 5/26/1954johnny darter Etheostoma nigrum 9/20/2005largemouth bass Micropterus salmoides 9/20/2005longnose dace Rhinichthys cataractae 9/20/2005northern pike Esox lucius 5/1/1987northern redbelly dace Phoxinus eos 9/20/2005pumpkinseed Lepomis gibbosus 9/20/2005rainbow darter Etheostoma caeruleum 9/20/2005rainbow trout Oncorhynchus mykiss 9/20/2005redside dace Clinostomus elongatus 9/20/2005rock bass Ambloplites rupestris 8/5/2003smallmouth bass Micropterus dolomieu 6/12/1999stonecat Noturus flavus 7/20/1982white sucker Catostomus commersoni 9/20/2005yellow bullhead Ameiurus natalis 7/6/2001yellow perch Perca flavescens 5/1/1987Note”: Detailed fish collection records <strong>and</strong> data, in electronic format, are available upon request from TRCA <strong>Aquatic</strong>Group.8-37
FMZ 3: Bruce CreekFigure 8-13 summarizes the existing conditions in Bruce Creek. This zone is considered to stillsupport very high quality fish habitat that supports brook trout in the upper reaches <strong>and</strong> abundantredside dace through the mid-lower reaches. It is relatively non-urban, with natural forest covermixed with agriculture (active <strong>and</strong> fallow) in the upper most reaches, although golf courses becomeprominent below Bethesda Rd <strong>and</strong> a more urbanized l<strong>and</strong>scape dominates below Highway 7.Two strong groundwater discharge zones characterize the headwater brook trout habitat,maintaining the very cold, high quality conditions. Further down in the system, instream structureslimit brook trout distribution both physically <strong>and</strong> through thermal impacts. However, as bothrainbow <strong>and</strong> brown trout are stocked in Bruce Creek, there may be reason to retain this barrier toprovide species partitioning.Bruce’s Mill splits redside dace habitat <strong>and</strong> although the upstream reservoir has been lowered (stoplogs were removed in 2006) the issue of a being fish barrier remains. The Rouge FMP isrecommending the full mitigation of this structure to pass all species. Another groundwaterdischarge zone occurs where redside dace are in highest abundance <strong>and</strong> may be mitigatingthermal impacts <strong>and</strong> water quality associated with ponds <strong>and</strong> adjacent l<strong>and</strong>use.Stream Health: FMZ 3Table 8-11 summaries the indicators of stream health for Bruce Creek. The CCA Score supports theIBI ratings that measure “fair” upstream conditions that improve downstream to “good” coincidentwith where brook trout have been sampled. Stream conditions improve even further to “very good”in 2005 through the middle reaches to the bottom of the zone where redside dace <strong>and</strong> notablegroundwater discharge are present; Bruce Creek is the only stream in the Rouge River watershedto achieve this rating.Despite the improving downstream trend in stream condition, the thermal regime is not stable.Somewhat surprising are temperature data that identifies the upper east headwater tributaries aswarmwater; online ponds are the suspected cause, but a specific study has not been conducted toconfirm this interaction. More in line with expected conditions, the western headwater tributaries arecold <strong>and</strong> reasonably, their confluence with the warmwater is just above Bruce’s Mill. Data loggers in2003 <strong>and</strong> 2005 record the entire remaining reach, downstream of Bruce’s Mill, to be thermallyunstable. That means the fluctuations in summer stream temperatures are wide enough to crossthresholds between thermal habitats. Similar to trends in Berczy Creek, stream temperaturefluctuation is likely a combination of impacts (on-line ponds, adjacent l<strong>and</strong>use) <strong>and</strong> cooling effectsof local groundwater inputs (where the redside dace occur). Benthic invertebrate data in the maincreek is only available just downstream of Bruce’s Mill <strong>and</strong> suggests water quality impairment isoccurring in that part of the reach as benthic data from a side tributary, not influenced by the damor significant upstream drainage, shows no impairment.8-38
Figure 8-1313: : Existing Conditions <strong>and</strong> Issues in Bruce Creek (FMZ 3)8-39
Note: The thermal regime represents actual stream temperatures which have been interpreted for development <strong>and</strong>application of Timing Windows as found in the Rouge River FMP.Table 8-1111: Stream Health of Bruce Creek - FMZ 3Target SpeciesBKT, RSD, ABL,BM, MS, RDIBI RatingBAA RatingTemperature RatingCCA CA Score2003 2005 2003 (RWMP only) 2003 (OSAP) 2005 (Wehrly) 20020 VG 2 VG 1 unimpaired1unstable 2 stableCool: upperrange2 G 2 G 1 pot. Imp.1 no sample 3 mod stable1 F 1 F2 unstable0 P 0 PNo. Stations 3 5 2 2 7Note: the listed “year” indicates from which data set the ratings/scores are based upon. 2003 IBI combines RWMP <strong>and</strong> FMPstations sampled in that year. 2005 IBI are only FMP stations. See Figure 8-5 for IBI Station Locations. VG= Very Good, G =Good, F= Fair, P = Poor.Fish Community Structure: FMZ 3Table 8-12 lists all the fish species historically (37) <strong>and</strong> presently (26) found in Bruce Creek. Themajority of past cold <strong>and</strong> cool water species still persist in the system today, although the distributionof brook trout is assumed to have been more extensive through the small headwaters prior to themany instream barriers. Interestingly, in the past, Bruce Creek has also supported warmwaterspecies (e.g. bass, sunfish, carp) that add to the zone’s relatively high diversity, despite beingcharacterized as coldwater (typically low diversity expected, as previously discussed). The longtimepresence of Bruce’s Mill (erected in 1829) has likely contributed to a shift in thermal regime <strong>and</strong> hasinfluenced the sampling record, which only dates back to the 1950s.Brassy minnow, a target species, has not been sampled recently but does occur in the historicrecord. This minnow is a riparian wetl<strong>and</strong> habitat specialist. Its absence from the sampling recordmay be a result of the habitat not being surveyed or a mis-identification, however, the loss of riparianwetl<strong>and</strong>s has been a general concern as urbanization <strong>and</strong> other l<strong>and</strong>use activities alter thel<strong>and</strong>scape. The current amount of riparian wetl<strong>and</strong> habitat for Bruce Creek can be teased out of thedata on Table 8-3, but an assessment of this habitat quality <strong>and</strong> species use is recommended.Another target species, rainbow darter, is still present in Bruce Creek. As discussed in an earliersection, the loss of this species would likely occur in advance of others if stressors to the systemincrease <strong>and</strong> impacts become more wide spread <strong>and</strong>/or severe. Appropriate monitoring would alsobe recommended for this species.Table 8-1212: : Historic <strong>and</strong> Existing Fish Species in FMZ-3Species NameScientific NameLast Recordamerican brook lamprey Lampetra appendix 8/23/2005black crappie Pomoxis nigromaculatus 9/19/2005blacknose dace Rhinichthys atratulus 9/20/2005bluntnose minnow Pimephales notatus 9/20/2005brassy minnow Hybognathus hankinsoni 7/12/1999brook stickleback Culaea inconstans 7/20/2005brook trout Salvelinus fontinalis 7/29/2005brown bullhead Ameiurus nebulosus 8/10/1994brown trout Salmo trutta 9/20/2005central stoneroller Campostoma anomalum 9/19/2005common carp Cyprinus carpio 9/19/2005common shiner Luxilus cornutus 9/20/20058-40
Species NameScientific NameLast Recordcreek chub Semotilus atromaculatus 9/20/2005emerald shiner Notropis atherinoides 7/12/1999fathead minnow Pimephales promelas 8/23/2005finescale dace Phoxinus neogaeus 7/12/1999golden shiner Notemigonus crysoleucas 7/20/2005goldfish Carassius auratus 8/19/1974iowa darter Etheostoma exile 7/20/2005johnny darter Etheostoma nigrum 9/20/2005largemouth bass Micropterus salmoides 9/19/2005longnose dace Rhinichthys cataractae 9/20/2005mimic shiner Notropis volucellus 5/27/1954mottled sculpin Cottus bairdi 8/14/2003northern pike Esox lucius 8/14/1968northern redbelly dace Phoxinus eos 7/18/1985pumpkinseed Lepomis gibbosus 9/19/2005rainbow darter Etheostoma caeruleum 9/19/2005rainbow trout Oncorhynchus mykiss 8/23/2005redside dace Clinostomus elongatus 8/23/2005river chub Nocomis micropogon 8/26/1999rock bass Ambloplites rupestris 9/20/2005s<strong>and</strong> shiner Notropis stramineus 8/28/2003smallmouth bass Micropterus dolomieu 8/28/2003stonecat Noturus flavus 6/25/1985white sucker Catostomus commersoni 9/20/2005yellow perch Perca flavescens 8/14/1968Note: Detailed fish collection records <strong>and</strong> data, in electronic format, are available upon request from TRCA <strong>Aquatic</strong> Group.FMZ 4: Upper Little Rouge RiverFigure 8-14 summarizes the existing conditions <strong>and</strong> issues in the Upper Little Rouge River. Ingeneral, habitat conditions within reaches are in good quality <strong>and</strong> support high diversity with brooktrout <strong>and</strong> redside dace present along with six other target species that range from coldwater habitat(mottled sculpin, American brook lamprey) to cool water habitat (brassy minnow, pearl dace, rainbowdarter, hornyhead chub ). However, habitat fragmentation by on-line ponds <strong>and</strong> instream barriers aresignificant issues for this zone. The concern over on-line ponds contributing to downstream warmingis also relevant here. There are currently only four limited coldwater reaches still supporting brooktrout (3 in the top headwaters, 1 middle reach). The distribution of redside dace is more widespreadthrough habitat in the middle reaches but the stocking of both rainbow trout <strong>and</strong> brown trout alsooccur in the same reaches.Potential urban impact issues are largely confined to the eastern tributaries (drains Stouffville area)as the majority of other l<strong>and</strong>cover is a mix of natural (including Oak Ridges Moraine <strong>and</strong> Greenbeltspace) <strong>and</strong> agriculture with only a few golf courses. There are several known areas of significantgroundwater discharge, but the two of the four known brook trout populations are concentrated inreaches that receive augmented groundwater from privately flowing wells. This is a similar situationas discussed for the Upper Main Rouge River (FMZ 1) that identified the vulnerability of the coldwaterhabitat to those wells being “turned off”.8-41
Figure 8-1414: : Existing Conditions <strong>and</strong> Issues in the Headwaters of the Little Rouge River (FMZ 4)Note: The thermal regime represents actual stream temperatures which have been interpreted for development <strong>and</strong> application of TimingWindows as found in the Rouge River FMP.8-42
Stream Health: FMZ 4Table 8-13 summarizes the indicators of stream health for the headwaters of the Little Rouge River.The dominant trend shown through IBI ratings is a relatively healthy “unimpaired” system. Thetributaries to the east drain the urban centre of Stouffville, but an IBI rating of “good” is achievedconsistently at 5 different sites in 2003 <strong>and</strong> 2005. Sites that drain some of the western tributariesshow greater range in stream condition from “fair” in the smallest headwater streams (2003 <strong>and</strong>2005) to “good” in the middle reaches. There are several streams that are “warm” but have not beensampled for fish, so it is difficult to interpret the influence these reaches may be contributing todownstream habitat. A cumulative IBI rating of “fair” is measured where the upper streams (east <strong>and</strong>west) confluence <strong>and</strong> habitat shifts to warmwater, but the data does not suggest impairment.Varying degrees of thermal instability (moderately stable to stable) are measured in 2005 throughoutthe upper most reaches where groundwater influences are strongest. The majority of stabletemperatures occur coincident with brook trout habitat. Lower down in the system, thermal stabilityweakens as stream temperatures experience wide fluctuations (2003 <strong>and</strong> 2005), likely in response toupstream cumulative impacts of on-line ponds. Redside dace are found in the slightly cooler waterslower down in this FMZ where IBI scores all measure good stream health, as do the limited numberof benthic invertebrate scores.The predicted CCA Score (warm) representing the east tributaries flowing proximal to Stouffvillereflect a warm water condition that is bordering on the threshold to being suitable for only the moretolerant species. Clearly, the IBI scores <strong>and</strong> present fish community give strong evidence that thesereaches are not in a degraded condition as predicted by the LSAT model (see Figure 8-6). Factorsthat could explain the deviation from expected are the two flowing wells assumed to be contributing aregular supply of cold water to these upper reaches. The LAST model bases potential groundwaterinputs on geology, slope <strong>and</strong> catchment area <strong>and</strong> can not take into account groundwateraugmentation. The fact that the model predicts an improvement once all tributaries in the zone areconsidered (CCA Score indicates a slight shift towards cool water conditions) makes sense as thel<strong>and</strong>scape across the rest of the zone is still relatively natural with some very significant “natural”groundwater contributions.Table 8-1313: Stream Health of Little Rouge River - FMZ 4Target SpeciesBKT, RSD, RD,MSIBI RatingBAA RatingTemperature Rating2003 2005 2003 (RWMP only) 2003 (OSAP) 2005 (Wehrly) 20020 VG 0 VG 3 unimpaired 2mod stable 5 stable (hw)5 G 4 G1unstable 5 mod stable1 F 0 F(hw)0 P 0 P1 stable (mid)4 mod-stableCCA CA ScoreWarm: mid-range(east tribs only)warm: lower range(main stem,cumulative )(low)No. Stations 6 4 3 3 15Note: the listed “year” indicates from which data set the ratings/scores are based upon. 2003 IBI combines RWMP <strong>and</strong> FMPstations sampled in that year. 2005 IBI are only FMP stations. See Figure 8-5 for IBI Station Locations. VG= Very Good, G =Good, F= Fair, P = Poor; hw=headwater, mid=middle reaches of zone; low=lowest downstream reaches of zone.8-43
Fish Community Structure: FMZ 4Table 8-14 lists all the fish species historically (32) <strong>and</strong> presently (25) found in the Upper LittleRouge River. The present fish community maintains the full complement of species found in thehistoric records (1950s -1972) which was dominated by cool-cold water species, including brooktrout <strong>and</strong> redside dace. This is strong evidence indicating the headwater system has maintained ahigh degree of ecological integrity. However, some degree of habitat shift has occurred based onstream conditions <strong>and</strong> the fact that there are quite a few warmwater species found today that werenot present in past records (i.e., central stoneroller, brook stickleback, brown bullhead, hornyheadchub, largemouth bass, pumpkinseed <strong>and</strong> rock bass). These species are adding to the surprisinglyhigh level of diversity for a headwater system <strong>and</strong> are likely utilizing the on-line pond habitat thathas become increasingly prevalent in the l<strong>and</strong>scape. Also contributing to the diversity are thestocked salmonids: rainbow trout <strong>and</strong> brown trout.Table 8-1414: : Historic <strong>and</strong> Existing Fish Species in FMZ 4Species NameScientific NameLast Recordatlantic salmon Salmo salar 9/1/2000blacknose dace Rhinichthys atratulus 9/12/2005bluntnose minnow Pimephales notatus 9/12/2005brassy minnow Hybognathus hankinsoni 8/12/2003brook stickleback Culaea inconstans 8/20/2005brook trout Salvelinus fontinalis 8/11/2005brown bullhead Ameiurus nebulosus 8/20/2005brown trout Salmo trutta 9/12/2005central stoneroller Campostoma anomalum 9/12/2005coho salmon Oncorhynchus kisutch 8/17/1989common shiner Luxilus cornutus 9/12/2005creek chub Semotilus atromaculatus 9/12/2005fathead minnow Pimephales promelas 6/14/2005Goldfish Carassius auratus 6/11/2001hornyhead chub Nocomis biguttatus 7/29/2003iowa darter Etheostoma exile 8/12/2003johnny darter Etheostoma nigrum 9/12/2005largemouth bass Micropterus salmoides 8/20/2005longnose dace Rhinichthys cataractae 9/12/2005mottled sculpin Cottus bairdi 9/12/2005northern hog sucker Hypentelium nigricans 10/7/1983northern redbelly dace Phoxinus eos 8/17/1989pearl dace Margariscus margarita 8/20/2005Pumpkinseed Lepomis gibbosus 7/31/2003rainbow darter Etheostoma caeruleum 9/12/2005rainbow trout Oncorhynchus mykiss 9/12/2005redside dace Clinostomus elongatus 9/12/2005rock bass Ambloplites rupestris 7/12/2005smallmouth bass Micropterus dolomieu 7/7/1987Stonecat Noturus flavus 7/31/2003white sucker Catostomus commersoni 9/12/2005Note: Detailed fish collection records <strong>and</strong> data, in electronic format, are available upon request from TRCA <strong>Aquatic</strong> Group.8-44
FMZ 5: Central Main Rouge River (Toogood Pond <strong>and</strong> Milne Reservoir)Figure 8-15 summarizes the existing conditions in the main branch of the Rouge River as itpasses through the centre of the watershed <strong>and</strong> Milne Reservoir. Although the area alsocaptures the drainage flowing out of Berczy <strong>and</strong> Bruce Creeks , the influence of Milne Reservoiris considered the driver of habitat condition with backwater effects slowing down flow <strong>and</strong>causing significant sedimentation. As a result, the local conditions are warmwater riverine <strong>and</strong>pond habitat, not suitable for brook trout or redside dace. Should stream conditions improvethrough any future rehabilitation efforts, appropriate target species are rainbow darter <strong>and</strong>brassy minnow. Target species selected to reflect the recreational angling potential of theponds are yellow perch <strong>and</strong> largemouth bass.The stream reach between Toogood Pond <strong>and</strong> Milne Reservoir is maintained a migratorycorridor for lake run species like rainbow trout. These species <strong>and</strong> resident native communitiesrely on the managed fishways at Milne Reservoir <strong>and</strong> Toogood Pond to access higher qualityupstream habitat in Bruce <strong>and</strong> Berczy Creeks.Stream Health: FMZ 5Table 8-15 summarizes the indicators of stream health for the main branch of the Rouge Riveras it flows through the centre of the watershed. The only RWMP station for this zone is locatedat the most upstream end of this FMZ. The associated IBI rating for this station is “poor” <strong>and</strong> ismeasuring cumulative impacts from Beaver Creek <strong>and</strong> the upper/middle Main Rouge River,which separately had IBI ratings of “fair”. Also in 2003, a FMP station was located downstreamof Toogood pond, after the confluence with the main branch. Both the IBI ratings <strong>and</strong> CCAscore along the main channel show improved conditions. It is likely that diffuse groundwaterinputs from regional aquifers (Figure 8-1 <strong>and</strong> Figure 8-2) are reaching the main branch <strong>and</strong>providing some mitigation.Temperature data was not available for 2003. The 2005 temperatureloggers registered warmwater conditions that are thermally stable below Toogood Pond alongthe Main Branch.The benthic invertebrate rating of “potentially impaired” can not be considered descriptive forthe whole zone because of the upstream location of the sampling point. This particular samplefor invertebrates poses some difficult interpretation when the individual indices are examined alittle closer. For example, the benthic communities suggest issues of organic pollution (highproportion of midges) <strong>and</strong> nutrients; the index that scores for the presence of very sensitivespecies is low (i.e., EPT) <strong>and</strong> could reflect deposition of fines or poor water quality. It is unclearif one metric is bringing down the overall score or all these issues are “equally” significant inthis reach. A measure of clarification could be achieved if the midge community was analyzedat the species level as there is a gradient of tolerance to organic pollution that is likely beingmasked.8-45
Figure 8-1515: : Existing Conditions <strong>and</strong> Issues in Central Main Rouge River (Toogood Pond &Milne Reservoir) FMZ 5Note: The thermal regime represents actual stream temperatures which have been interpreted for development<strong>and</strong> application of Timing Windows as found in the Rouge River FMP.8-46
Table 8-1515: Stream Health of Central Main Rouge River (Toogood Pond & Milne Reservoir)FMZ 5TargetSpeciesNP, YP,BM, LMB,RDIBI RatingBAA RatingTemperature RatingCCA CA Score2003 2005 2003 (RWMP only) 2003 (OSAP) 2005 (Wehrly) 20020 VG No 1 impaired no sample 2 stable Warm : upper0 G stationrange (21 Fstations in1 Pmain branch)No. Stations 2 0 1 1 2Note: the listed “year” indicates from which data set the ratings/scores are based upon. 2003 IBI combines RWMP<strong>and</strong> FMP stations sampled in that year. 2005 IBI are only FMP stations. See Figure 8-5 for IBI Station Locations. VG=Very Good, G = Good, F= Fair, P = Poor.Fish Community Structure: FMZ 5Table 8-16 lists all the fish species historically (32) <strong>and</strong> presently (15) found in the central mainbranch of the Rouge River. The present fish community is largely warmwater <strong>and</strong> comprised ofmany generalist species (e.g. blacknose dace, brook stickleback, bluntnose minnow, carp,creek chub, fathead minnow). From this table there appears to be a loss in the samplingrecord of warmwater habitat specialists, i.e., brassy minnow, redside dace, Iowa darter, s<strong>and</strong>shiner <strong>and</strong> emerald shiner. These species require a range of habitat types characteristic ofreaches occurring mid-watershed, including riparian wetl<strong>and</strong>, deep pools, slow moving water,clean s<strong>and</strong>-gravel substrates. As a result of the sedimentation impacts of Milne Reservoir,current substrates have changed <strong>and</strong> no longer provide the specific habitat needs of theseminnow species.Of particular note is the presence of the target species rainbow darter. The LSAT model cangenerate a specific prediction around this species (i.e. CCA AXIS 1 score). Through thewatershed analysis of current conditions, rainbow darter is predicted to be at the threshold ofdecline in the lower half of the watershed. The extirpation of this species has been observed inneighbouring, more heavily urbanized watersheds. As future development has already beenapproved for much of the remaining non-urban area in this zone, it will be important tospecifically assess the population status of rainbow darter. Declines in this species mayprovide an early warning of a forthcoming <strong>and</strong> severe impairment of the biotic system, as wellas provide a rationale for priority management recommendations.Table 8-1616: : Historic <strong>and</strong> Existing Fish Species in FMZ 5Species NameScientific NameLast Recordblack crappie Pomoxis nigromaculatus 4/8/2001blacknose dace Rhinichthys atratulus 9/19/2005bluntnose minnow Pimephales notatus 9/19/2005brassy minnow Hybognathus hankinsoni 8/15/1984brook stickleback Culaea inconstans 9/13/2005brown bullhead Ameiurus nebulosus 4/5/2000brown trout Salmo trutta 8/4/2000central stoneroller Campostoma anomalum 4/4/20018-47
Species NameScientific NameLast Recordcommon carp Cyprinus carpio 4/4/2001common shiner Luxilus cornutus 9/19/2005creek chub Semotilus atromaculatus 9/19/2005emerald shiner Notropis atherinoides 4/15/1997fathead minnow Pimephales promelas 9/13/2005golden shiner Notemigonus crysoleucas 5/2/2000Goldfish Carassius auratus 5/2/2000iowa darter Etheostoma exile 6/4/1991johnny darter Etheostoma nigrum 9/19/2005largemouth bass Micropterus salmoides 5/2/2000longnose dace Rhinichthys cataractae 9/19/2005mimic shiner Notropis volucellus 5/26/1954northern pike Esox lucius 4/10/2001northern redbelly dace Phoxinus eos 9/13/2005Pumpkinseed Lepomis gibbosus 9/19/2005rainbow darter Etheostoma caeruleum 9/19/2005rainbow trout Oncorhynchus mykiss 8/11/2003redside dace Clinostomus elongatus 5/26/1954rock bass Ambloplites rupestris 9/19/2005s<strong>and</strong> shiner Notropis stramineus 8/15/1984smallmouth bass Micropterus dolomieu 9/13/2005Stonecat Noturus flavus 8/17/2000white sucker Catostomus commersoni 9/19/2005yellow perch Perca flavescens 4/8/2001Note: Detailed fish collection records <strong>and</strong> data, in electronic format, are available upon request from TRCA <strong>Aquatic</strong>Group.FMZ 6: Robinson Creek <strong>and</strong> Mt. Joy Creek (formerly Exhibition Creek)Figure 8-16 summarizes the existing conditions in Robinson Creek <strong>and</strong> Mt. Joy Creek locatedin the middle of the watershed. The Robinson Creek channel starts around Elgin Mills (wetl<strong>and</strong>habitat) <strong>and</strong> is well defined to the confluence with the main Rouge just south of Highway 7.There has been some historic (1954 ODPD) <strong>and</strong> more recent fish data (2000, 2003 TRCA)collected from upstream <strong>and</strong> downstream sections. The data suggests that past stream flowsmay have been sufficient to allow for only seasonal or opportunistic habitation of the upstreamchannel by cool <strong>and</strong> warmwater species. Rainbow trout have been recently found to spawn inthe lowest reaches of this system (2001 – 2005).A cool-coldwater regime characterizes Mt. Joy Creek, however, the upper half of Mt. Joy is ahighly altered system (hard channelized reach, online storm pond) that experiences seasonallydry conditions above 16 th Avenue. Only 2 fish species were collected in 2003 (fathead minnow<strong>and</strong> bluntnose minnow) <strong>and</strong> the selected target species for Robinson Creek may not beappropriate for this reach.8-48
Figure 8-1616: : Existing Conditions <strong>and</strong> Issues in Robinson Creek <strong>and</strong> Mt. Joy Creek (FMZ 6)Note: The thermal regime represents actual stream temperatures which have been interpreted for development<strong>and</strong> application of Timing Windows as found in the Rouge River FMP.8-49
Stream Health: FMZ 6Table 8-17 summarizes the indicators of stream health for Robinson Creek <strong>and</strong> Mt. Joy beforethey confluence with the main branch in the centre of the watershed. There are 2 RWMPstations <strong>and</strong> 1FMP station in this zone (all three stations were sampled in 2003). RobinsonCreek only has a RWMP station at the bottom of the stream; Mt Joy only has one FMP stationjust at the confluence with the main channel. The second RWMP station is located in the mainbranch, downstream of both watercourses <strong>and</strong> therefore measures the cumulative effects fromall upstream drainage.The downstream point of Robinson Creek measured an IBI rating of “fair”. This reach wasmeasured as thermally stable (cold) in 2003 <strong>and</strong> 2005 but it is difficult to assess this metric dueto the pumping of cold water into Robinson Creek upstream of the sampling site. The benthicinvertebrate community is “potentially impaired” (2003) but may be more reflective of thechanges in stream morphology or habitat structure rather than water quality.The only natural habitat conditions in Mt. Joy are observed through the downstream half of thewatercourse, but the Fish IBI rating measured “poor”. Benthic invertebrates were not collectedtherefore no assessment for water quality is available. However, field observations during the2003 FMP fish survey noted a persistent organic odour suggestive of sewage. Given thatinstream habitat structures in the lower section appear “functional”, water quality impacts maybe the limiting factor to the fish community.Table 8-1717: Stream Health of oRobinson Creek <strong>and</strong> Mt. Joy Creek - FMZ 6Target SpeciesRSD, PD, RDRobinson CreekonlyIBI RatingBAA Rating2003 2005 2003 (RWMPonly)0 VG No 2 pot. impaired 1stable0 G stations(Rob. Ck.)1 F1 mod stable2 Pmain branchTemperature Rating2003 (OSAP) 2005 (Wehrly) 20021 stable(Rob. Ck.)1 stableMt. JoyCCA CA ScoreNotavailableNo. Stations 3 0 2 2 1Note: the listed “year” indicates from which data set the ratings/scores are based upon. See Figure 8-5 for IBIStation Locations. VG= Very Good, G = Good, F= Fair, P = Poor.Fish Community Structure: FMZ 6Table 8-18 lists all the fish species historically (26) <strong>and</strong> presently (12) found in the Robinson<strong>and</strong> Mt. Joy Creeks. Recent survey count is only 12 species, mostly found in Robinson Creek,but the historic diversity of fish species is very high in this zone, ranging from cool, sensitive,habitat specialists to warm, <strong>and</strong> tolerant pond species. The current community reflects thehistoric coolwater species but also a shift to coldwater, migratory rainbow trout in RobinsonCreek (downstream of Hwy 7) <strong>and</strong> less pond/large riverine species. The presence of rainbowtrout maybe a result of the temporary increased coldwater volume; as this system stabilizes, itis not clear whether these fish will continue to access this zone (for spawning).The fish species more typical of pond or large riverine habitat were largely caught prior to 2000(i.e., smallmouth bass, largemouth bass, emerald shiner, stonecat, rock bass <strong>and</strong> goldfish).The use of seine nets, in addition to electrofishing, was more widely practiced prior to 2000 <strong>and</strong>8-50
would be effective at capturing these “pond” species which likely passed between RobinsonCreek <strong>and</strong> the Main Rouge River.The absence of northern redbelly dace since 1954, a definitive riverine species, is moreindicative of “species loss” rather than a switch in sampling method. Related, <strong>and</strong> of particularnote, is the continued presence of pearl dace, as these two minnow species utilize similarhabitat (cool, clear pools) <strong>and</strong> are often found together (Scott <strong>and</strong> Crossman, 1973). The maindifference being that northern redbelly dace have stronger preference for aquatic vegetation.Table 8-1818: : Historic <strong>and</strong> Existing Fish Species in FMZ F6Species NameScientific NameLast Recordblack crappie Pomoxis nigromaculatus 8/29/2001blacknose dace Rhinichthys atratulus 8/15/2005bluntnose minnow Pimephales notatus 8/8/2003brook stickleback Culaea inconstans 8/15/2005brown bullhead Ameiurus nebulosus 8/29/2001brown trout Salmo trutta 6/25/2003common carp Cyprinus carpio 8/29/2001common shiner Luxilus cornutus 10/12/2002creek chub Semotilus atromaculatus 8/15/2005emerald shiner Notropis atherinoides 8/10/1994fathead minnow Pimephales promelas 8/8/2003goldfish Carassius auratus 4/22/1998johnny darter Etheostoma nigrum 10/12/2002largemouth bass Coregonus clupeaformis 8/22/1996longnose dace Rhinichthys cataractae 8/15/2005northern redbelly dace Phoxinus eos 6/4/1954pearl dace Margariscus margarita 8/15/2005pumpkinseed Lepomis gibbosus 10/12/2002rainbow darter Etheostoma caeruleum 6/25/2003rainbow trout Oncorhynchus mykiss 8/15/2005redside dace Clinostomus elongatus 8/15/2005rock bass Ambloplites rupestris 8/10/1994smallmouth bass Micropterus dolomieu 9/27/1983spottail shiner Notropis hudsonius 8/10/1994stonecat Noturus flavus 6/3/1985white sucker Catostomus commersoni 8/15/2005Note: Detailed fish collection records <strong>and</strong> data, in electronic format, are available upon request from TRCA <strong>Aquatic</strong>Group.FMZ 7: Lower Little Rouge RiverFigure 8-17 summarizes the existing conditions in the mid to lower reaches of the Little RougeRiver. Transition from a cold-cool water system found upstream in FMZ 4 to good qualitywarmwater habitat is considered a naturally occurring habitat shift. The presence of RougePark (see Terrestrial <strong>System</strong> chapter of this report for Rouge Park boundary), providesrelatively undeveloped, high quality overl<strong>and</strong> <strong>and</strong> riparian habitat through most of the Lower8-51
Little Rouge <strong>and</strong> is quite a different circumstance than other watersheds in an urban setting.The key target species in this zone is rainbow darter with a series of other sensitive warmwatertarget species: central mudminnow, pearl dace, hornyhead chub <strong>and</strong> rosyface shiner.Figure 8-1717: : Existing Conditions & Issues in Mid to Lower Reaches of the Little Rouge (FMZ 7)Note: The thermal regime represents actual stream temperatures which have been interpreted for development <strong>and</strong> application ofTiming Windows as found in the Rouge River FMP.8-52
Mussels are also presence in the Little Rouge. These are benthic invertebrates that can beimpacted by many of the same stresses that affect the broader fish community. There has notbeen a quantitative mussel survey done in the Rouge, however, there has been sampling doneby a volunteer, special interest group to identify both species presence <strong>and</strong> relativeabundance. From this work, the middle portion of the Little Rouge has been identified as one ofthe only remaining areas of the watershed where there is a small population of freshwatermussels. The habitat in this area is low slope <strong>and</strong> dominated by soft sediments <strong>and</strong> turbidwater conditions. This is not ideal habitat for all freshwater mussel species, but it does offer theopportunity for improving conditions to support the existing population. Additionally, this areaof the watershed may allow for the potential expansion of both habitat, <strong>and</strong> species abundancebecause of its connectivity to the Lake Ontario ecosystem.Baseflow measurements indicate a “loss in stream flow” in these reaches coincident withriparian wetl<strong>and</strong> habitat. Soils may be retaining significant amounts of sub-surface groundwaterdischarge. Based on the gentle slope gradient <strong>and</strong> soils in the Little Rouge Riversubwatershed, it is unlikely that this system was ever coldwater however, one coldwatertributary <strong>and</strong> one coolwater tributary (i.e. Katabokokonk) are present in the upper reaches.They both appear to be sourced by local groundwater contributions (see Figure 8-2).Katabokokonk Creek has experienced some apparent changes in summer flow regime (bothdry <strong>and</strong> flowing conditions have been measured) over the past several years but furtherinvestigations are required to underst<strong>and</strong> the dynamics of this reach.Two main issues within this zone are flows in the lowest reaches <strong>and</strong> opportunity for aquaticinvasive species (AIS) to enter the Little Rouge River system. First, summer stream flow (baseflow) is very low in the lower reaches, including the “main stem” which has a stream order of 5.Despite low baseflow, there is visual evidence of significant erosion suggestive of higher orperhaps flashier surface flow. The stream channel may be widening due to exposed bedmaterial consisting of hard-packed substrates which are not amenable to down-cutting.Instead, the stream flow is likely being forced to spread out laterally <strong>and</strong> cut the sides of thechannel (i.e. erosion). It unclear if this is a natural process or accelerated from changes inwatershed hydrology.The second issue is the vulnerability of the Little Rouge River to aquatic invasive species (AIS)from Lake Ontario, such as round goby <strong>and</strong> sea lamprey. There is currently no barrier at themouth of the river. This allows for the migration of lakerun salmonids to access the uppertributaries for spawning but anything else can also enter <strong>and</strong> theoretically reach theheadwaters. The current practice for managing sea lamprey is under the m<strong>and</strong>ate of theCanadian Department of Fisheries <strong>and</strong> Oceans (DFO. 3-trifluoromethyl-4nitrophenol (TFM) is apesticide that targets the ammocoete stage of lamprey <strong>and</strong> has been shown to be fairlyspecies specific, though some other species may also be affected (e.g. white sucker, catfish,mudpuppies) (Boogaard et al., 2003; Hewitt et al., 1998; Bills <strong>and</strong> Johnson, 1992). TFM isapplied on a 3 year cycle to the lower reaches of the Little Rouge <strong>and</strong> Main Rouge Rivers.There are numerous recreational destinations within Rouge Park, such as angling, camping<strong>and</strong> nature trail opportunities. Further details are presented in the Chapter 12 (Nature-basedRecreation).8-53
Stream Health: FMZ 7IBIs calculated based on 2003 data show poorer stream health, in general, than the 2005scores (Table 8-19). The two tributaries with monitoring stations, including Katabokkonk,showed “poor’ ratings in the system supporting only generalist fish species (fathead minnow,blacknose dace, creek chub, brook stickleback). Trends in the main stem of the Little Rougeare consistent with better habitat conditions (fair to good) over both sampling years. Thishealthier condition of the main stem is reflected in the benthic invertebrate community withconsistently ‘unimpaired’ scores. This suggests flow contributions from side tributaries play aminor role in the water quality or instream habitat structure of the main stem. Rather, therelative health of fish communities <strong>and</strong> benthic organisms in the Little Rouge River, ascompared to areas in the Main Rouge River, is likely a reflection of the less urbanizedl<strong>and</strong>scape.Of most concern are the maximum summer stream temperatures in the lower reaches of theLittle Rouge, which have some stations recording >32 0 C. Solar heating of large instreamboulders is considered a main cause of warming. Stream exposure to the sun is maximized onaccount of the lack of any tree canopy. As the stream flows over <strong>and</strong> around the hot rocks,heat transfer to the water would have a direct <strong>and</strong> continual pathway. It is assumed that thereis refuge habitat available as a fairly diverse community of warmwater species still persist.Fish CCA scores reflect this concern around thermal regime as the predicted warming trend inthe lower reaches of the Little Rouge River would be compatible with only the most tolerantwarmwater species. The same cautionary note for rainbow darter as noted for FMZ 5 (i.e.,approaching its threshold) is applicable to the Little Rouge River as well.Table 8-1919: Stream Health of Mid to Lower Reaches of the Little Rouge River - FMZ 7TargetSpeciesCM, PDHHC,RD, RFSIBI RatingBAA RatingTemperature Rating2003 2005 2003 (RWMP only) 2003 (OSAP) 2005 (Wehrly) 20020 VG 0VG 3 unimpaired 2 unstable 3 mod stable0 G 4 G1 no data 3 unstable4 F 2 F1 P 1 PCCA CA Scorewarm: lower range(top of FMZ)warm: upper range(bottom of FMZ;cumulative)No. 5 7 3 3 6StationsNote: the listed “year” indicates from which data set the ratings/scores are based upon. 2003 IBI combines RWMP<strong>and</strong> FMP stations sampled in that year. 2005 IBI are only FMP stations. See Figure 8-5 for IBI Station Locations. VG=Very Good, G = Good, F= Fair, P = Poor.Fish Community Structure: FMZ 7Table 8-20 lists all the fish species historically (44) <strong>and</strong> presently (28) found in the mid to lowerreaches of the Little Rouge River (2003/2005). The warmwater fishery in the Little Rouge Riversupports high diversity relative to other urban watersheds. The presence of Rouge Park isrecognized as having a significant buffering effect to urbanization pressures. A number ofspecies not present in recent collection records reflect more pond or large riverine/coastalhabitat (e.g. largemouth bass, emerald shiner, white bass) <strong>and</strong> are not as easily capturedthrough electrofishing. More telling of a decline or loss in habitat conditions are cold-cool water8-54
species (i.e. Americal Brook Lamprey, redside dace) <strong>and</strong> warmwater habitat specialists (i.e.,brassy minnow, central mudminnow, mimic shiner) not being present in the collection recordfor over 20 years.Table 8-2020: : Historic <strong>and</strong> Existing Fish Species in FMZ 7Species NameScientific NameLast Recordamerican brook lamprey Lampetra appendix 6/12/1972black crappie Pomoxis nigromaculatus 9/9/2005blacknose dace Rhinichthys atratulus 9/9/2005bluntnose minnow Pimephales notatus 9/9/2005brassy minnow Hybognathus hankinsoni 6/14/1972brook stickleback Culaea inconstans 8/10/2005brown bullhead Ameiurus nebulosus 9/9/2005brown trout Salmo trutta 11/6/2000central mudminnow Umbra limi 7/3/1984central stoneroller Campostoma anomalum 9/9/2005chinook salmon Oncorhynchus tshawytscha 10/19/1984common carp Cyprinus carpio 8/21/2000common shiner Luxilus cornutus 9/9/2005creek chub Semotilus atromaculatus 9/9/2005emerald shiner Notropis atherinoides 6/9/1972fathead minnow Pimephales promelas 8/23/2005gizzard shad Dorosoma cepedianum 8/8/2005golden shiner Notemigonus crysoleucas 6/9/1972hornyhead chub Nocomis biguttatus 9/9/2005johnny darter Etheostoma nigrum 9/9/2005lake chub Couesius plumbeus 10/1/2003largemouth bass Micropterus salmoides 7/9/1998logperch Percina caprodes 8/8/2005longnose dace Rhinichthys cataractae 9/9/2005mimic shiner Notropis volucellus 6/2/1954mottled sculpin Cottus bairdi 8/26/1992northern hog sucker Hypentelium nigricans 10/19/1983northern redbelly dace Phoxinus eos 8/23/2005pearl dace Margariscus margarita 9/23/1996pumpkinseed Lepomis gibbosus 9/9/2005rainbow darter Etheostoma caeruleum 9/9/2005rainbow trout Oncorhynchus mykiss 8/23/2005redside dace Clinostomus elongatus 6/15/1972river chub Nocomis micropogon 8/22/2005rock bass Ambloplites rupestris 9/9/2005rosyface shiner Notropis rubellus 8/8/2005s<strong>and</strong> shiner Notropis stramineus 8/22/2005smallmouth bass Micropterus dolomieu 9/9/2005spotfin shiner Cyprinella spiloptera 8/8/2005spottail shiner Notropis hudsonius 9/9/2005stonecat Noturus flavus 8/22/20058-55
Species NameScientific NameLast Recordtrout-perch Percopsis omiscomaycus 6/3/1953white bass Morone chrysops 7/3/1984yellow perch Perca flavescens 8/8/2005Note: Detailed fish collection records <strong>and</strong> data, in electronic format, are available upon request from TRCA <strong>Aquatic</strong>GroupFMZ 8: Lower Main Rouge River <strong>and</strong> Morningside TributaryFigure 8-18 summarizes the existing conditions in Morningside Tributary <strong>and</strong> the Main RougeRiver as it flows through the lower watershed from Milne Dam into the estuary. This section ofthe main branch is warmwater habitat with a progression towards habitat impairment in thedownstream portion coincident with urban intensification. However, groundwater seepagealong the banks of the main branch combined with significant tracks of natural cover (i.e.,Rouge Park) are assumed to provide a level of mitigation to this bottom stretch of the RougeRiver. The target species for the main branch are sensitive warmwater species (rainbow darter,brassy minnow, hornyhead chub, rosyface shiner). However, Morningside Tributary doesinclude the key target species redside dace. Target species in Morningside Tributary are thesame with the addition of redside dace. Stocking of both rainbow <strong>and</strong> brown trout occurs alongthe main branch with recreational angling a common activity.The main branch of the Rouge is free of instream barriers right up Hwy 7 in Markham (FMZ 1)<strong>and</strong> is a well utilized migratory corridor for lake run fish species. This also means that invasivespecies have access to the same upper reaches (if in operation, the fishway at Milne Reservoirprovides a level of protection to Bruce <strong>and</strong> Berczy Creeks). A case in point is the round goby,an invasive species that has recently been detected (2006) in the main branch with a positiveidentification at Highway 2.Morningside Tributary warrants a separate discussion as this watercourse supports a smallpopulation of redside dace. Presently, the redside dace population is confined to the top of thewatercourse where suitable habitat <strong>and</strong> groundwater inputs are found. The challenges for thisspecies to overcome are multiple <strong>and</strong> include high, flashy storm flows, many instream barriersthat prevent dace from returning to good habitat if they are washed below the structures <strong>and</strong>possible predation pressure from stocked salmonids (Table 8-21).Stream Health: FMZ 8Fish CCA scores together with IBIs calculated based on 2003 data in the main branch of theRouge, reflect largely ‘poor’ habitat quality (Table 8-21 ). IBI scores in the upper reaches ofMorningside Tributary ranged from “fair” (2003) to “good” in 2005. This is spatially coincidentwith where redside dace currently remain.There are issues of thermal instability in both the main branch of the Rouge <strong>and</strong> MorningsideTributary. Although absolute summer temperatures in the main Rouge are not as extreme as inthe Little Rouge River, the data indicates the “shift” between cool water habitat in the upperzones (FMZ 5 <strong>and</strong> 6) to warmwater in the main branch is abrupt (Figure 8-8). This is likely acombined influence of natural shifts in stream temperatures as the channels widens <strong>and</strong>cumulative effects of upstream drainage (e.g. heated water from Milne Reservoir) The streamtemperature fluctuations observed in Morningside Tributary are largely attributed to stormwaterinputs from upstream development. The benthic invertebrate scores are highly varied <strong>and</strong> do8-56
not follow a downstream gradient of impairment. Interpretation of these scores would benefitfrom more localized knowledge of the FMZ <strong>and</strong>/or species information.Figure 8-1818: : Existing Conditions & Issuessues in Lower Main Rouge & Morningside Trib (FMZ 8)Note: The thermal regime represents actual stream temperatures which have been interpreted for development <strong>and</strong>application of Timing Windows as found in the Rouge River FMP.8-57
Table 8-2121: Stream Health of Lower Main Rouge River <strong>and</strong> Morningside Tributary - FMZ 8TargetSpeciesRD, RFS,HHC, BM,RSD(MT only)IBI RatingBAA RatingTemperature RatingCCA CA Score2003 2005 2003 (RWMP only) 2003 (OSAP) 2005 (Wehrly) 20022P(MB) 1G(MB) 2 potentially 2 unstable 3 mod stable warm: upper2F(MT) 1P(MB) impaired (MB) 1 no data 3 unstable range1P(MT) 1G(MT) 1 unimparied (MB)(no change1F(MT) 1P(MT) 2 potentiallythrough mainimpaired (MT)branch)1 unimpaired (MT)6 4 3 3 6No.StationsNote: the listed “year” indicates from which data set the ratings/scores are based upon. 2003 IBI combines RWMP<strong>and</strong> FMP stations sampled in that year. 2005 IBI are only FMP stations. MB=Main Branch, MT=MorningsideTributary. See Figure 8-5 for IBI Station Locations. VG= Very Good, G = Good, F= Fair, P = Poor.Fish Community Structure: FMZ 8Table 8-22 lists all the fish species historically (43) <strong>and</strong> presently (23) found in the main branchof the Rouge River <strong>and</strong> Morningside Tributary. Recent sampling found 23 species, includingthe invasive round goby (September 2006 at Highway 2). As has been reported for FMZ 5, 7<strong>and</strong> 10, most of the shifts in species once found in the past sampling record reflect habitatspecialists or species more likely to be sampled using techniques other than electrofishing.Essentially, from a habitat condition perspective, the main branch is trending towardsgeneralist species <strong>and</strong> tolerant invasives, like carp with species, such as rainbow darter,nearing their habitat threshold.Table 8-2222: Historic <strong>and</strong> Existing Fish Species in FMZ 8Species NameScientific NameLast RecordAlewife Alosa pseudoharengus 6/9/1972black crappie Pomoxis nigromaculatus 7/30/2003blacknose dace Rhinichthys atratulus 8/15/2005bluntnose minnow Pimephales notatus 8/5/2005Brassy minnow Hybognathus hankinsoni 7/4/1996brook stickleback Culaea inconstans 7/15/2005brown bullhead Ameiurus nebulosus 9/5/1995brown trout Salmo trutta 8/15/2005Central mudminnow Umbra limi 6/9/1972Central stoneroller Campostoma anomalum 8/15/2005chinook salmon Oncorhynchus tshawytscha 10/19/1984coho salmon Oncorhynchus kisutch 10/18/1984common carp Cyprinus carpio 7/14/2005common shiner Luxilus cornutus 8/5/2005creek chub Semotilus atromaculatus 8/15/2005emerald shiner Notropis atherinoides 6/9/1972fathead minnow Pimephales promelas 7/15/2005Gizzard shad Dorosoma cepedianum 8/23/19948-58
Species NameScientific NameLast RecordGolden shiner Notemigonus crysoleucas 7/15/1998goldfish Carassius auratus 9/27/2000hornyhead chub Nocomis biguttatus 8/5/2005Johnny darter Etheostoma nigrum 7/15/2005lake chub Couesius plumbeus 8/1/1985largemouth bass Micropterus salmoides 8/15/2000logperch Percina caprodes 6/26/2003longnose dace Rhinichthys cataractae 8/15/2005mimic shiner Notropis volucellus 9/5/1995Mottled sculpin Cottus bairdi 11/2/1984pumpkinseed Lepomis gibbosus 8/5/2005rainbow darter Etheostoma caeruleum 8/5/2005rainbow trout Oncorhynchus mykiss 8/15/2005redside dace Clinostomus elongatus 7/15/2005river chub Nocomis micropogon 9/5/1995rock bass Ambloplites rupestris 8/5/2005rosyface shiner Notropis rubellus 10/15/1984s<strong>and</strong> shiner Notropis stramineus 8/1/1985sea lamprey Petromyzon marinus 6/3/1985smallmouth bass Micropterus dolomieu 8/5/2005spotfin shiner Cyprinella spiloptera 9/5/1995spottail shiner Notropis hudsonius 1/1/1998stonecat Noturus flavus 8/5/2005white sucker Catostomus commersoni 8/5/2005yellow perch Perca flavescens 8/5/2005Note: Detailed fish collection records <strong>and</strong> data, in electronic format, are available upon request from TRCA<strong>Aquatic</strong> Group *redside dace only found in Morningside TributaryFMZ 9: Mouth of Rouge River <strong>and</strong> EstuaryFigure 8-19 summarizes the existing conditions in the mouth of the Rouge River <strong>and</strong> estuarinehabitat from south of Hwy 401 to Lake Ontario. Selected target species are quite different inthis zone <strong>and</strong> reflect the open water <strong>and</strong> shoreline habitat (emerald shiner, northern pike,yellow perch, trout-perch <strong>and</strong> white perch). The mouth of the river is a provincially significantcoastal wetl<strong>and</strong> <strong>and</strong> is under Rouge Park management. This habitat feature is unique to thewatershed <strong>and</strong> provides critical habitat to local wildlife, refuge <strong>and</strong> spawning sites for manyaquatic species, shoreline protection <strong>and</strong> is a destination for human recreational use, includingangling.Cumulative effects from the entire watershed are received in this zone, as are influences fromLake Ontario. The main impacts of concern from upstream drainage are stormwater <strong>and</strong> thedeposition of sediment into the marsh both from a physical <strong>and</strong> chemical degradationperspective. In terms of Lake influences, exotic fish species like carp are extremely abundant<strong>and</strong> cause physical disruption to shoreline macrophytes through their benthic feeding <strong>and</strong>spawning behaviour. This exacerbates issues of turbidity <strong>and</strong> possibly release of contaminantsor excess nutrients from the sediment. Additionally, there is some concern that humanrecreational use is not ecologically compatible with protecting the wetl<strong>and</strong> vegetation8-59
community, nesting shore birds <strong>and</strong> other wildlife (e.g. fishing pressure, trampling of plants).Figure8-1919: : Existing Conditions <strong>and</strong> Issues in Mouth of the Rouge River <strong>and</strong> Estuary (FMZ 9Note: The thermal regime represents actual stream temperatures which have been interpreted for development <strong>and</strong>application of Timing Windows as found in the Rouge River FMP.8-60
Stream/Estuary Health: FMZ 9There are no watershed-based monitoring stations in this zone to discuss riverine health. TRCAlakefront monitoring provides fish community data on the marsh <strong>and</strong> nearshore habitat <strong>and</strong>discussed below.Fish Community Structure: FMZ 9Table 8-23 lists all the fish species historically (50) <strong>and</strong> presently (39) found in the mouth of theRouge River <strong>and</strong> coastal wetl<strong>and</strong> in the past 5 years of sampling. The diversity at the mouth<strong>and</strong> coastal wetl<strong>and</strong> has not shifted much from past records with the dominant species beingemerald shiner, spottail shiner, common shiner, bluntnose minnow, white sucker,pumpkinseed, northern pike <strong>and</strong> carp. Species that have not been present in the recentrecords, such as coho salmon <strong>and</strong> brown trout are known to be in the Lake Ontario system butwould likely be sampled only if coincident with spawning season. Other species like mottledscuplin, s<strong>and</strong> shiner, brassy minnow are more riverine species; their presence in past coastalsampling would not have a high expectation of repeatability.Table 8-2323: : Historic <strong>and</strong> Existing Fish Species in FMZ 9Species NameScientific NameLast RecordAlewife Alosa pseudoharengus 6/1/2002black crappie Pomoxis nigromaculatus 6/1/2002blacknose dace Rhinichthys atratulus 5/11/2002bluntnose minnow Pimephales notatus 5/20/2004Bowfin Amia calva 6/7/2000Brassy minnow Hybognathus hankinsoni 6/9/1972brown bullhead Ameiurus nebulosus 5/20/2004brown trout Salmo trutta 10/30/1984chinook salmon Oncorhynchus tshawytscha 12/1/2003coho salmon Oncorhynchus kisutch 10/30/1984common carp Cyprinus carpio 5/20/2004common shiner Luxilus cornutus 5/20/2004creek chub Semotilus atromaculatus 8/16/1994emerald shiner Notropis atherinoides 5/20/2004fantail darter Etheostoma flabellare 6/4/2002fathead minnow Pimephales promelas 5/20/2004freshwater drum Aplodinotus grunniens 5/20/2004Gizzard shad Dorosoma cepedianum 5/20/2004Golden shiner Notemigonus crysoleucas 6/10/1999goldfish Carassius auratus 5/24/2000Johnny darter Etheostoma nigrum 6/4/2002lake chub Couesius plumbeus 7/14/1983largemouth bass Micropterus salmoides 8/17/2001logperch Percina caprodes 5/20/2004longnose dace Rhinichthys cataractae 6/4/2002mimic shiner Notropis volucellus 4/4/2000mooneye Hiodon tergisus 6/2/2000Mottled sculpin Cottus bairdi 6/4/19548-61
Species NameScientific NameLast Recordnorthern pike Esox lucius 5/20/2004northern redbelly dace Phoxinus eos 8/16/1994pumpkinseed Lepomis gibbosus 5/20/2004rainbow darter Etheostoma caeruleum 5/26/1954rainbow trout Oncorhynchus mykiss 5/7/1999Redside dace Clinostomus elongatus 8/16/1994rock bass Ambloplites rupestris 8/8/2002rosyface shiner Notropis rubellus 9/20/1989s<strong>and</strong> shiner Notropis stramineus 7/15/1983sea lamprey Petromyzon marinus 7/14/1983smallmouth bass Micropterus dolomieu 8/8/2002spotfin shiner Cyprinella spiloptera 5/20/2004spottail shiner Notropis hudsonius 5/20/2004threespine stickleback Gasterosteus aculeatus 6/4/2002trout-perch Percopsis omiscomaycus 10/17/1989Walleye Percopsis omiscomaycus 5/20/2004white crappie Pomoxis annularis 8/8/2002white perch Morone americana 7/14/1983white sucker Catostomus commersoni 5/20/2004yellow bullhead Ameiurus natalis 5/7/1999yellow perch Perca flavescens 5/20/2004Note: Detailed fish collection records <strong>and</strong> data, in electronic format, are available upon request from TRCA <strong>Aquatic</strong>Group8.5 Objectives for the <strong>Aquatic</strong> <strong>System</strong>Based on existing conditions, the objective “to protect, restore <strong>and</strong> enhance the health <strong>and</strong>diversity of native aquatic habitat communities, <strong>and</strong> species” was adopted to address theaquatic system in the Rouge River watershed. The method of scoring the “health” of theaquatic system from the site level up to the full watershed scale is presented below. Theprocess of selecting watershed targets for use as a benchmark in rating the existing amount ofavailable habitat <strong>and</strong> presence of barriers <strong>and</strong> exotics species is also presented, along withappropriate indicators <strong>and</strong> measures.Fish CommunityThere are three levels of grading presented for the State of the Watersheds baseline “reportcard” <strong>and</strong> the distinctions are important:1. a grade for biological integrity for each Fish Management Zone (as identified in the FMP);2. an overall grade representing the cumulative condition of the whole watershed asmeasured by the Fish Management Zone in the furthest downstream position within thewatershed;3. Individual grades rating those habitat measures that feedback to fish community integrityAND can be directly affected through well defined implementation activity.8-62
As discussed in Appendix A, Fish IBI’s <strong>and</strong> target species will be the only metrics used toassess the health of the FMZs <strong>and</strong> changes in the watershed. IBI scores calculated from themost recent RWMP data set (2003) were used to scale up the scoring from site to FMZ level.Monitoring data collected beyond the RWMP sites would confound the comparison betweensuccessive report cards, as the data sets would be different <strong>and</strong> biased towards the habitatconditions that received additional monitoring in a given year. Only fish management zonesthat currently have at least one RWMP site can be included in this evaluation. If zones arewithout a RWMP site, it is recommended that the program be exp<strong>and</strong>ed before the next ReportCard update.The four IBI categories have been equated with a raw score from 10-100, with 100 being thebest. As some watercourses did not contain fish in the sampling record, a category of “no fish”was added <strong>and</strong> given a raw score of 0 (Table 8-24). If a fish management zone contained onlyone RWMP site, the assigned raw score would represent that zone’s ultimate score. If morethan one site was present in a management zone, an averageof the raw scores would becalculated. This average score is then equated with a letter grade for that management zonebased only on fish IBI. In the absence of a better scheme, the grading follows the convention ofa school report card <strong>and</strong> is consistent with the framework of this Report.Table 8-2424: Index of Biotic Integrity (IBI(IBI) Scores <strong>and</strong> Grade EquivalentsIBI CategoryRaw RankAverage RankLetter GradeVery Good 100 100 A+91.7 A87.4 A-Good 70 79.1 B+70.8 B62.5 B-Fair 40 54.2 C+45.9 C37.6 C-Poor 10 29.3 D+21.1 D
In terms of determining an overall watershed grade, a hierarchical summary of the FMZ grades,using IBI, appears problematic. Scores that represent good quality habitat are diluted when amedian score is forced across a larger, relatively heterogeneous l<strong>and</strong>scape. Preliminaryresearch has also identified that a bias in the type of sampling done may be skewing the data(Les Stanfield, 2006, pers. comm.). Until such time that an alternate metric or approach isidentified, grading from the site to the FMZ level is appropriate. Beyond that, the ultimatedrainage point, at the bottom of the watershed, is considered the only summary measure of thecumulative condition of the watershed. The grade for the furthest downstream FMZ will be usedto represent a “summary grade” for the whole watershed.Presence of Target Species:One issue with attempting to quantify the presence of target species is that not all habitat typesfor all target species proposed in the FMP are currently being sampled. Also the presence ofmany in-stream barriers confounds the extrapolation of data (i.e fish presence) from onewatercourse to another, even if appropriate habitat conditions exist .Ultimately, the presence of target species must be tied to a formal barrier assessment projectto identify where species can travel within the watershed. This report has been completed forthe Rouge River watershed with recommendations incorporated in the Rouge River FMP (inprogress). It should be noted that the Rouge Fisheries Management Plan may be revisedbefore the next report card, <strong>and</strong> the target species contained within it may change if habitatconditions degrade or improve overtime.Condition of Rouge Fish Management Zones <strong>and</strong> Overall WatershedThe results of evaluating the aquatic health of each FMZ <strong>and</strong> the overall watershed arepresented in the following Table. The method to determine Fish Management Zones grades<strong>and</strong> an overall watershed grade has been explained above <strong>and</strong> the appropriate use <strong>and</strong>interpretation of IBI scores <strong>and</strong> target species discussed in Appendix A. Following thisapproach, FMZ 8 is positioned at the bottom of the watershed <strong>and</strong> reflects the watershed scalecondition. However, rating for this FMZ was slightly modified (“D” was upgraded to “C”) tobetter reflect our scientific underst<strong>and</strong>ing of the ecological integrity present, particularly in theheadwaters <strong>and</strong> Rouge Park. The positive influences these l<strong>and</strong>scapes have through thewatershed were not considered fully captured by the numerical ranking methodology of IBI <strong>and</strong>Target Species alone.8-64
Objective: Protect, restore <strong>and</strong> enhance the health<strong>and</strong> diversity of native aquatic habitats,communities <strong>and</strong> species.Overall RatingFair(“C” – Watershed Grade of Cumulative Impacts)Target: Monitoring stations upstream of urban development should reflect healthy aquatic habitats<strong>and</strong> be reflected in the IBI Score. Stations within the urban boundary should maintain or improveiexisting conditionsIndicatorFish ManagementZoneMeasureAverage RankFish ManagementZone GradeIBI Score 46150% TargetSpeciesNoCPresenceIBI Score 401050% TargetSpeciesNoC-PresenceIBI Score 50250% TargetSpeciesNoC+PresenceFishIBI Score703 50% TargetSpecies“+”PresenceIBI Score 70450% TargetSpeciesnoPresenceIBI Score 1050% Target5Species“+”PresenceIBI Score 2550% Target6SpeciesnoPresenceIBI Score 4050% Target7SpeciesnoPresenceIBI Score 208*50% TargetSpeciesPresencenoB+BDD+CCUpgraded from “D”8* represents the FMZ containing the furthest downstream drainage point for the entire watershed with a RWMPstation.“+” indicates that at least 50% of the monitoring stations sampled 50% or more of the target species (for that FMZ) in2003.8-65
<strong>Aquatic</strong> Habitat FeaturesMeasures <strong>and</strong> TargetsSeveral of the aquatic system target values used in past report cards were reviewed. Theseincluded:• only strategic in-stream barriers remain• wetl<strong>and</strong> cover of 10% of total watershed area• 100% riparian zone with riparian vegetation• 75% of the riparian zone is woodyThe rationale for the above targets was not specifically documented <strong>and</strong> some of the targetswere not considered realistic for all (if any) watersheds to achieve. It was determined by TRCAstaff in consultation with other technical stakeholders (i.e., DFO, MNR, Rouge Park) that moreobtainable targets, by which to measure system improvements, be identified. A literature reviewwas conducted to assist with this knowledge gap. The significant finding being per centimpervious cover (IC) is used extensively to categorize or define watersheds <strong>and</strong> correlate thismetric to environmental degradation (Environment Canada, 2005; Center for WatershedProtection, 2003; Isham, 2005). Beyond 10% impervious cover, watersheds were expected tosustain progressively greater impairment for aquatic habitat (i.e. riparian vegetation), waterquality, IBI scores <strong>and</strong> BI indices scores. For this reason, targets were set along a per cent ICgradient:High > 25% Moderate 10%-2525% Low 25% impervious cover)• Moderate IC: Rouge, Petticoat (10% to 25% impervious cover)• Low IC: Humber , Duffins <strong>and</strong> Carruthers (
Indicators<strong>Aquatic</strong>HabitatFetauresInvasive <strong>and</strong>exotic speciesIC = Impervious CoverMeasuresIn-stream barriersQuantity of wetl<strong>and</strong> coverPortion of riparian zone (RZ)with natural cover (NC)Total length of streamsPresence <strong>and</strong> distribution ofinvasive <strong>and</strong> exotic speciesTargetsOnly strategic barriers remain; barriersremoved/mitigated in priority sequence as identifiedin FMP (OMNR <strong>and</strong> TRCA in progress)Increase wetl<strong>and</strong> cover to 10% of total watershedarea (all watersheds)High IC = 30% of RZ treed; 70% of RZ other NCMod IC = 50% of RZ treed; 50% of RZ other NCLow IC = 80% of RZ treed; 20% of RZ other NCNo additional loss of stream lengthPrevent the introduction of any invasive or exoticspecies as identified in the FMP (OMNR <strong>and</strong> TRCAin progress)<strong>Aquatic</strong> Habitat Features: Scoring <strong>and</strong> Grading MethodologyEach indicator (<strong>and</strong> measure) receives equal weighting. Relative achievement of the target wasmatched with corresponding scores as follows (TRCA developed):ScoreExcellent (A) Better than 80Good (B) Between 70 <strong>and</strong> 79Fair (C) Between 60 <strong>and</strong> 69Poor (D) Between 50 <strong>and</strong> 59Per Cent of Target AchievedFail (F) Below 50TBD Further study requiredObjective: Protect, restore <strong>and</strong> enhance the health<strong>and</strong> diversity of native aquatic habitats,communities <strong>and</strong> species.Overall Rating“Fair”Watershed Grade of Cumulative ConditionCTarget: Monitoring stations upstream of urban development should reflect ect healthy aquatic habitats<strong>and</strong> be reflected in the IBI Score. Stations within the urban boundary should maintain or improveexisting conditionsIndicators Measure Amount in2002(2006*)Target forWatershed with Moderate ImperviousCoverGradeHabitatFeatureArea ofriparianwetl<strong>and</strong>sPotion ofriparian zonewith naturalcover (NC)Length ofstreams3.6% Increase wetl<strong>and</strong> cover to 10% of totalwatershed riparian area38% (treed)65% (NC) 50% of Riparian Zone treed50% of Riparian Zone other natural cover427 km No additional loss of stream lengthFBATBD8-67
FishPassageIn-streamBarriers253* Only strategic barriers remain; barriersremoved/mitigated in priority sequenceas identified in FMP (OMNR <strong>and</strong> TRCA inprogress)TBDInvasive <strong>and</strong>exoticspeciesPresence <strong>and</strong>distribution ofinvasive <strong>and</strong>exotic speciesRoundGobysampled atHighway 2*;RustyCrayfish upto StouffvilleRd in LittleRouge;unknowndistributionin the MainRougePrevent the introduction of any invasive orexotic species as identified in theWBFiMPDArea of Riparian Wetl<strong>and</strong>s:The “F” grade reflects the fact that the 3.6% existing riparian wetl<strong>and</strong> area (excluding RougeRiver Marsh) is below 50% of the target of 10% of the watershed. However, small wetl<strong>and</strong>ecosystems are still being lost <strong>and</strong> degraded <strong>and</strong> at the same time, wetl<strong>and</strong> restoration effortsare not being closely tracked, compiled <strong>and</strong> evaluated. Therefore, this percentage may shift ineither direction with more detailed reporting of changes in the watershed.Portion of Riparian Zone with Natural Cover:The assigning of grades “B” for treed cover <strong>and</strong> “A” for natural cover reflects the fact that theRouge River watershed, despite being moderately urbanized (estimated 23% impervious coverfor entire watershed), has maintained a better than average amount of riparian cover ascompared to similarly urbanized watersheds. However, this indicator does not report on thequality of the habitat.Length of streams:A method of tracking <strong>and</strong> managing this information of stream length must be in place beforethis target achievement can be assessed.Instream Barriers:Currently the total number of barriers to fish passage in the Rouge River watershed has beendetermined as 253. This number includes man-made structures that can be passed only byjumping salmonids <strong>and</strong> those structures that are impassable by all species. Therecommended priority management efforts for barriers, based on ecological benefits (i.e.passing target species, mitigating thermal impacts, opening up large relatively large amountsof habitat) identified 29 priority barriers (see Table 8-3 <strong>and</strong> Figure 8-9). Through implementationof the updated Rouge River FMP, this indicator can start to be tracked based on mitigation (ormaintenance) of prioritized structures.8-68
Presence <strong>and</strong> distribution of invasive <strong>and</strong> exotic species:The “D” rating stems from the fact that there is no plan in place to control invasive <strong>and</strong> exoticspecies despite the Little Rouge subwatershed being “open” to the headwaters <strong>and</strong> the MainRouge River accessible into the upper headwaters in FMZ1. The active aquatic invasive speciesmanagement in the watershed (i.e., reliance of lampricide applications in the lower reaches <strong>and</strong>the only seasonally operated fishway at Milne Pond) are not considered either appropriate orsufficient protection for the aquatic system.Human UseThe objective “to provide for sustainable fishing opportunities <strong>and</strong> the safe consumption offish” was adopted to address human use of the aquatic system in the Rouge River watershed.This is presented below, along with indicators, measures, targets <strong>and</strong> a grade for existingconditions in the watershed.Objective: Provide for sustainable fishing opportunities <strong>and</strong> the safe consumption of fishOverallRatingGood (B)IndicatorConsumptionadvisoriesMeasureNumber of consumptionadvisoriesTargetNo consumption advisoriesbeyond the monthly maximum ofno more than 8 meals per monthGradeAAnglingopportunitiesNumber of angling opportunitiesIncreased angling opportunities ata limited number of selectedlocations, specific target to urbananglingBaitfish harvest Amount of baitfish harvested TBD but would need to considersustainable use <strong>and</strong> no harvestingof redside dace.BTBDFish consumption within the Rouge meets the target for all fish species measured by MOE.Recreational angling is generally known to occur in many locations along the main Rouge <strong>and</strong>Little Rouge. However, formal surveys of recreational use <strong>and</strong> more complete data aroundbaitfish harvest are required to build a better underst<strong>and</strong>ing of the balance between the healthof the fishery in the watershed <strong>and</strong> social benefits. To this end, the updated Rouge FMPprovides recommendations towards increasing recreational angling opportunities within aframework of being compatible with ecologically sensitive areas (i.e. Rouge Marsh) <strong>and</strong>increasing the awareness of overfishing pressure, sustainable <strong>and</strong> species appropriate baitfishharvest <strong>and</strong> preventing release of live bait that may contain exotic species.8-69
8.6 Summary <strong>and</strong> Management ConsiderationsSummaryFrom the indicators of aquatic ecosystem health, fish communities within Bruce Creek (FMZ 3)<strong>and</strong> the Upper Little Rouge (FMZ 4) are maintaining good quality habitat, althoughfragmentation due to instream barriers is a significant issue for both zones. The upper mainRouge (FMZ 2), the middle reaches (FMZ 10), Berczy Creek (FMZ 2) <strong>and</strong> the Lower LittleRouge are all maintaining fair conditions, while the reaches that flow across the middle of thewatershed (FMZ 5 <strong>and</strong> 6) <strong>and</strong> down the main branch of the Rouge to the mouth of the river(FMZ 8) are in relatively poor habitat condition.The amount of riparian wetl<strong>and</strong>s needs to be increased, but an assessment to best determinewhere within the watersheds is required. The Rouge watershed contains more than the targetamount of riparian cover (treed <strong>and</strong> other natural cover). Efforts to further increase this habitatfeature across all FMZs is recommended. Although the total length of streams (km) is knownfrom a point in time, any changes to this quantity are not currently being tracked. Amethodology for updating this metric should be developed to address the ‘when <strong>and</strong> where’ ofstream loss or creation to better evaluate this indicator in the future. Instream barrier mitigationhas provided passage for migratory fish from Lake Ontario to the headwaters. From a fishpassage perspective <strong>and</strong> mitigation of thermal impacts from ponds, the Rouge system cancontinue to improve as the 29 priority barriers are addressed over time. The development of aninvasive species response program is of high priority to address the growing concerns of roundgoby <strong>and</strong> rusty crayfish presence <strong>and</strong> distribution.Human use within the Rouge, as it pertains to angling opportunities <strong>and</strong> fish consumption,meets or exceeds target expectations. Guidance towards greater angling opportunity in-linewith ecological balance is provided in the updated Rouge FMP <strong>and</strong> may result in this metricreceiving an even higher rating in the future. As the required data for baitfish harvest evaluationbecomes available from the Ministry of Natural Resources, a rating for this metric can beapplied.Management ConsiderationsIntegral to achieving our overall aquatic system goal is the management of the rivers <strong>and</strong>l<strong>and</strong>scape of the Rouge River watershed to support the target species of brook trout, redsidedace <strong>and</strong> rainbow darter. With the management of these three species, other sensitive targetspecies are compatibly supported within stable thermal habitat regimes.Of highest priority management are actions that address increasing flow velocities,groundwater discharge/recharge, stream turbidity <strong>and</strong> the warming of streams. There appearsto be both localized <strong>and</strong> more regional areas of groundwater discharge/recharge through thewatershed that warrant management focus (i.e. FMZs 1A, 2, 3, 4, 6, 8). The preservation ofimportant cold <strong>and</strong> cool water habitat, as well as beneficial water quality effects on warmwatersystems depend on the protection of both these groundwater sources. Maintaining <strong>and</strong>enhancing high quality warmwater habitat in the Little Rouge River is also of high managementpriority.8-70
The integrity of the headwaters is considered critical to achieving management goals ofmaintained <strong>and</strong> enhanced good quality aquatic habitat. In some zones within the Rouge Riversystem, upstream management is critical to directly maintaining the productivity <strong>and</strong> diversityof healthy <strong>and</strong> sensitive middle reaches (i.e. FMZ 2 <strong>and</strong> FMZ 4/7). Prioritizing the protection orrehabilitation of upstream habitat also addresses problems of cumulative impacts through theentire watershed.8-71
8.7 ReferencesBarbour, M., T. Gerristen, B. D. Synder, <strong>and</strong> J. Stribling. 1999. Rapid Bioassessment protocolsfor use in streams <strong>and</strong> wadeable rivers: periphyton, benthic macroinvertebrates <strong>and</strong>fish. 2 nd Edition EPA 841-B-99-002.Barton, D. 1996. The use of Percent Model Affinity to assess the effects of agriculture onbenthic invertebrate communities in headwater streams of southern Ontario, Canada.Freshwater Biology. Vol. 36, pp. 397-410.Borisko, J., 2006 Personal Communication.Bills, T. D. <strong>and</strong> D. Johnson. 1992. Effect of pH on the toxicity of TFM to Sea Lamprey larvae<strong>and</strong> nontarget species during a stream treatment. Prepared for Great Lakes FisheryCommission, Technical Report 57.Boogard, M., T. Bills, <strong>and</strong> D. Johnson. 2003. Acute toxicity of TFM <strong>and</strong> a TFM/Nicolsamidemixture to selected species of fish including Lake Sturgeon (Acipenser fulvescens) <strong>and</strong>Mudpuppies (Necturus maculosus) in laboratory <strong>and</strong> field experimentation. Journal ofGreat Lakes Res. 29 (Supplement 1): pp. 529-541 International Assoc. Great Lakes Res.Center for Watershed Protection. 2003. Impacts of Impervious Cover on <strong>Aquatic</strong> <strong>System</strong>s inWatershed Protection Research Monograph No. 1 Ellicott City MD 21043.City of <strong>Toronto</strong>. 2000. Sustaining Biodiversity - A Strategic Plan for Managing Invasive Plantsin Southern Ontario.Environment Canada. 2004. Addressing the Threat of Invasive Alien Species - A Strategy forCanada. Draft.Environment Canada. 2004. How Much Habitat is Enough? 2 nd Edition.Goodchild G. A. 1986. Manual of Instructions: Electrofishing Guidelines <strong>and</strong> Procedures.Fisheries Section. Official Procedure Manual. Policy FI.3.01.01. March 1986. OntarioMinistry of Natural Resources.Hewitt, L.M., K. R. Munkittrick, G. L. Van Der Kraak, I. M. Scott, L. P. Schleen <strong>and</strong> M.R. Servos.1998. Hepatic mixed function oxygenase activity <strong>and</strong> vitellogenenium induction in fishfollowing a treatment of the lampricide 3-trifluprpmethyl-4-nitrophenol (TFM).Can<strong>and</strong>ian Journal of Fisheries <strong>Aquatic</strong> Science. Vol. 55: pp. 2078-2086.Jacques Whitford Environment Limited. 2001. Recommended Inidices of Benthic InvertebrateCommunity Composition to be Applied to Results from the Rapid BioassessmentSurveys. Prepared for <strong>Toronto</strong> <strong>Region</strong> <strong>Conservation</strong> <strong>Authority</strong>.Karr, 1981. Assessment of biotic integrity using fish communities in Fisheries 6(6): pp. 21-27.8-72
Maude, S. <strong>and</strong> J. Di Maio. 1999. Benthic Macroinvertebrate Communities <strong>and</strong> Water Quality ofHeadwater Streams of the Oak Ridges Moraine Southern Ontario. Canadian FieldNaturalist 113(4) pp. 585-597.Murphy, B. 2006. Personal Communication.Novak M. <strong>and</strong> R. Bode. 1992. Percent Model Affinity: a new measure of macroinvertebratecommunity composition. North American Benthological Society. 11(1) pp. 80-85.Ontario Ministry of the Environment. 2007. Guide to Eating Ontario Sport Fish, 2007-2008Edition.Ontario Ministry of Natural Resources. 1994. Ontario Wetl<strong>and</strong> Evaluation <strong>System</strong> - SouthernManual, 3 rd Edition.Ontario Ministry of Natural Resources. 2000. Ontario stream assessment protocol (OSAP),version 2.1.Ontario Ministry of Natural Resources. 2003. Ontario stream assessment protocol, version 5.1.Ontario Ministry of Natural Resources <strong>and</strong> <strong>Toronto</strong> <strong>Region</strong> <strong>Conservation</strong> <strong>Authority</strong> (inprogress). Rouge River Watershed Based Fisheries Management Plan.Pickett, S. <strong>and</strong> M. Cadenasso. 2006. Advancing urban ecological studies: Framework,concepts <strong>and</strong> results from the Balitomre Ecosystem Study. Australian Ecology Vol. 31pp. 114-115.Rouge Park <strong>and</strong> <strong>Toronto</strong> <strong>Region</strong> <strong>Conservation</strong> <strong>Authority</strong>. 2006 Draft. Little Rouge CorridorManagement Master Plan.Scott, W.B. <strong>and</strong> E.J. Crossman. 1973. Freshwater Fishes of Canada. Fisheries ResearchBoard of Canada Bulletin 184. Ottawa, Ontario. 966 pages.Sedell, J.R. <strong>and</strong> K.J. Luchessa. 1981. Using the Historical Record as an Aid to SalmonidHabitat Enhancement. pp 210-222. In Symposium on Acquisition <strong>and</strong> Utilization of<strong>Aquatic</strong> Habitat Inventory Information. October 23-28. Portl<strong>and</strong>, Oregon.Stanfield, L. 2006 Personal Communication.Stanfield, L.W. (Editor). 2005. Ontario Stream Assessment Protocol, Version 7.Stanfield, L. <strong>and</strong> S. Gibson (in review). Using Network Collected Fisheries Data to Evaluate theEcological Condition of Streams. An Example using Information from the Lake OntarioBasin. Prepared for the Ontario Ministry of Natural Resources.Stanfield, L. W., <strong>and</strong> B. W. Kilgour. 2006. Effects of percent impervious cover on fish <strong>and</strong>benthos assemblages <strong>and</strong> in-stream habitats in Lake Ontario Tributaries. Special8-73
Publication of the American Fisheries Society. Proceedings of Special Symposium:Influences of l<strong>and</strong>scape on stream habitat <strong>and</strong> biological communities, MadisonWisconsin.Steedman, R. J. 1987. Comparative Analysis of Stream Degradation <strong>and</strong> Rehabilitation in the<strong>Toronto</strong> Area. Ph.D. Thesis. University of <strong>Toronto</strong>.<strong>Toronto</strong> <strong>Region</strong> <strong>Conservation</strong> <strong>Authority</strong>. 2006 DRAFT. Bruce’s Mill <strong>Conservation</strong> Area MasterPlan Background Report.<strong>Toronto</strong> <strong>Region</strong> <strong>Conservation</strong> <strong>Authority</strong>. 2007 DRAFT. Baseflow <strong>and</strong> Water Use Assessment –Report in Current Conditions in Don River Watershed Plan (Draft).<strong>Toronto</strong> <strong>Region</strong> <strong>Conservation</strong> <strong>Authority</strong>. 2007. Rouge River Watershed Scenarios Modelling<strong>and</strong> Analysis ReportVannote, R., G. W. Minshall, K.W. Cummins, J. Sedell <strong>and</strong> C. Cushing. 1980. The rivercontinuum concept. Canadian Journal Fisheries <strong>Aquatic</strong> Science Vol. 37: pp. 130-137.Wehrly, K., Wiley M. <strong>and</strong> P. Seelback. 1999. A Thermal Classification for Lower MichiganRivers from State of Michigan. Department of Natural Resources, Fisheries DivisionResearch Report No. 2038.Yoder, C., Miltner, R. <strong>and</strong> D. White. Unpublished Manuscript. Using Biological Criteria toAssess <strong>and</strong> Classify Urban Streams <strong>and</strong> Develop Improved L<strong>and</strong>scape Indicators fromOhio Environmental Protection Agency, Division of Surface Water EcologicalAssessment Unit <strong>and</strong> Information Resources Management Section.8-74
Appendix AAppropriate <strong>Aquatic</strong> Indicators of Watershed or Fish Management Zone (FMZ(FMZ) ConditionsAs the science behind underst<strong>and</strong>ing aquatic ecosystems exp<strong>and</strong>s <strong>and</strong>, in some cases,improves, past paradigms should be challenged to maximize our confidence around datainterpretation <strong>and</strong> management recommendations. To this end, TRCA staff re-evaluated theaquatic indicators used for past reporting of watershed health. The results of this evaluationprocess speak to limitations of certain metrics for extrapolating to large spatial scales (i.e.watershed wide) from only site or reach measurements. For example, benthic invertebrates<strong>and</strong> stream temperature are now recognized as valuable pieces of information to bestunderst<strong>and</strong> conditions at a site or reach level. Newer concepts of impervious cover <strong>and</strong>l<strong>and</strong>scape disturbance are introduced as considerations for underst<strong>and</strong>ing shifts in fishcommunity.Fish Community MetricsFish are a convenient measure of the health of the aquatic system as they are relatively easy tosample <strong>and</strong> identify, are relatively well understood in terms of ecological requirements <strong>and</strong> arerecognizable by the public. Situated near the top of the aquatic food chain, they are aninteresting indicator, because they are affected by all other trophic levels <strong>and</strong> occupypotentially large geographic areas where similar (<strong>and</strong> appropriate) hydrologic <strong>and</strong> habitatconditions persist. The presence of species over time, or changes in the numbers <strong>and</strong>locations of sensitive species, also provide a measure of aquatic ecosystem health <strong>and</strong> can beused as an indicator of environmental change.Community StructureVannote et al. (1980) details the concept of a “river continuum” where by the physicalconditions from headwaters to mouth of a system form a gradient that is occupied bypredicable fish assemblages. The natural structure of these riverine fish communities ischaracterized by the lowest biodiversity in small headwater tributaries, the highest biodiversitythrough the middle reaches, <strong>and</strong> relatively lower biodiversity in large, main branches at thebottom of the system (excluding influences of lake-based migratory species). Urbanizedsystems often present an altered community structure through the watershed as stressorsassociated with l<strong>and</strong>scape change can result in a variety of impacts, including, but not limitedto, habitat degradation/loss, water quality decline, hydrological changes (surface <strong>and</strong>groundwater), stream warming <strong>and</strong> fish passage. In general, biodiversity (or species richness)can stabilize a community in the face of disruptive events <strong>and</strong> system pressures (as describedabove) over an extended period of time (Vannote et al. 1980). The theory holds that“something” will survive <strong>and</strong> populate impoverished habitats that have been altered orstressed.In a natural system, as opposed to an urbanized system, fish community structure gain <strong>and</strong>lose “species in response to low probability, cataclysmic events <strong>and</strong> in response to slowprocesses of channel development” (Vannote et al. 1980). Although improvements tostormwater management are taking place, highly urbanized l<strong>and</strong>scapes have producedstormwater dynamics that alter a stream’s natural flow regime, exacerbate the issues oftemperature fluctuation, <strong>and</strong> in some cases result in accelerating the process of channeldevelopment. The naturally occurring relationships of species loss <strong>and</strong> gain do not likely hold8-75
in the Rouge River watershed, as we are possibly experiencing a uni-directional “loss” of nativespecies (extirpation in some cases) <strong>and</strong> gain of exotics. Within this context, it is tempting tosupport a conclusion that lower numbers of reported species presence, per sampling effort, beaccounted for by urban impacts. This view needs to be tempered by acknowledging that theobjectives of the RWMP are not to determine cause <strong>and</strong> effect relationships, but more toidentify trends over time.Fish Index of Biotic Integrity (IBI) ScoresOnce collected, identified <strong>and</strong> enumerated, the health of a fish community can be assessed bycalculating the Index of Biotic Integrity (IBI). The IBI is a measure of fish communityassociations that is used to identify the general health of the broader stream ecosystem (Karr,1981 ). TRCA employs a modified version of the IBI index developed by Steedman (1987)Fish Canonical Correlation Analysis (CCA) Scores (based on L<strong>and</strong> Disturbance Index)Relationships between the amount of impervious cover (IC) <strong>and</strong> negative impacts to streamhealth are widely documented in the literature (Maude <strong>and</strong> Di Maio, 1999; Center for WatershedProtection, 2003; Environment Canada, 2005). More recently, the development of a L<strong>and</strong>scapeDisturbance Index (LDI) that estimates how much a given type of l<strong>and</strong>cover has disturbed thenatural l<strong>and</strong>-stream processes from an original forested l<strong>and</strong>scape has also gained interest asan alternate metric for predicting shifts in fish communities. This index is quantified bycalculating a Fish Canonical Correlation Analysis (CCA) Score at the FMZ scale <strong>and</strong> to a lesserextent, watershed scale (Stanfield <strong>and</strong> Kilgour, 2006; Stanfield <strong>and</strong> Gibson, in review). UnlikeFish IBI, that only considers in-stream habitat conditions, Fish CCA scores incorporate theinfluences of l<strong>and</strong>scape on stream health. This metric is particularly relevant in the Rouge Riveras expansive <strong>and</strong> rapid shifts from natural <strong>and</strong> agricultural l<strong>and</strong>s become urbanized.Target SpeciesIndicator or target fish species have particular relevance to our underst<strong>and</strong>ing of the ecologicalintegrity of the watershed. Target species in the watershed are selected based on ecologicalsensitivities <strong>and</strong> top trophic status in the food chain (see Rouge River Watershed ScenarioModelling <strong>and</strong> Analysis Report for selection criteria (TRCA, 2007)). The absence of thesespecies is an indication that there may be ecological impairment in the aquatic ecosystem.Within a group of selected target species, there is a more refined hierarchy of sensitivity. Thishierarchy can produce key target species that by managing for habitat conditions that supportthese key species, the other target species are also being “cared for”. The reason for inclusionof the other target species is a function of:1. wanting to promote biodiversity; <strong>and</strong>2. wanting to protect species that have specific sensitivities to changes in the aquaticecosystem.There was a comprehensive potential target species list derived from historical samplingrecords from the watershed. The species’ individual ecological sensitivities were examined inrelation to l<strong>and</strong>scape alteration <strong>and</strong> its related impacts to the aquatic ecosystem. The targetspecies were those deemed most sensitive to aquatic ecosystem change <strong>and</strong> therefore haverelevance to fisheries management decisions. Target species for the Rouge River system arelisted in Table A:1. These species are being proposed in the Rouge River FMP that is currently8-76
eing developed, however, the target species will not be considered final until the FMP isformally adopted by OMNR.Table A:1 Target Species Selected for the Rouge River <strong>System</strong>Common NameScientific NameDescriptorbrook trout (BKT) Salvelinus fontinalis Key Target speciesredside dace (RSD) Clinostomus elongates Key Target speciesAmerican brook lamprey (ABL) Lampetra appendix Target speciesmottled sculpin (MS) Cottus bairdi Target speciesbrassy minnow (BM) Hybognathus hankinsoni Target specieshornyhead chub (HHC) Nocomis biguttatus Target speciesPearl dace (PD) Margariscus margarita Target speciesrainbow darter (RD) Etheostoma caeruleum Key Target speciescentral mudminnow (CM) Umbra limi Target speciesrosyface shiner (RFS) Notropis rubellus Target speciesTrout perch (TP) Percopsis omiscomaycus Target speciesyellow perch (YP) Perca flavescens Recreational fishing opportunitylargemouth bass (LMB) Micropterus salmoides Recreational fishing opportunity<strong>Aquatic</strong> Invasive Species (AIS)AIS are introduced species that are able to out-compete indigenous species for food or refugeresources <strong>and</strong> unbalance the native ecosystem. The spread of such species is considered oneof the most serious threats to biodiversity (City of <strong>Toronto</strong>, 2000; Environment Canada, 2004).Native species that are not immediately eliminated are gradually weakened through isolation orinsufficient number. Rendered more vulnerable to other changes in environmental conditions,or to point-in-time events (i.e., chemical spills) native species may eventually disappear,particularly if they are sensitive or rare in the community.Riparian Vegetation <strong>and</strong> Wetl<strong>and</strong>sWetl<strong>and</strong> habitat forms a major component of the habitat requirements for many aquatic speciesduring different life stages. As there has been a significant loss of wetl<strong>and</strong> habitat in thewatershed, <strong>and</strong> aquatic wetl<strong>and</strong> species appear to be in decline, the area of wetl<strong>and</strong> habitat isimportant to focus on in order to maintain the ecological integrity of the aquatic system.However, as a very important caveat, this level of interpretation can only be acquired if wetl<strong>and</strong>function is measured. Strict quantification of available habitat provides only a sense of potentialhabitat as usage <strong>and</strong> possible impairment can not be assumed.Similar to riparian wetl<strong>and</strong>s, riparian vegetation in its various forms: woody tree cover, shrubs,meadow, etc. provide specific habitat for <strong>and</strong> array of fish <strong>and</strong> benthic species, e.g. redsidedace habitat includes overhanging grasses. Sufficient vegetative cover also plays an ecologicalrole in water temperature regulation through shading <strong>and</strong> stream bank stability. Again, thesame caution to interpretation used for wetl<strong>and</strong> quantification applies to riparian habitatmeasurements as well.8-77
Total Stream LengthStream length is a vital component when assessing the aquatic ecosystem because thismeasurement is effectively the amount of habitat within the watershed. For the most part, TRCAmeasures stream length as a GIS exercise <strong>and</strong> therefore has limited information around streamfunction. Unless a functional ecological assessment is done consistently for all stream reaches,this numeric should be considered “potentially available habitat”.Instream BarriersHabitat fragmentation caused by instream barriers result in significant impairment to an aquaticsystem. As the riverine system is linear, dams <strong>and</strong> weirs prevent the passage of aquaticspecies upstream <strong>and</strong> in some cases downstream. This in turn impacts the exchange of genesbetween isolated fish population <strong>and</strong> prevents the recolonization of habitats. Fish can beprevented from accessing different habitats which may be necessary for the completion of anentire life cycle, such as reproduction, growth, shelter or refugia. Many of these barriers havecreated on-line ponds, which can adversely affect water temperature <strong>and</strong> sediment transport.Culverts that have a vertical drop at the downstream end, referred to as “perched” culverts, canalso prevent or limit fish passage.Natural obstacles to the movement of humans <strong>and</strong> aquatic organisms, such as beaver dams<strong>and</strong> log jams, have always been found in the Rouge River watershed. Log jams are often onlylocated on the water surface <strong>and</strong> usually allow fish passage underneath. Beaver dams causeflooding <strong>and</strong> hydrologic alterations but since they are not as permanent as human-builtstructures, their effects are not as severe. Beaver dams <strong>and</strong> their associated ponds have alsobeen a natural part of the Rouge River's ecology for thous<strong>and</strong>s of years. In fact, the presence ofwoody material was found to be an important habitat component in streams with anadromousfish runs (Sedell <strong>and</strong> Luchessa, 1981), <strong>and</strong> beaver activity can be a major source of woodymaterial. Furthermore, rainbow trout are often able to pass by beaver dams <strong>and</strong> continueupstream.In most cases, barriers create a negative impact on the aquatic ecosystem by restricting thepassage of desirable species that are unable to jump over the barrier, creating isolatedpopulations of aquatic organisms. However, barriers can be useful in restricting entry of exoticfish species such as gobies, <strong>and</strong> invertebrate species such as the rusty crayfish to thewatershed, subwatershed or to various sections of stream. They can also be used to separatemigratory <strong>and</strong> resident trout <strong>and</strong> salmon communities should issues of resource competitionbe identified.Fish ConsumptionThe concentration or loading of heavy metals, organics, nutrients or sediment can all impactaquatic communities. Instream measurements of water chemistry can be augmented by fishtissue analysis to determine the availability of contaminants to aquatic species. The Ministry ofthe Environment samples levels of contaminants in sportfish at numerous locations across theprovince <strong>and</strong> lists consumption advisories based on Health Canada guidelines in the “Guide toEating Ontario Sport Fish” (OMOE, 2007).8-78
Recreational Angling OpportunitiesFrom a human st<strong>and</strong>point, the aquatic system is a recreational <strong>and</strong> food resource for manyanglers, as well as licensed baitfish harvesters. Stocking of non-native trout <strong>and</strong> salmon isdone to provide recreational angling opportunities <strong>and</strong> to control the numbers of non-nativebaitfish (alewife <strong>and</strong> rainbow smelt) in the Lake Ontario ecosystem. Non-native speciescompete with themselves <strong>and</strong> with native species for resources in both the watershed <strong>and</strong> inthe lake. Even when stocking native species as a management tool, care must be taken toprotect wild stocks by ensuring that sources are local <strong>and</strong> disease-free. Stocking can alsoreduce the genetic diversity of wild populations, mask ecosystem impacts <strong>and</strong> establish falseexpectations about the fish community.Baitfish HarvestAngling <strong>and</strong> baitfish harvest are other pressures on the aquatic community. Overharvest,poaching, removal of female trout <strong>and</strong> salmon for eggs, or the intentional or accidental transferof species between or within systems, are a few examples of the issues associated withrecreational angling. Licensed anglers are also permitted to harvest leeches, frogs, snappingturtles <strong>and</strong> crayfish. Baitfish harvest by licensed anglers creates additional pressure on theresource. Like angling, this activity is enforced <strong>and</strong> licensed by OMNR.Cumulative ImpactsAs defined in the beginning section of this report, cumulative impacts are the end results ofincremental increases in the number of local influences that alter a system from headwaters tothe mouth. The most representative measure of cumulative impacts are stream conditions ofthe furthest downstream site in the watershed.Appropriate <strong>Aquatic</strong> Indicators of Site ConditionsIn previous current condition reports, TRCA has employed the following three metrics to helpinterpret the overall health of the watershed: benthic invertebrates, stream temperature <strong>and</strong>baseflow. It is now suggested that these metrics are most suitable for underst<strong>and</strong>ing streamconditions at the site <strong>and</strong> reach level <strong>and</strong> that interpretation becomes problematic as the dataare extrapolated up to the watershed scale for the purpose of evaluating the effects of l<strong>and</strong>usechange (i.e. urbanization). Each parameter is discussed below with the recommendation thatthese metrics, in association with others, be used in the development of management actionsidentified for specific, priority sites in the Watershed Management Plan <strong>and</strong> FisheriesManagement Plan.Benthic InvertebratesBenthic invertebrates are any organism lacking a backbone <strong>and</strong> found at the bottom of astream or lake. Examples include: worms, leeches, snails, crayfish <strong>and</strong> the larvae of manyflying insects such as mayflies <strong>and</strong> dragonflies. Benthic invertebrates are widely used todetermine site conditions within a defined stream reach using defined indices (e.g. HilsenhoffIndex of Biotic Integrity, EPT, % diperans, % oligochates (Barton, 1996; Maude <strong>and</strong> Di Maio,1999; Novak <strong>and</strong> Bode, 1992). Many of these indices were originally developed to measurewater quality impacts from point source discharges (i.e. downstream of pulp <strong>and</strong> paper8-79
discharge, sewage effluent, etc.). Changes in community structure or loss of sensitive specieswere correlated to chemical (low oxygen) <strong>and</strong> physical (e.g. increased sedimentation) changeswithin the local stream reach.Current analysis suggests that benthic community structure is not a sensitive metric tourbanization, that is, differences between communities are significant only at the extremes ofdevelopment (Borisko, per.comm.). Community response to change is frequently slow, therebyhaving a slight disadvantage in providing early warnings.Further, the existence of st<strong>and</strong>ards or “biocriteria” is not fully realized. A benthic communitymay be characterized at a given site but it is difficult to know if this community indicates ahealthy condition without a reference condition (or the existence <strong>and</strong> knowledge of very robustindicator species). This is particularly true in more developed regions such as the GTA wherereference conditions presumably are rare.Alternate methods of analysis are being evaluated by the TRCA to address this limitation in thedata. Preliminary findings suggest that taking the identification of invertebrates down to thegenus/species level will produce finer results as there is often great variability in speciessensitivities to impacts that are not detected or misdiagnosed at higher taxonomic levels.Stream TemperatureStream temperature plays an important role in the location of aquatic communities. Byunderst<strong>and</strong>ing the variations in stream temperature, an assessment of the suitability of astream to support a cold, cool or warm water aquatic community can be developed.Furthermore, the comparison to an expected historic condition can be made to gauge currentstream temperature stability. Typically, the more thermally stable <strong>and</strong> the colder the stream is,the more likely it will support coldwater species due to high groundwater discharge related tototal flow.The OSAP protocol that TRCA employs to determine thermal stability involves directmeasurement of in-stream temperatures between the hours of 3:00 pm-4:00 pm over the hotsummer months. Given the number <strong>and</strong> nature of the possible factors that can affect watertemperature within a given season, at a given location <strong>and</strong> even time of day, it can be wellargued that extrapolating a temperature from one site to another, even on the samewatercourse can be problematic without careful interpretation. Stretching that data to an evenbroader spatial scale (e.g. subcatchment or whole watershed) would require a level of detail<strong>and</strong> knowledge in all the factors that can affect stream temperature that the current datacollection does not provide. Interpretation at the site level is appropriate <strong>and</strong>, if sufficientunderst<strong>and</strong>ing of factors influencing the local area are known (e.g. are on-line ponds present,is there water taking, what is the percent impervious cover etc), then extrapolation to thestream reach level is also appropriate.Base Flow Index (<strong>and</strong> Groundwater Regime)The baseflow of a stream refers to the quantity of water that is permanently present under lowflow conditions. The assumption is that baseflow, particularly in small, low order streams, is ameasure of the groundwater contribution to the stream which, therefore, has significantimplications to the habitat that watercourse might be able to sustain. The underlying ecological8-80
assumption is that high baseflow reflects a good quality, coldwater stream environment. Theindex TRCA uses to estimate how much groundwater is contributing to stream flow is the ratioof mean annual baseflow to mean annual total flow <strong>and</strong> is referred to the baseflow index (BFI).Generally speaking, the calculation of this index can be quite straight forward, especially ifempirical measurements are available from in-stream flow gauges. Unfortunately, wide spatialdistribution is not practical for the size of watersheds that TRCA must monitor <strong>and</strong> thus, BFIdoes become more of an estimate of baseflow the further away from a gauge location. This stillmay not be a problem if the groundwater regime for a given area is reasonably understood <strong>and</strong>if the assumption that baseflow is a true measure of just groundwater can be verified.Having said that, there is much recent discussion in the literature <strong>and</strong> within environmentalagencies that, in an urban system, baseflow contributions have several sources in addition tonaturally available groundwater e.g. leaky water mains, imported irrigation water (Pickett <strong>and</strong>Cadenasso, 2006; Yoder et al Unpublished Manuscript). This has tremendous implications towater quality, water balance <strong>and</strong> aquatic habitat. In terms of habitat, no longer can the premiseof “good baseflow” equals “good quality habitat” be confidently applied, as many highly urbanimpacted streams are permanently flowing, have a high BFI, but due to water quality or flowissues, the fish community, if even present, reflects a degraded system. It is largely due to thiscomplication within an urban watershed that BFI values are not used to widely characterize thewatershed conditions, but limit interpretation to areas where stream gauges are present <strong>and</strong>/orthe underlying geology <strong>and</strong> fish community data can help defend a BFI estimate.8-81