Discussion of WECC Paths TOT 1A Path 30
Discussion of WECC Paths TOT 1A Path 30
Discussion of WECC Paths TOT 1A Path 30

Create successful ePaper yourself
Turn your PDF publications into a flip-book with our unique Google optimized e-Paper software.
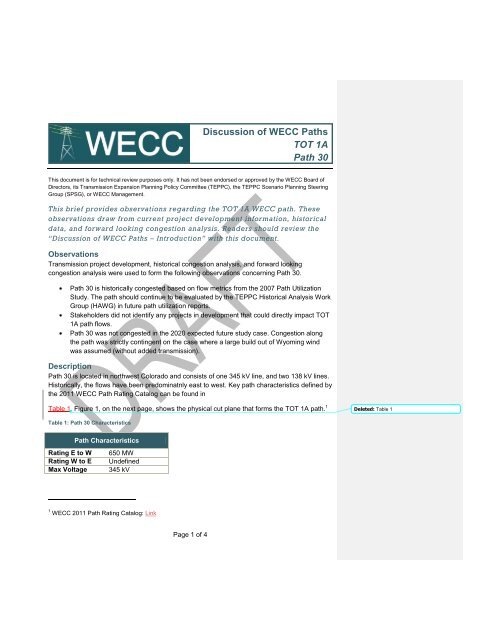
<strong>Discussion</strong> <strong>of</strong> <strong>WECC</strong> <strong><strong>Path</strong>s</strong><strong>TOT</strong> <strong>1A</strong> - <strong>Path</strong> <strong>30</strong>Figure 1: <strong>Path</strong> <strong>30</strong> DefinitionHistorical CongestionThe 2009, 2008, and 2007 Transmission <strong>Path</strong> Utilization Studies include analysis on <strong>Path</strong> <strong>30</strong>.<strong>Path</strong> <strong>30</strong> is historically congested based on flow metrics from the 2007 <strong>Path</strong> Utilization Study.There was at least one season analyzed in the 2007 Study period where <strong>Path</strong> <strong>30</strong> seasonalloading exceeding 75 percent <strong>of</strong> operating transfer capacity 50 percent <strong>of</strong> the time or more. Thisqualified <strong>Path</strong> <strong>30</strong> as one <strong>of</strong> the most heavily utilized paths in the Interconnection according tothe 2007 Study. The 2008 Study reported <strong>Path</strong> <strong>30</strong> operating at or above U75 for 19 percent <strong>of</strong>the study year. However, it was not named as one <strong>of</strong> the Western Interconnection’s mostheavily utilized paths in that study. The 2009 Study cited decreased flow from 2008 levels as<strong>Path</strong> <strong>30</strong> operated at U75 for eight percent <strong>of</strong> the year. <strong>Path</strong> <strong>30</strong> had 80 MW <strong>of</strong> firm ATC availablefor 95 percent <strong>of</strong> the study year, and did not make the final list as one <strong>of</strong> the most heavilyutilized paths in the 2009 Study. Actual flow data can be found in the duration plot in flow inrecent years has decreased relative to 2000 levels. Although informative, the plot does notnecessarily reflect the metrics that support the path as historically congested.Figure 2. As evident in the figure, flow in recent years has decreased relative to 2000 levels.Although informative, the plot does not necessarily reflect the metrics that support the path ashistorically congested.Deleted: %Deleted: %Deleted: %Deleted: 8%Deleted: %Deleted: Figure 2Page 2 <strong>of</strong> 4
Figure 2: <strong>Path</strong> <strong>30</strong> Actual Flow Duration Plot<strong>Discussion</strong> <strong>of</strong> <strong>WECC</strong> <strong><strong>Path</strong>s</strong><strong>TOT</strong> <strong>1A</strong> - <strong>Path</strong> <strong>30</strong>Project DevelopmentStakeholders did not identify any specific potential projects that may have a direct impact on<strong>Path</strong> <strong>30</strong> flows.Future Congestion AnalysisThe forward looking congestion analysis draws upon study case results from production costmodel runs based on 2019 and 2020 datasets. This work was done as a part <strong>of</strong> the 2010 StudyProgram.Expected Future<strong>Path</strong> <strong>30</strong> was not heavily utilized or congested in the expected future case. <strong>TOT</strong> <strong>1A</strong> operated atU75 for only 1.38 percent <strong>of</strong> the year, and at U90 for only 0.23 percent <strong>of</strong> the year. The durationplot in Figure 3 shows this relatively low utilization. The chronological plot in the same figureshows the seasonality <strong>of</strong> the flows. It is worth noting that the 2019 and 2020 datasets assumedan increase in <strong>Path</strong> <strong>30</strong> capacity from 650 MW to 800 MW. Without this increase the utilization <strong>of</strong>the path could have been higher in the expected future scenario.Deleted: %Deleted: %Page 3 <strong>of</strong> 4