Report on Harmonisation of freshwater biological methods
Report on Harmonisation of freshwater biological methods
Report on Harmonisation of freshwater biological methods

You also want an ePaper? Increase the reach of your titles
YUMPU automatically turns print PDFs into web optimized ePapers that Google loves.
Institute for Envir<strong>on</strong>ment and SustainabilityInland and Marine Waters Unit21020 – Ispra (VA), Italy<str<strong>on</strong>g>Report</str<strong>on</strong>g> <strong>on</strong>Harm<strong>on</strong>isati<strong>on</strong> <strong>of</strong> <strong>freshwater</strong><strong>biological</strong> <strong>methods</strong>Ana Cristina Cardoso, Angelo G. Solimini, Guido PremazziC<strong>on</strong>tributing co-authors:Sebastian Birk, Peter Hale, Teresa Rafael, Marias LuisaSerrano2005 EUR 21769 EN
Legal NoticeNeither the European Commissi<strong>on</strong> nor any pers<strong>on</strong>acting <strong>on</strong> the behalf <strong>of</strong> the Commissi<strong>on</strong> is resp<strong>on</strong>sible forthe use, which might be made <strong>of</strong> the following informati<strong>on</strong>.A great deal <strong>of</strong> additi<strong>on</strong>al informati<strong>on</strong> <strong>on</strong> theEuropean Uni<strong>on</strong> is available <strong>on</strong> the internet.It can be accessed through the Europa server(http://europa.eu.int).EUR 21769 EN European Communities, 2005Reproducti<strong>on</strong> is authorised provided the source is acknowledgedPrinted in Italy2
CONTENTSBackground and purpose <strong>of</strong> the document................................................................5Sources <strong>of</strong> informati<strong>on</strong> ................................................................................................6A. Lake.......................................................................................................................6B. River......................................................................................................................7Overview and Comparis<strong>on</strong> <strong>of</strong> the nati<strong>on</strong>al <strong>methods</strong> ................................................8A. Lake.......................................................................................................................9<strong>biological</strong> quality element: Chlorophyll ..............................................................10<strong>biological</strong> quality element: Phytoplankt<strong>on</strong> ..........................................................11<strong>biological</strong> quality element: Phytobenthos............................................................11<strong>biological</strong> Quality element: Macrophytes............................................................12Biological quality element: Benthic invertebrates...............................................12Biological quality element: Fish ..........................................................................13B. River....................................................................................................................13<strong>biological</strong> quality element: Phytoplankt<strong>on</strong> ..........................................................13River <strong>biological</strong> quality element: Phytobenthos..................................................14River <strong>biological</strong> quality element: Macrophytes...................................................15River <strong>biological</strong> quality element: Benthic invertebrates......................................16River <strong>biological</strong> quality element: Fish.................................................................19ISO and CEN Methods..............................................................................................19A. Internati<strong>on</strong>al Organisati<strong>on</strong> for Standardizati<strong>on</strong> (ISO) and Comité Européen deNormalisati<strong>on</strong> (CEN): General background ....................................................20B. Current work programme....................................................................................21C. Proposals for the formulati<strong>on</strong> <strong>of</strong> future work programme items in WG 2..........22D. Current c<strong>on</strong>tributi<strong>on</strong> to WFD intercalibrati<strong>on</strong> ....................................................23E. Future liais<strong>on</strong> and involvement with ECOSTAT WG 2A...................................23Evaluati<strong>on</strong> <strong>of</strong> the usefulness <strong>of</strong> existing <strong>methods</strong> in relati<strong>on</strong> to the WFD ............24A. Lakes ...................................................................................................................24B. Rivers ..................................................................................................................25Evaluati<strong>on</strong> <strong>of</strong> the suitability <strong>of</strong> current metrics as ‘comm<strong>on</strong> metrics’..................27A. Lakes ...................................................................................................................27B. Rivers ..................................................................................................................27C<strong>on</strong>cluding remarks and recommendati<strong>on</strong>s ...........................................................28References...................................................................................................................31Annex I: Compositi<strong>on</strong> <strong>of</strong> the Geographic Intercalibrati<strong>on</strong> Groups......................393
Annex II: Summary <strong>of</strong> the informati<strong>on</strong> gathered from ECOSTAT andM<strong>on</strong>itoring WG <strong>on</strong> the nati<strong>on</strong>al lake <strong>biological</strong> <strong>methods</strong> ......................................41Annex III: River <strong>biological</strong> assessment <strong>methods</strong> from Waterview Database(2004)...........................................................................................................................43Annex IV: Analysis <strong>of</strong> lake <strong>biological</strong> m<strong>on</strong>itoring <strong>methods</strong> (Intercalibrati<strong>on</strong>metadata at 14/01/2004).............................................................................................45Chlorophyll ..........................................................................................................45Phytoplankt<strong>on</strong> ......................................................................................................49Phytobenthos........................................................................................................53Macrophytes.........................................................................................................57Benthic invertebrates ...........................................................................................61Fish.......................................................................................................................64Annex V: Analysis <strong>of</strong> river <strong>biological</strong> m<strong>on</strong>itoring <strong>methods</strong>...................................69Phytoplankt<strong>on</strong> ......................................................................................................69Phytobenthos........................................................................................................69Macrophytes.........................................................................................................73Benthic invertebrates ...........................................................................................75A. Summary <strong>of</strong> the nati<strong>on</strong>al assessment <strong>methods</strong> for rivers using benthicinvertebrates......................................................................................75B. Comparative analysis .........................................................................84Fish.......................................................................................................................93Annex VI: Standardizati<strong>on</strong> process and CEN standards relevant to the WFD.103A. The standardizati<strong>on</strong> process..........................................................................103B. Published CEN standards relevant to the implementati<strong>on</strong> <strong>of</strong> the WFD and theintercalibrati<strong>on</strong> process ..................................................................................105Annex VII: WFD classificati<strong>on</strong> and intercalibrati<strong>on</strong> requirements....................107Annex VIII: Compatibility <strong>of</strong> the nati<strong>on</strong>al classificati<strong>on</strong> <strong>methods</strong> with WFDrequirements.............................................................................................................109Annex IX: WFD Comm<strong>on</strong> Metric ..........................................................................111Annex X: Summary <strong>of</strong> the nati<strong>on</strong>al <strong>biological</strong> assessment <strong>methods</strong> for lakes(WFD Intercalibrati<strong>on</strong> metadata January 2004)..................................................115Annex XI: Harm<strong>on</strong>isati<strong>on</strong> drafting group members............................................1234
Background and purpose <strong>of</strong> the document1. The Water Framework Directive (WFD) requires (Annex V 1.3.6) that standards<strong>methods</strong> are used for the m<strong>on</strong>itoring <strong>of</strong> water quality elements: ‘Methods used for them<strong>on</strong>itoring <strong>of</strong> type parameters shall c<strong>on</strong>form to the internati<strong>on</strong>al standards listedbelow or such other nati<strong>on</strong>al or internati<strong>on</strong>al standards which will ensure theprovisi<strong>on</strong> <strong>of</strong> data <strong>of</strong> an equivalent scientific quality and comparability’.2. In the c<strong>on</strong>text <strong>of</strong> the WFD Comm<strong>on</strong> Implementati<strong>on</strong> Strategy (CIS)Intercalibrati<strong>on</strong> Working Group (WG), a comm<strong>on</strong> issue raised by lake and riverexperts was the lack <strong>of</strong> comparability <strong>of</strong> nati<strong>on</strong>al <strong>biological</strong> assessment systems due todifferent sampling and analytical procedures, and use <strong>of</strong> different metrics for theassessment <strong>of</strong> the degree <strong>of</strong> impact due to the same pressure. This resulted in a str<strong>on</strong>grecommendati<strong>on</strong> from these networks <strong>of</strong> experts for the harm<strong>on</strong>isati<strong>on</strong> <strong>of</strong> thesemethodologies and the possible identificati<strong>on</strong> <strong>of</strong> comm<strong>on</strong> metrics.3. Thus, in the workshop <strong>of</strong> the WFD-CIS Intercalibrati<strong>on</strong> WG, in March 2003 at theJRC, Ispra, it was decided to initiate a task <strong>on</strong> the review <strong>of</strong> the needs forharm<strong>on</strong>isati<strong>on</strong> <strong>of</strong> the <strong>freshwater</strong> <strong>biological</strong> <strong>methods</strong>, under the WFD-CIS WG 2AECOSTAT. The first c<strong>on</strong>tacts and presentati<strong>on</strong> <strong>of</strong> this activity was at the meeting <strong>of</strong>the WG 2A in October 2003 at the JRC, Ispra.4. The report from this task will support the Geographic Intercalibrati<strong>on</strong> Groups(GIGs) in the intercalibrati<strong>on</strong> exercise by providing a c<strong>on</strong>cise overview <strong>of</strong> theavailable <strong>methods</strong> to be c<strong>on</strong>sidered as potential candidates for comm<strong>on</strong> metrics. Thiscan be applied for the harm<strong>on</strong>ised assessment <strong>of</strong> the water bodies bel<strong>on</strong>ging to theintercalibrati<strong>on</strong> network. Furthermore, it identifies the need for the development <strong>of</strong>new <strong>methods</strong> or the further harm<strong>on</strong>isati<strong>on</strong> and standardisati<strong>on</strong> <strong>of</strong> existing <strong>methods</strong>and proposes a procedure to link WFD relevant groups with Comité Européen deNormalisati<strong>on</strong> (CEN) working group elaborating <strong>biological</strong> and ecological assessment<strong>methods</strong>.5. The overall objectives <strong>of</strong> this task are 1) to make an overview and comparis<strong>on</strong> <strong>of</strong>the nati<strong>on</strong>al <strong>biological</strong> <strong>methods</strong> currently in use in EU countries; 2) to evaluate theirapplicability in the assessment <strong>of</strong> the ecological quality <strong>of</strong> inland surface waters (lakesand rivers) as required by the WFD; 3) to evaluate their suitability for use as comm<strong>on</strong>5
metrics for the purpose <strong>of</strong> the intercalibrati<strong>on</strong> exercise, and 4) to identify a way <strong>of</strong>interacti<strong>on</strong> am<strong>on</strong>gst CEN, ECOSTAT WG2A and the WFD Committee allowing forprioritizati<strong>on</strong> <strong>of</strong> WFD relevant <strong>methods</strong> for standardizati<strong>on</strong>.Sources <strong>of</strong> informati<strong>on</strong>6. The following informati<strong>on</strong> was collected (Table 1) and analysed:• <str<strong>on</strong>g>Report</str<strong>on</strong>g>s <strong>of</strong> the <strong>methods</strong> currently in use, and in development, in the Member Statesand Candidate Countries (requested from the ECOSTAT WG 2A);• WFD-CIS M<strong>on</strong>itoring guidance fact-sheets <strong>on</strong> <strong>biological</strong> assessment <strong>methods</strong>;• WFD-Intercalibrati<strong>on</strong> Metadata base (January 2004) c<strong>on</strong>taining informati<strong>on</strong> <strong>on</strong> the<strong>biological</strong> <strong>methods</strong> applied in the assessment <strong>of</strong> the intercalibrati<strong>on</strong> sites;• STAR, WATERVIEW database <strong>of</strong> river <strong>methods</strong>.Table 1. Informati<strong>on</strong> gathered <strong>on</strong> the <strong>biological</strong> nati<strong>on</strong>al <strong>methods</strong>: sources <strong>of</strong> informati<strong>on</strong> andcountries represented.Source Lakes RiversECOSTAT WG2A 14 25WFD-CIS M<strong>on</strong>itoring WG 4 7Intercalibrati<strong>on</strong> metadata (January 2004)* 21 27STAR WATERVIEW Database NA All MS but Fin, CY and Malta,also countries in negotiati<strong>on</strong>NA N<strong>on</strong> applicable* In Annex I is the distributi<strong>on</strong> <strong>of</strong> countries by GIG for lakes and rivers.7. Altogether, the different sources <strong>of</strong> data provided a good geographic coverage <strong>of</strong>the <strong>biological</strong> m<strong>on</strong>itoring systems used in assessing the quality <strong>of</strong> lakes and riversacross Europe. However, some <strong>methods</strong> are poorly described invalidating the use <strong>of</strong>the informati<strong>on</strong> for a comprehensive comparis<strong>on</strong>, which thus in some cases can <strong>on</strong>lybe d<strong>on</strong>e in general terms.A. Lake8. The informati<strong>on</strong> <strong>on</strong> the lake <strong>biological</strong> <strong>methods</strong> reported in the fact sheetsprepared within the WFD-CIS M<strong>on</strong>itoring WG and informati<strong>on</strong> <strong>of</strong> the nati<strong>on</strong>al<strong>methods</strong> sent by the ECOSTAT WG2A is summarized in Annex II. Altogether thereis informati<strong>on</strong> from 14 countries, thus, informati<strong>on</strong> <strong>on</strong> the <strong>biological</strong> <strong>methods</strong> in usein Europe is incomplete.9. Also, it is worth noting that the m<strong>on</strong>itoring fact sheets were compiled during 2002and therefore may so<strong>on</strong> not be representative <strong>of</strong> the <strong>methods</strong> available in the Member6
States and candidate countries. Informati<strong>on</strong> from ECOSTAT WG 2A members clearlyindicates that Member States and candidate countries are working <strong>on</strong> the development<strong>of</strong> WFD compatible <strong>biological</strong> <strong>methods</strong>.10. To establish the register <strong>of</strong> sites for the intercalibrati<strong>on</strong> exercise, Member Statesand Candidate Countries were asked to fill in a metadata questi<strong>on</strong>naire al<strong>on</strong>g with thesites submitted for the exercise. The returned answers give important informati<strong>on</strong> interms <strong>of</strong> compliance with the ecological assessment requirements <strong>of</strong> the WFD andcomparability <strong>of</strong> the nati<strong>on</strong>al <strong>methods</strong>.11. In our evaluati<strong>on</strong>, we have used data stored in the intercalibrati<strong>on</strong> metadata base<strong>of</strong> January 2004 1 . At this date, the database c<strong>on</strong>tained the data used for assessment <strong>of</strong>the ecological quality <strong>of</strong> 314 lakes submitted by 21 countries. However, the lakeswere mostly assessed making use <strong>of</strong> physico-chemical paremeters (all countries, formost lakes) and phytoplankt<strong>on</strong> (18 countries), followed by benthic invertebrates andMacrophytes (Fig. 1).B. River12. The overview <strong>of</strong> the river phytoplankt<strong>on</strong> and phytobenthos m<strong>on</strong>itoring systemsincludes the approaches <strong>of</strong> 18 countries: 4 <strong>methods</strong> for phytoplankt<strong>on</strong> and 15 forphytobenthos. Only 4 countries (Est<strong>on</strong>ia, Latvia, Romania and Hungary) usephytoplankt<strong>on</strong> in their m<strong>on</strong>itoring programs, and in <strong>on</strong>e <strong>of</strong> these, Latvia, it is stillunder development. For phytobenthos, <strong>on</strong>ly a few countries have current m<strong>on</strong>itoringprogrammes, i.e. Austria, France, Slovenia and Romania.1At the time the Harm<strong>on</strong>isati<strong>on</strong> Task started and until the end <strong>of</strong> 2004 the metadata <strong>of</strong> the final registerwas not available. This c<strong>on</strong>tains informati<strong>on</strong> for <strong>on</strong>e more country and more lakes than the previousdraft register. However, we c<strong>on</strong>sidered that for the purpose <strong>of</strong> comparis<strong>on</strong> <strong>of</strong> <strong>methods</strong> these are not soimportant changes and have decided to use the metadata <strong>of</strong> the intercalibrati<strong>on</strong> register as <strong>of</strong> January2004.7
Number <strong>of</strong> sites300250200150100500LAKES LAKES (n = 314)TPData availableData usedPh-pl Ph-be Ang M-alg B inv Fish Chem PressQuality elementFigure 1. Elements (<strong>biological</strong>, chemical and pressure) used for ecological quality assessment<strong>of</strong> the lakes submitted to the intercalibrati<strong>on</strong> metadata (January 2004). Ph-pl=Phytoplankt<strong>on</strong>, Ph-be= Phytobenthos, Ang= Angiosperms, M-alg= Macroalgae,Binv= Benthic invertebrates, Chem= Chemical Parameter (Total phosphorus), Press=Pressures. Note that angiosperms and macroalgae together form the group <strong>of</strong> themacrophytes.13. The overview <strong>of</strong> <strong>biological</strong> m<strong>on</strong>itoring systems using benthic invertebratescomprises 44 systems applied in 32 European countries. All <strong>methods</strong> discussed arelisted in the Annex III comprising data <strong>on</strong> status and literature references. Detaileddescripti<strong>on</strong>s <strong>of</strong> most <strong>methods</strong> comprising the complete set <strong>of</strong> acquired data areavailable at http://starwp3.eu-star.at (Waterview Database).14. The overview <strong>of</strong> the river macrophytes m<strong>on</strong>itoring systems includes theapproaches <strong>of</strong> 10 countries Austria, Denmark, Est<strong>on</strong>ia, France, Germany, Latvia, TheNetherlands, Norway, Sweden and UK.15. The overview <strong>of</strong> fish m<strong>on</strong>itoring systems focus <strong>on</strong> <strong>methods</strong> developed within theEuropean research project FAME that is designed to provide direct support to theWFD. This Project, included the participati<strong>on</strong> <strong>of</strong> twelve countries, Austria, Belgium,France, Greece, Germany, Latvia, Poland, Portugal, Spain, Sweden, The Netherlandsand UK.Overview and Comparis<strong>on</strong> <strong>of</strong> the nati<strong>on</strong>al <strong>methods</strong>16. The comparis<strong>on</strong> <strong>of</strong> the nati<strong>on</strong>al <strong>biological</strong> m<strong>on</strong>itoring systems is complete,wherever informati<strong>on</strong> is available, by c<strong>on</strong>sidering three different steps in them<strong>on</strong>itoring process: sampling and laboratory processing, estimati<strong>on</strong> <strong>of</strong> metric and8
classificati<strong>on</strong>, each <strong>of</strong> these being the source <strong>of</strong> an independent variati<strong>on</strong> to the finalresult <strong>of</strong> the assessment c<strong>on</strong>tributing the uncertainty <strong>of</strong> the final classificati<strong>on</strong> (Fig. 2).Sampling/Surveying, labprocessingMetricClassificati<strong>on</strong>Intercalibrati<strong>on</strong> <strong>biological</strong>assessment methodHarm<strong>on</strong>isati<strong>on</strong>: comparis<strong>on</strong> <strong>of</strong> <strong>biological</strong> m<strong>on</strong>itoring systemsFigure 2. The three steps in the <strong>biological</strong> m<strong>on</strong>itoring systems c<strong>on</strong>sidered for comparis<strong>on</strong> inthe harm<strong>on</strong>isati<strong>on</strong> task.A. Lake17. The comparis<strong>on</strong> <strong>of</strong> the <strong>biological</strong> m<strong>on</strong>itoring systems for lakes uses theintercalibrati<strong>on</strong> metadata and compares approaches in the GIGs (see compositi<strong>on</strong> <strong>of</strong>the lake GIGs in Annex I).18. The intercalibrati<strong>on</strong> <strong>of</strong> lake <strong>biological</strong> assessment <strong>methods</strong> is c<strong>on</strong>fined to theeffects <strong>of</strong> eutrophicati<strong>on</strong> and acidificati<strong>on</strong>, focusing <strong>on</strong> the quality elementsc<strong>on</strong>sidered most relevant for the selected pressures:• Nutrient loading - Eutrophicati<strong>on</strong>:Phytoplankt<strong>on</strong> (including. Chlorophyll-a): necessary for all lake types andwidely used in Member States• Acidificati<strong>on</strong>:Macroinvertebrates: necessary for all lake types, widely used in MemberStates19. Thus, the informati<strong>on</strong> analysed may be biased towards <strong>methods</strong> respecting theabove combinati<strong>on</strong>s <strong>of</strong> pressures and quality elements, even if the intercalibrati<strong>on</strong>metadata questi<strong>on</strong>naire gather informati<strong>on</strong> <strong>on</strong> the other <strong>biological</strong> elements.20. In general terms, every country has different sampling procedures for each <strong>of</strong> the<strong>biological</strong> elements. Even within a country there may be different samplingprocedures adopted for different lakes or lake areas m<strong>on</strong>itored. Most sampling9
procedures, for any <strong>of</strong> the <strong>biological</strong> elements, have some degree <strong>of</strong> standardizati<strong>on</strong> ata nati<strong>on</strong>al level, and when internati<strong>on</strong>al standards are available these are <strong>of</strong>tenfollowed. The <strong>biological</strong> material collected have generally a good tax<strong>on</strong>omicresoluti<strong>on</strong> with identificati<strong>on</strong> <strong>of</strong> many organisms to species. For the majority <strong>of</strong> thecountries, the metrics estimated for the <strong>biological</strong> elements do not respect the WFDrequirements. Type specific reference c<strong>on</strong>diti<strong>on</strong>s, are <strong>on</strong>ly known for some benthicinvertebrate metrics in two countries, i.e. Sweden and UK. Also, there are somepreliminary reference c<strong>on</strong>diti<strong>on</strong>s (mostly lake specific) for fish metrics also forSwedish lakes. The UK and Germany have developed multimetric indexes based <strong>on</strong>macroinvertebrates and aquatic plants in small lakes, for which reference c<strong>on</strong>diti<strong>on</strong>sare derived from a wide range <strong>of</strong> envir<strong>on</strong>mental c<strong>on</strong>diti<strong>on</strong>s and geology. It is asappears to have good applicability to the WFD. However, <strong>on</strong>ly 2 nati<strong>on</strong>al assessment<strong>methods</strong> based <strong>on</strong> benthic invertebrates are c<strong>on</strong>sidered to be WFD compatible (seeAnnex VII).21. A more detailed comparis<strong>on</strong> <strong>of</strong> the lake <strong>methods</strong> can be found in Annex IV.BIOLOGICAL QUALITY ELEMENT: CHLOROPHYLL22. In the GIGs the percentage <strong>of</strong> lakes for which chlorophyll a is measured variesbetween 40% (Eastern C<strong>on</strong>tinental, EC) and 100% (Mediterranean, ME), with anoverall average <strong>of</strong> 82.5%. However, there is great heterogeneity both within GIG andbetween GIGs in terms <strong>of</strong> the sampling and analytical <strong>methods</strong>.23. The most frequent sampling method in all the GIGs involves the collecti<strong>on</strong> <strong>of</strong>surface samples between 2 and 12 times per year (whole year (m<strong>on</strong>thly) orc<strong>on</strong>centrated during spring, summer, or vegetati<strong>on</strong> periods) at <strong>on</strong>ly <strong>on</strong>e stati<strong>on</strong>.24. The extracti<strong>on</strong> <strong>methods</strong> vary widely within GIGs, am<strong>on</strong>g GIGs and even within asingle country. These can explain c<strong>on</strong>siderable variance in the measurement <strong>of</strong>chlorophyll a c<strong>on</strong>centrati<strong>on</strong>.25. Only 4 countries have informed to employ internati<strong>on</strong>al standard <strong>methods</strong> for thedeterminati<strong>on</strong> <strong>of</strong> chlorophyll a, and 2 other countries make use <strong>of</strong> nati<strong>on</strong>alstandardized <strong>methods</strong>.10
BIOLOGICAL QUALITY ELEMENT: PHYTOPLANKTON26. Most countries include in their <strong>biological</strong> m<strong>on</strong>itoring systems some metric forphytoplankt<strong>on</strong>. The lowest number <strong>of</strong> lakes for which phytoplankt<strong>on</strong> is m<strong>on</strong>itored isin the NO GIG (54%), in all other GIGs at least 60% <strong>of</strong> the lakes are m<strong>on</strong>itored forphytoplankt<strong>on</strong>. However, there is great heterogeneity both within GIG and betweenGIGs in terms <strong>of</strong> the sampling and metrics estimated.27. The most frequent sampling method in all the GIGs involves the collecti<strong>on</strong> <strong>of</strong>surface samples between 2 and 12 times per year (spring and summer) at <strong>on</strong>e stati<strong>on</strong>.28. The metrics used in the assessment differ both within and am<strong>on</strong>g GIGs, but mostcountries measure abundance and biomass and successively less countries record alsobloom occurrence, size compositi<strong>on</strong> and primary productivity. There are no countriesthat completely fulfill the WFD metric requirements.BIOLOGICAL QUALITY ELEMENT: PHYTOBENTHOS29. Most countries do not use phytobenthos in their <strong>biological</strong> m<strong>on</strong>itoring. Thehighest number <strong>of</strong> lakes m<strong>on</strong>itored for phytobenthos is found in the EC GIG followedclosely by CE and AL GIGs, while in the NO GIG countries this <strong>biological</strong> element isnot used at all at intercalibrati<strong>on</strong> sites. Like for other elements, there is greatheterogeneity both within GIG and between GIGs in terms <strong>of</strong> the sampling andmetrics estimated.30. In cases where phytobenthos is sampled, the most frequent sampling frequency isbetween 2 and 6 times per year, and the number <strong>of</strong> sampling stati<strong>on</strong>s in each lake varyin the GIGs from <strong>on</strong>e lake stati<strong>on</strong> (all lakes in the AT and EC GIGs), 2-10 stati<strong>on</strong>s(most lakes in the BA and CE GIGs), or more than 10 stati<strong>on</strong>s (all lakes in the MEGIG and most in the AL GIG).31. As with chlorophyll a and phytoplankt<strong>on</strong>, sampling is held during the vegetati<strong>on</strong>growth period, spring and summer. The habitats sampled differ, some countriessample epilithic and others epiphytic phytobenthos. The compositi<strong>on</strong> metrics arespecies compositi<strong>on</strong>, presence or absence <strong>of</strong> species and indicator taxa. The quantitymetrics are the relative abundance <strong>of</strong> species, indicator taxa and excessive growth <strong>of</strong>nuisance species such as Cladophora. Most countries include in their assessment both11
an estimate <strong>of</strong> phytobbenthos community compositi<strong>on</strong> and an estimate <strong>of</strong> theirabundance.BIOLOGICAL QUALITY ELEMENT: MACROPHYTES32. The aquatic Macrophytes are widely used in the <strong>biological</strong> m<strong>on</strong>itoring systems <strong>of</strong>the AT, BA and CE GIGs and less in all other GIGs.33. Sampling occurs mostly between 2 and 6 times per year, during the summer orother vegetati<strong>on</strong> period, in a variable number <strong>of</strong> sampling stati<strong>on</strong>s (1 to 20) in eachlake. In the AL, AT, BA and ME GIGs all emergent, floating and submerged plantsare sampled. In c<strong>on</strong>trast in the CE and NO GIGs not all countries sample the threegroups <strong>of</strong> plants.34. Macrophytes communities’ compositi<strong>on</strong> and abundance are recorded from visualinspecti<strong>on</strong>s in the field from the shore. In cases when the whole lake is m<strong>on</strong>itored thisis d<strong>on</strong>e by boat. In most countries the plants are identified to species and abundanceand/or diversity determined.BIOLOGICAL QUALITY ELEMENT: BENTHIC INVERTEBRATES35. The percentage <strong>of</strong> lakes for which benthic invertebrates are sampled within theGIGs is for part most below 40%, with excepti<strong>on</strong> <strong>of</strong> AT and CE.36. Sampling frequency is variable between GIGs, the most comm<strong>on</strong> frequencies are1 or 2-6 times per year, and occurs mostly in spring and summer but in the AL andNO GIGs it is performed all year round.37. A wide number <strong>of</strong> sampling approaches and metrics are used. The collecti<strong>on</strong> <strong>of</strong>samples is performed by several different devices: grab, Eckman skip, stickingcylinder, triangle bottom scraper and hand net. The mesh size varies widely from100µm to 670µm. When kick sampling is used time (1-3 minutes), mesh size (100-670µm) and habitat sampled are different. (littoral in general or st<strong>on</strong>es <strong>on</strong>ly). Somecountries sampled in lake littoral, other the pr<strong>of</strong>undal and some in both lake z<strong>on</strong>es.Only 2 countries have informed to make use <strong>of</strong> internati<strong>on</strong>al sampling standard<strong>methods</strong>. These standards are currently under revisi<strong>on</strong>.38. Every country uses a different combinati<strong>on</strong> <strong>of</strong> metrics, the following metrics areeither used al<strong>on</strong>e or in combinati<strong>on</strong>: abundance and relative abundance, diversity12
indicators, species lists, frequency <strong>of</strong> occurrence <strong>of</strong> individual taxa, number <strong>of</strong> taxa,group ratios, average score per taxa, biotic score, biotic integrity index, saprobicindex, average score per tax<strong>on</strong> and ratio <strong>of</strong> littoral to pr<strong>of</strong>undal taxa.BIOLOGICAL QUALITY ELEMENT: FISH39. Most countries do not use fish in their <strong>biological</strong> m<strong>on</strong>itoring and assessmentprogrammes. The higher number <strong>of</strong> lakes sampled for fish is found in the BA, CE andNO GIGs.40. The sampling frequency is variable generally 2-12 times per year with summerand autumn as the most comm<strong>on</strong> sampling seas<strong>on</strong>s.41. A total <strong>of</strong> 13 countries are sampling fishes in lakes using a total <strong>of</strong> 7 differentapproaches, either al<strong>on</strong>e or in combinati<strong>on</strong>, for gathering informati<strong>on</strong>: net fishing(gillnets and trammel net), electr<strong>of</strong>ishing, hydroacoustics, catch statistics, informati<strong>on</strong>from anglers and historic data. The majority <strong>of</strong> the countries determine speciescompositi<strong>on</strong>, some the native species and or functi<strong>on</strong>al group ratios. Fish abundanceis determined as total biomass, relative biomass (CPUE), either for the whole fishcommunity per species, and as density. The age structure or size structure isdetermined in <strong>on</strong>ly two countries.B. River42. A more detailed comparis<strong>on</strong> <strong>of</strong> river <strong>methods</strong> can be found in Annex V.BIOLOGICAL QUALITY ELEMENT: PHYTOPLANKTON43. The overview <strong>of</strong> the river phytoplankt<strong>on</strong> m<strong>on</strong>itoring systems includes theapproaches <strong>of</strong> 4 nati<strong>on</strong>al <strong>methods</strong>. There is great heterogeneity in terms <strong>of</strong> thesampling and metrics estimated. Sampling frequency vary from weekly at some sitesto every five years.44. The level <strong>of</strong> tax<strong>on</strong>omic resoluti<strong>on</strong> used in all the assessment methodologies based<strong>on</strong> river phytoplankt<strong>on</strong> is the species or genus. Absolute or relative abundance isdetermined in all 4 <strong>methods</strong>, while biomass is determined by two countries.45. Three different categories <strong>of</strong> assessment <strong>methods</strong> were identified in this review:biotic indices, assemblage/community assessment and multimetric indices.13
RIVER BIOLOGICAL QUALITY ELEMENT: PHYTOBENTHOS46. The overview <strong>of</strong> the river phytobenthos m<strong>on</strong>itoring systems includes theapproaches <strong>of</strong> 15 countries. The phytobenthos community includes diatom and n<strong>on</strong>diatomgroups. However, most <strong>of</strong> the developed <strong>methods</strong>, especially in m<strong>on</strong>itoringprograms are based <strong>on</strong>ly <strong>on</strong> the diatom group. Only <strong>on</strong>e country was found to have am<strong>on</strong>itoring programme covering both diatom and n<strong>on</strong>-diatom groups, while anotherhas a new assessment method under development that includes both groups.47. The sampling procedure is based in the European Norms EN 13946 (2003) Waterquality: Guidance standard for the routine sampling and pretreatment <strong>of</strong> benthicdiatoms for rivers for water quality assessment and/or in nati<strong>on</strong>al methodologicalguidelines. Some countries, for example Germany and the United Kingdom use therecommendati<strong>on</strong>s <strong>of</strong> Kelly et al. (1998).48. Both documents <strong>on</strong>ly c<strong>on</strong>cern diatoms, but a working document for a proposednew European Standard is in preparati<strong>on</strong> which includes algal groups other thandiatoms (cyanobacteria, green algae, red algae, etc.).49. A recent draft summarising the <strong>methods</strong> using benthic algae to assess waterquality in running water c<strong>on</strong>cluded that the main processes in use for routine samplingare similar, <strong>on</strong>ly details that depend <strong>on</strong> current velocity and dominating type <strong>of</strong>available substratum may vary (CEN TC230 N68).50. The available informati<strong>on</strong> shows that scraping with a brush from the naturalsubstrates (st<strong>on</strong>es) is the most comm<strong>on</strong> method. Quantitative sampling is performedin some cases, using a fixed surface area for sampling that varies between 9cm 2 and100cm 2 . Artificial subtracts are <strong>on</strong>ly used by 2 countries.51. C<strong>on</strong>cerning the sampling habitat, 6 methodologies are multihabitat, 6 are singlehabitat related with hard subtracts (cobbles or st<strong>on</strong>es) and 3 did not answer. Thesedifferent procedures do not allow comparability between the results as they reflectdifferent ecological situati<strong>on</strong>s.52. The sampling frequency for phytobenthos m<strong>on</strong>itoring varies from annually toevery 3 or 4 years. The level <strong>of</strong> tax<strong>on</strong>omic resoluti<strong>on</strong> used is the species or speciesgroups. Only <strong>on</strong>e country uses higher tax<strong>on</strong>omic levels, which varies from species t<strong>of</strong>amily or higher.14
53. The identificati<strong>on</strong> and enumerati<strong>on</strong> <strong>of</strong> relative proporti<strong>on</strong>s <strong>of</strong> diatom taxa is based<strong>on</strong> a European Standard EN 14407 (2004) Water quality: Guidance standard for theidentificati<strong>on</strong>, enumerati<strong>on</strong> and interpretati<strong>on</strong> <strong>of</strong> benthic diatom samples fromrunning water. Some countries use the OMNIDIA s<strong>of</strong>tware for tax<strong>on</strong>omicidentificati<strong>on</strong> (Lecointe et al., 1993), which allows the calculati<strong>on</strong> <strong>of</strong> a great number<strong>of</strong> diatom indices and c<strong>on</strong>tains a systematic and an ecological database. C<strong>on</strong>sultati<strong>on</strong><strong>of</strong> other literature is also recommended for the algal identificati<strong>on</strong>, like floras,identificati<strong>on</strong> guides and ic<strong>on</strong>ographs appropriated to the habitats and geographicregi<strong>on</strong> under c<strong>on</strong>siderati<strong>on</strong>.54. The recording <strong>of</strong> abundance is usually expressed as the number <strong>of</strong> cells per tax<strong>on</strong>per sample <strong>on</strong> occasi<strong>on</strong>s using abundance classes. Relative coverage <strong>of</strong> the river bedis also menti<strong>on</strong>ed by <strong>on</strong>e country.55. Three different categories <strong>of</strong> assessment <strong>methods</strong> were identified in this review:biotic indices, assemblage/community assessment and multimetric indices.Bioticindices are the most comm<strong>on</strong> assessment method including 5 different approaches allbased in diatom assemblages, applied to 9 countries. Only <strong>on</strong>e country is usingassemblage/community assessment (Austria) and two are using multimetric indicesEst<strong>on</strong>ia and Germany). The Biological Diatom Index’ (IBD- Indice BiologiqueDiatomées; AFNOR, 2000) is the <strong>on</strong>ly standardized method applied <strong>on</strong> a nati<strong>on</strong>allevel.RIVER BIOLOGICAL QUALITY ELEMENT: MACROPHYTES56. Macrophytes are m<strong>on</strong>itored in ten countries <strong>of</strong> the European Uni<strong>on</strong> also includingNorway. All <strong>methods</strong> comprise the investigati<strong>on</strong> <strong>of</strong> watercourse vegetati<strong>on</strong> by means<strong>of</strong> regular visual from the banks or by wading in the stream to record the tax<strong>on</strong>omiccompositi<strong>on</strong> and abundance <strong>of</strong> water plants. Assessment <strong>of</strong> the ecological quality <strong>of</strong>watercourses is d<strong>on</strong>e by five different schemes. Recently 3 countries have developedmacrophyte <strong>methods</strong> to meet the requirements <strong>of</strong> the WFD.57. Sampling area differs between individual <strong>methods</strong>: separate transects <strong>of</strong> 0.25 x0.25 m² are sampled, survey an area <strong>of</strong> at least 100 m², other schemes prescribe theinvestigati<strong>on</strong> <strong>of</strong> stream reaches <strong>of</strong> 100 m or 500 m. Only two countries follow thestandard EN 14184:2003 Water quality: Guidance standard for the surveying <strong>of</strong>aquatic macrophytes in running waters.15
58. Most comm<strong>on</strong>ly macrophytes are identified to species level, which is usually d<strong>on</strong>ein the field. Uncertain identificati<strong>on</strong>s are verified in the laboratory by referring toherbarium species. Abundance is recorded in most countries as the relative plantcoverage or specifies the ‘plant mass estimate’ accounting for the three-dimensi<strong>on</strong>alextensi<strong>on</strong> <strong>of</strong> the plant stand. In both opti<strong>on</strong>s abundance is expressed in classes, but formost <strong>methods</strong> the number <strong>of</strong> classes and the defined ranges deviate.59. The numerical evaluati<strong>on</strong> <strong>of</strong> macrophyte compositi<strong>on</strong> and abundance is based <strong>on</strong> asingle biotic index integrating indicator species and their abundance, and is includedin assessment <strong>methods</strong> <strong>of</strong> 5 countries.60. A multimetric assessment based <strong>on</strong> macrophytes is d<strong>on</strong>e by 2 countries. Oneassessessment method is dependent <strong>on</strong> the stream type, is based <strong>on</strong> a separatelyevaluati<strong>on</strong> <strong>of</strong> mosses and phanerogams to which further metrics (e.g. evenness,percentage <strong>of</strong> Sparganium emersum etc.) can be added to the results <strong>of</strong> the mainindex. Besides the assessment <strong>of</strong> general degradati<strong>on</strong>, the method comprises modulesfor the detecti<strong>on</strong> <strong>of</strong> acidificati<strong>on</strong> in base-poor mountain streams. The other methodc<strong>on</strong>siders the percent coverage <strong>of</strong> plant growth forms and the abundance <strong>of</strong> streamtype-specific indicator species to assess general stream degradati<strong>on</strong>. In both <strong>methods</strong>the overall quality <strong>of</strong> the watercourse is derived <strong>on</strong> the basis <strong>of</strong> the analysis <strong>of</strong> theentire aquatic flora including phytobenthos.61. The number <strong>of</strong> quality classes ranges from four to seven.RIVER BIOLOGICAL QUALITY ELEMENT: BENTHIC INVERTEBRATES62. The biodegradable organic polluti<strong>on</strong> represents the main focus <strong>of</strong> the <strong>biological</strong>assessment in European rivers.63. The sampling procedure <strong>of</strong> a large number <strong>of</strong> <strong>methods</strong> applied in m<strong>on</strong>itoringprogrammes using benthic invertebrates is based <strong>on</strong> the Internati<strong>on</strong>al Standard ISO7828 (1985) or the adopted European Norm EN 27828 (1994) Water quality. Methods<strong>of</strong> <strong>biological</strong> sampling: Guidance <strong>on</strong> handnet sampling <strong>of</strong> aquatic benthic macroinvertebrates.Several <strong>methods</strong> which do not directly referring to these internati<strong>on</strong>alstandards carry out ‘kick and sweep’ sampling that is regulated by nati<strong>on</strong>al norms/<strong>methods</strong>.16
64. In general, this technique is the most comm<strong>on</strong> sampling procedure and applied in30 <strong>methods</strong> using a hand-net. The nets used differ in size <strong>of</strong> the opening and mesh.Net-openings specified by the assessment <strong>methods</strong> vary between approximately 600and 900 square centimetres. In half <strong>of</strong> the schemes, animals are retained by meshsizes<strong>of</strong> about 500 µm.65. The procedure <strong>of</strong> quantitative sampling is standardised by the guidance ISO 8265(1988) or EN 28265 (1994) Methods <strong>of</strong> <strong>biological</strong> sampling: Guidance <strong>on</strong> the designand use <strong>of</strong> quantitative samplers for benthic macro-invertebrates <strong>on</strong> st<strong>on</strong>y substratain shallow <strong>freshwater</strong>s. Surber samplers are most comm<strong>on</strong>ly used for quantitative,area-related sampling. The recommendati<strong>on</strong>s <strong>of</strong> this standard for maximum aperturesize <strong>of</strong> the net range between 250 to 750 µm. The models currently applied in variousnati<strong>on</strong>al watercourse m<strong>on</strong>itoring programmes differ in sampled area (0.01 to 0.12 m²)and mesh-size (100 to 500 µm).66. In deeper streams benthic macroinvertebrates are taken using <strong>of</strong> grabs, dredgesand artificial substrates. The applicati<strong>on</strong> <strong>of</strong> these devices is standardised in ISO 9391(1993) or EN ISO 9391 (1995). These are the same standards as the previous <strong>on</strong>es.The difference in dates is caused by the different dates <strong>of</strong> publicati<strong>on</strong> by the twoorganisati<strong>on</strong>s.67. ISO and CEN standards for sampling invertebrates are currently under revisi<strong>on</strong> tomake them more WFD compliant, but the timescale for publicati<strong>on</strong> will be severalyears.68. Sampling varies from seas<strong>on</strong>al collecti<strong>on</strong>s to procedures c<strong>on</strong>ducted every fiveyears. Annual sampling is the most comm<strong>on</strong> interval applied in river m<strong>on</strong>itoring. Insome m<strong>on</strong>itoring programs observing the sapro<strong>biological</strong> water quality sampling isseas<strong>on</strong>al. This inevitably influences the degree <strong>of</strong> uncertainty <strong>of</strong> the resultingecological classificati<strong>on</strong>s, i.e. the likelihood <strong>of</strong> the banding allocated69. Nearly 60 percent <strong>of</strong> the <strong>methods</strong> applied determine at least selected orders <strong>of</strong>benthic invertebrates to species- or species groups-level. The remainingapproximately 40 percent <strong>of</strong> <strong>methods</strong>, identify organisms to genus or family. It mustbe noted that in several assessment <strong>methods</strong> taxa are identified to lower levels thanrequired to adequately compute the respective quality index.17
70. Nearly 50 percent <strong>of</strong> macroinvertebrate <strong>methods</strong> record the abundance in number<strong>of</strong> individuals per area. In fact, purely quantitative data require area-related samplingprocedures by means <strong>of</strong> quadrate samplers, grabs or similar devices. Since theserequirements are <strong>on</strong>ly met by a few schemes, abundance statements based <strong>on</strong> semiquantitativehand-net sampling are in most cases <strong>of</strong> restricted reliability but they arecheap, practical and effective.71. There are different abundance classificati<strong>on</strong> schemes in use, the most comm<strong>on</strong>are: i) 3-class scheme, derived from Pantle and Buck (1955) applying the SaprobicIndex; ii) 5-class scheme, there two systems in Europe: <strong>on</strong>e based <strong>on</strong> a logarithmicscale <strong>of</strong> organisms’ abundance (Murray-Bligh, 1999) and the Quality Rating System;iii) 7-classes scheme, established by Knöpp (1955) this classificati<strong>on</strong> has beenincluded in the German standard DIN 38 410 (1990, 2003): Determinati<strong>on</strong> <strong>of</strong>Saprobic Index <strong>of</strong> Running Waters.72. Assessment <strong>methods</strong> operating <strong>on</strong> the basis <strong>of</strong> presence/absence data <strong>of</strong>macroinvertebrate taxa do not necessarily need to record taxa abundance. Many bioticindices like I.B.G.N., IBE, BMWP-ASPT or BBI are not designed to includeabundance informati<strong>on</strong>. Their outputs may be biased by single organisms drifting intothe sample from upstream reaches. Therefore, the individual systems prescribe toinclude <strong>on</strong>ly taxa that exceed a certain threshold <strong>of</strong> abundance to avoid false results.73. Seven different categories <strong>of</strong> assessment <strong>methods</strong> can be distinguished am<strong>on</strong>g the<strong>methods</strong> currently used according to the type and scope <strong>of</strong> measured parameters(“metrics“) (Knoben et al., 1995; Verd<strong>on</strong>schot, 2000):− Saprobic Indices (represent specific modes <strong>of</strong> biotic scores)− Diversity Indices− Predictive Assessment− Process Assessment− Rapid Bioassessment− Multimetric Assessment− Ecosystem Comp<strong>on</strong>ents Assessment18
RIVER BIOLOGICAL QUALITY ELEMENT: FISH74. In November 2004 the European –FAME (Fish-based assessment method for theecological status) project was completed– This was aimed at developing, evaluatingand implementing a new fish based assessment method for the ecological status <strong>of</strong>European rivers in direct support to the WFD. This project, included the participati<strong>on</strong><strong>of</strong> twelve European countries, and has delivered recommendati<strong>on</strong>s c<strong>on</strong>cerning fishsampling and data interpretati<strong>on</strong>.The results <strong>of</strong> the project are being c<strong>on</strong>sidered forCEN standardizati<strong>on</strong> and has potential to be included in the future WFD m<strong>on</strong>itoringplans.75. Currently, different fish based <strong>methods</strong> are used throughout Europe to assess theecological status <strong>of</strong> rivers.76. A short descripti<strong>on</strong> <strong>of</strong> the <strong>methods</strong> currently in use and those developed within theFAME project is given in Annex V.77. In Europe, fish sampling <strong>methods</strong> differ greatly between countries, and evenbetween regi<strong>on</strong>s or states bel<strong>on</strong>ging to the same country. As a corollary, nati<strong>on</strong>alsampling <strong>methods</strong> rarely exist. However, in some European countries, fish m<strong>on</strong>itoringprogrammes have been designed to assess the ecological quality <strong>of</strong> rivers based <strong>on</strong>fish assemblages. These m<strong>on</strong>itoring programmes have, to some extent, led to thestandardisati<strong>on</strong> <strong>of</strong> sampling procedures, at least at the regi<strong>on</strong>al level. At the nati<strong>on</strong>alor internati<strong>on</strong>al levels, the development <strong>of</strong> fish based <strong>methods</strong> <strong>of</strong> river qualityassessment are limited by the diversity <strong>of</strong> fish sampling procedures, and c<strong>on</strong>sequentlythe fish databases were restricted to sampling sites for which similar fish sampling<strong>methods</strong> were applied.78. The majority <strong>of</strong> the procedures and devices described in the WFD intercalibrati<strong>on</strong>metadata base c<strong>on</strong>sist <strong>of</strong> electric fishing and occasi<strong>on</strong>ally hand nets.ISO and CEN Methods79. In Annex VI is described the CEN standardisati<strong>on</strong> process and are listed thepublished standards <strong>of</strong> relevance in relati<strong>on</strong> to the WFD.19
A. Internati<strong>on</strong>al Organisati<strong>on</strong> for Standardizati<strong>on</strong> (ISO) and ComitéEuropéen de Normalisati<strong>on</strong> (CEN): General background80. The standardizati<strong>on</strong> <strong>of</strong> <strong>biological</strong> <strong>methods</strong> is undertaken in ISO TechnicalCommittee (TC) 147 subcommittee (SC) 5 – Biological <strong>methods</strong> and CEN/TC 230working group (WG) 2 – Biological and Ecological Assessment Methods. Thesecommittees and their parent bodies work closely together to ensure that there is nooverlap in their respective work programmes.81. The work programme <strong>of</strong> ISO/TC 147/SC 5 is primarily to develop toxicity andbiodegradability <strong>methods</strong> including the supporting statistical methodologies andhence are not relevant to the intercalibrati<strong>on</strong> exercise and will not be c<strong>on</strong>sidered indetail here.82. The development <strong>of</strong> <strong>biological</strong> and ecological assessment <strong>methods</strong> is now solelywithin CEN/TC 230/WG 2, which is comprised <strong>of</strong> 6 task groups (TGs) and an ad hocstrategy group (Fig. 3).Figure 3. Structure <strong>of</strong> WG 2 <strong>biological</strong> and ecological assessment <strong>methods</strong> within the c<strong>on</strong>text<strong>of</strong> the technical committee, CEN/TC 230.83. The work programme <strong>of</strong> WG 2 is in support <strong>of</strong> all legislati<strong>on</strong> where there is aninherent or specific requirement under existing EU legislati<strong>on</strong> for <strong>biological</strong> andecological assessment <strong>methods</strong>. However, it is obvious from the titles <strong>of</strong> the Taskgroups that WFD has a large influence <strong>on</strong> the standards being developed.20
84. The development <strong>of</strong> specific standards is very much the domain <strong>of</strong> the individualtask groups. WG 2 manages the work programme <strong>of</strong> its task groups advised by its adhoc strategy group in liais<strong>on</strong>s with expert groups, DG Envir<strong>on</strong>ment, Joint ResearchCentre, ECOSTAT (Ecological Status) etc, in prioritising future work items for thetask groups.B. Current work programme85. The CEN/TC 230/WG 2 work programme will change over time as standards arecompleted and as new work items are initiated. Table 2 provides a summary <strong>of</strong> activeformal work items up to July 2005.Table 2. CEN/TC 230/WG 2 formal work programme (July 2005).CEN Reference Work item CommentCEN230217 Water Quality – Guidance standard for the surveying <strong>of</strong> NWIP approvedprENXXX macrophytes in lakesCEN 230175 Water Quality – Guidance standard <strong>on</strong> the routinesampling <strong>of</strong> benthic algae in fast flowing, shallowwaters to include laboratory proceduresOriginal WI deleted butNWIP will be requested toinclude expanded scopeCEN 230171 Water Quality – Guidance <strong>on</strong> the scope and selecti<strong>on</strong> <strong>of</strong>PrEN14962CEN 230169prEN/ISO16665CEN 230216prEN/ISO 19493CEN 230207prEN15204CEN230209prEN 14996CEN 230208prEN15110CEN230171prEN14962CEN 230213prEN/ISO15196WI 230165CEN230172prEN 14757WIXX N72 ECEN230118prEN 14614prEN 14393prEN 8692fish sampling <strong>methods</strong>.Water Quality – Guidelines for quantitativeinvestigati<strong>on</strong>s <strong>of</strong> marine s<strong>of</strong>t-bottom benthic fauna inthe marine envir<strong>on</strong>mentWater Quality – Guidance <strong>on</strong> marine <strong>biological</strong> surveys<strong>of</strong> littoral and sublittoral hard bottomWater Quality – Guidance standard for routine analysis<strong>of</strong> phytoplankt<strong>on</strong> abundance and compositi<strong>on</strong> usinginverted microscopy (Utermöhl technique)Water Quality – Guidance <strong>on</strong> assuring the quality <strong>of</strong><strong>biological</strong> and ecological assessments in the aquaticenvir<strong>on</strong>mentWater Quality – Guidance standard for the routinesampling <strong>of</strong> zooplankt<strong>on</strong> from standing watersWater Quality – Guidance <strong>on</strong> the scope and selecti<strong>on</strong> <strong>of</strong>fish sampling <strong>methods</strong>Water Quality – Guidance <strong>on</strong> the sampling andprocessing <strong>of</strong> the pupal exuviae <strong>of</strong> Chir<strong>on</strong>omidae (OrderDiptera) for ecological assessmentWater quality – Guidance <strong>on</strong> data collati<strong>on</strong>,interpretati<strong>on</strong> and classificati<strong>on</strong> <strong>of</strong> running waters based<strong>on</strong> aquatic macrophytesWater quality – Sampling <strong>of</strong> fish with multi-meshgillnetsWater quality – Guidance standard for surveying <strong>of</strong>benthic macro-invertebrates in lentic watersWater quality – Guidance standard for assessing thehydromorphological features <strong>of</strong> riversWater quality – Guidance <strong>on</strong> quality assurance aspects<strong>of</strong> aquatic macrophytes surveying and analysis inrunning watersWater quality – Fresh water algal growth inhibiti<strong>on</strong> testISO lead but proposed forparallel adopti<strong>on</strong>CEN leadInclude in workprogramme in June 200421
CEN230211prEN/ISO 20079CEN230210prEN/ISO 16712CEN230XXXprENXXXCEN230XXXprENXXXwith unicellular green algae (ISO/DIS 8692)Water quality – Determinati<strong>on</strong> <strong>of</strong> the toxic effects <strong>of</strong>water c<strong>on</strong>stituents and waste water to duckweed (Lemnaminor) – Duckweed growth inhibiti<strong>on</strong> testWater quality – Determinati<strong>on</strong> <strong>of</strong> acute toxicity <strong>of</strong>marine or estuarine sediments to amphipodsWater quality - Guidance <strong>on</strong> pro-rata multi-habitatsampling<strong>of</strong> benthic invertebrates from wadeable riversWater quality – Guidance standard <strong>on</strong> the design <strong>of</strong>multimetric indicesUAP-vote, ISO/CENUAP-vote, ISO/CEN86. In WFD terms the current programme c<strong>on</strong>tributes to but does not completely meetthe more immediate needs for intercalibrati<strong>on</strong> or subsequent m<strong>on</strong>itoring. This reflectsthe lack <strong>of</strong> resources available to WG 2 in supporting the relevant specialistworkshops, encouraging experts to devote time to standardizati<strong>on</strong> especially thosefrom the new EU countries, pre- and co-normative research, translati<strong>on</strong> services etc.C. Proposals for the formulati<strong>on</strong> <strong>of</strong> future work programme items in WG 287. Under advice from the expert (TG) groups and the ad hoc group WG 2 hasdeveloped a strategy document designed to prioritise future work programmeactivities, which has been widely distributed. ECOSTAT is invited to c<strong>on</strong>firmwhether or not this prioritisati<strong>on</strong> meets there needs and timescales.88. The work programme changes in resp<strong>on</strong>se to the perceived needs <strong>of</strong> the EU and isc<strong>on</strong>strained by the absence <strong>of</strong> financial support and the identificati<strong>on</strong> <strong>of</strong>methodologies that are suitable for standardizati<strong>on</strong>. In this respect the EU sp<strong>on</strong>soredR&D has a critical role in assisting the standardizati<strong>on</strong> process. For example, in theMay 2004 meeting the EU STAR (Standardizati<strong>on</strong> <strong>of</strong> River Classificati<strong>on</strong>) projectsubmitted two proposals for standardizati<strong>on</strong> in relati<strong>on</strong> to multihabitat sampling <strong>of</strong>invertebrates in wadeable streams and the selecti<strong>on</strong> <strong>of</strong> multimetrics. Both were likelyto be proposed as new work items in CEN and will shortly be added to the WG2Aworkprogramme. Similarly the EU FAME (Fish Assessment Method for Europe)project has developed a European classificati<strong>on</strong> system based <strong>on</strong> fish and WG 2 isliaising with the project leaders <strong>on</strong> the possibility <strong>of</strong> standardizing this work and anominated FAME expert will attend the next CEN/ TC 230 meeting.89. However, numerous other working documents are under c<strong>on</strong>siderati<strong>on</strong> includingsuch diverse items as laboratory intercalibrati<strong>on</strong> for ecological assessment,hydroacoustics for n<strong>on</strong>-destructive fishery assessment, sampling <strong>of</strong> marine algae, best22
practice guides for identificati<strong>on</strong> keys, lake hydromorphological assessment, thedevelopment <strong>of</strong> a scoring system for assessing the quality <strong>of</strong> physical features inrivers and the quantificati<strong>on</strong> and use <strong>of</strong> performance characteristics in ecologicalassessment <strong>methods</strong>, am<strong>on</strong>gst many others that are, at the current time, given lowerpriority.D. Current c<strong>on</strong>tributi<strong>on</strong> to WFD intercalibrati<strong>on</strong>90. All <strong>of</strong> the recently published standards c<strong>on</strong>tribute to the intercalibrati<strong>on</strong> process,where the GIGs choose to use the same method <strong>of</strong> ecological assessment.91. Additi<strong>on</strong>ally, the advanced drafts available for several <strong>biological</strong> and ecologicalassessment <strong>methods</strong> could also support the process, particularly where these arepending formal vote for adopti<strong>on</strong> as EU standards. In formulating theirintercalibrati<strong>on</strong> strategies, the GIGs and ECOSTAT should c<strong>on</strong>sider not <strong>on</strong>ly the use<strong>of</strong> these standards for future data collecti<strong>on</strong>, but also advise WG 2 <strong>of</strong> priority gaps thatneed to be addressed in method standardizati<strong>on</strong>.E. Future liais<strong>on</strong> and involvement with ECOSTAT WG 2A92. CEN/TC 230/WG 2 states in its missi<strong>on</strong> statement that "it is committed to thedelivery <strong>of</strong> scientifically robust <strong>methods</strong> for <strong>biological</strong> and ecological assessment andclassificati<strong>on</strong> in support <strong>of</strong> European Uni<strong>on</strong> legislati<strong>on</strong> and sound science".93. The priority objectives <strong>of</strong> WG 2 are hence to:(i) examine the present state <strong>of</strong> standardizati<strong>on</strong> <strong>of</strong> <strong>biological</strong> and ecologicalassessment <strong>methods</strong>;(ii) advise CEN/TC 230, the Commissi<strong>on</strong>, its expert groups and its delegatedagencies <strong>of</strong> progress in, and barriers to, the standardizati<strong>on</strong> <strong>of</strong> <strong>biological</strong> andecological assessment <strong>methods</strong>;(iii)determine, evaluate and advise CEN and others <strong>of</strong> gaps in the availableresearch that need to be addressed prior to normalizati<strong>on</strong>;(iv) identify needs in the knowledge-base supporting European standardizati<strong>on</strong> andidentify and promote appropriate project proposals;23
(v) provide standards in a timely manner for EU needs and CEN priorities.94. Within this c<strong>on</strong>text there is c<strong>on</strong>siderable scope for ECOSTAT working group 2Ato identify future ecological standardizati<strong>on</strong> priorities specifically in mandated areassuch as the EU Eutrophicati<strong>on</strong> strategy.95. ECOSTAT supports the better resourcing <strong>of</strong> the standardizati<strong>on</strong> work in CEN inorder to deliver the outputs required to meet their specific needs and againsttimescales they foresee as being timely to the delivery <strong>of</strong> WFD.96. Following a meeting with DG Envir<strong>on</strong>ment preliminary discussi<strong>on</strong>s have takenplace in relati<strong>on</strong> to the mandating <strong>of</strong> specific standardisati<strong>on</strong> projects. ECOSTAT isinvited to c<strong>on</strong>tribute to this debate. Ultimately the standards produced should bereferred to the Article 21 committee for inclusi<strong>on</strong> in the WFD.Further informati<strong>on</strong> CEN can be obtained through the WEB site www.cenorm.be/bossor through the Secretariat <strong>of</strong> Working Group 2 at peter.hale @doeni.gov.ukEvaluati<strong>on</strong> <strong>of</strong> the usefulness <strong>of</strong> existing <strong>methods</strong> in relati<strong>on</strong> to theWFD97. In Annex VII is summarised the WFD ecological quality classificati<strong>on</strong>requirements, in particular for lakes and rivers.A. Lakes98. The intercalibrati<strong>on</strong> metadata questi<strong>on</strong>naire directly asked whether the siteselected was classified in compliance with the WFD, and most countries, 65% <strong>of</strong>those that submitted lakes, stated that the assessment was based <strong>on</strong> a n<strong>on</strong>-WFDcompatibleclassificati<strong>on</strong> system. The countries that c<strong>on</strong>sidered having classificati<strong>on</strong><strong>methods</strong> that were at least partially WFD compatible (e.g. not implemented nati<strong>on</strong>wide) are Est<strong>on</strong>ia, Germany, The Netherlands, Spain, Sweden and UK.99. However, the judgments <strong>of</strong> compatibility with the ecological classificati<strong>on</strong>requirements <strong>of</strong> the WFD were subjective and generally based <strong>on</strong> the nati<strong>on</strong>alinterpretati<strong>on</strong>s <strong>of</strong> the Directive; the numbers <strong>of</strong> n<strong>on</strong>-compatible classificati<strong>on</strong>s wouldprobably increase, if there was an agreement <strong>on</strong> the minimum requirements for aWFD compatible classificati<strong>on</strong>.24
100. The informati<strong>on</strong> received from the nati<strong>on</strong>al representatives in the ECOSTATWG2A <strong>on</strong> the state <strong>of</strong> compatibility <strong>of</strong> their nati<strong>on</strong>al classificati<strong>on</strong> <strong>methods</strong> with theWFD requirements can be summarized as follows (see also table in Annex VIII):• aquatic flora, Lithuania and Sweden are in the process <strong>of</strong> developing WFDcompatible classificati<strong>on</strong>s;• benthic invertebrates, UK method is declared to be WFD compatible;• phytoplankt<strong>on</strong>, Austria and Sweden have developed WFD compatibleclassificati<strong>on</strong>s but <strong>on</strong>ly for some lake types, while Latvia has now estimatedpreliminary reference c<strong>on</strong>diti<strong>on</strong>s for lakes in the country;• Fish, UK, as well as other countries, is <strong>on</strong> the way <strong>of</strong> developing a WFDcompatible classificati<strong>on</strong> method;• Macrophytes and phytobenthos, Germany has developed a classificati<strong>on</strong>method with these two elements that is c<strong>on</strong>sidered WFD compatible;• Aquatic plants and benthic invertebrates, UK has developed a classificati<strong>on</strong>method with these two elements that is c<strong>on</strong>sidered WFD compatible.B. Rivers101. In terms <strong>of</strong> metric requirements by the WFD, these are met for phytobenthosas all countries include in their <strong>methods</strong> a measurement <strong>of</strong> tax<strong>on</strong>omic compositi<strong>on</strong>and abundance. The overview shows, that at the moment, some countries aremodifying their own assessment <strong>methods</strong> for phytobenthos in order to fill the gaps(Austria, Germany and Spain) or have new <strong>methods</strong> under development that willinclude these requirements (Portugal). Norway and the Netherlands have assessment<strong>methods</strong> that respect the parameters to be measured for the WFD, but these are notrelated with reference c<strong>on</strong>diti<strong>on</strong>s.102. This is not the case for phytoplankt<strong>on</strong>, <strong>methods</strong> include tax<strong>on</strong>omiccompositi<strong>on</strong> and abundance, but no reference to recording <strong>of</strong> the plankt<strong>on</strong>ic bloomsthat is required by the Directive for this <strong>biological</strong> element. For phytoplankt<strong>on</strong>, n<strong>on</strong>e<strong>of</strong> the assessment <strong>methods</strong> are WFD compatible.25
103. For macrophytes <strong>on</strong>ly a few <strong>methods</strong> presented are WFD compliant. This isbecause the <strong>methods</strong> developed prior to the implementati<strong>on</strong> <strong>of</strong> the WFD are generallylacking in the definiti<strong>on</strong> <strong>of</strong> stream type-specific reference c<strong>on</strong>diti<strong>on</strong>s. This does nothold for schemes specifically designed for WFD m<strong>on</strong>itoring purposes (Austria,Germany, The Netherlands). Sweden and UK intend to implement a predictive habitatapproach (a RIVPACS-type system for aquatic plants) in the near future to modelmacrophyte reference communities.104. For benthic invertebrates, <strong>on</strong>ly a small number <strong>of</strong> <strong>methods</strong> included in thisoverview fulfill the WFD classificati<strong>on</strong> demands at least partially. In particular,recently developed <strong>methods</strong> <strong>of</strong> the categories predictive and multimetric assessment<strong>methods</strong> incude stream type-specific evaluati<strong>on</strong> based <strong>on</strong> reference c<strong>on</strong>diti<strong>on</strong>s. Somecountries have modified their traditi<strong>on</strong>al <strong>methods</strong> (e.g. Saprobic System) and/ orcombined them with new assessment <strong>methods</strong> (e.g. for morphological degradati<strong>on</strong>) tomeet the requirements <strong>of</strong> the WFD (Rolauffs et al., 2004). Furthermore, it is plannedto adjust the site-specific reference <strong>of</strong> the UK RIVPACS system by c<strong>on</strong>siderati<strong>on</strong> <strong>of</strong>stream morphology (Nix<strong>on</strong> et al., 1997).105. Integrated assessment <strong>of</strong> all indicative parameters <strong>of</strong> macrozoobenthoscommunities is d<strong>on</strong>e by multimetric indices. Besides the overall appraisal <strong>of</strong>ecological quality, their modular structure enables indicati<strong>on</strong> <strong>of</strong> the cause <strong>of</strong>degradati<strong>on</strong> by providing individual metric values. Full ecological evaluati<strong>on</strong>accounting for several biota is carried out by the ecosystem comp<strong>on</strong>ent’s assessmentsystems described above.106. More than 50 percent <strong>of</strong> the <strong>methods</strong> present results in five classes <strong>of</strong> quality.Some <strong>of</strong> these banding schemes represent recent amendments with respect to thedemands <strong>of</strong> the WFD. In this c<strong>on</strong>text it has to be noted that the numbering <strong>of</strong> qualityclasses is performed c<strong>on</strong>versely. Some schemes label the highest class with ‘1’ andincrement the number according to increasing deteriorati<strong>on</strong>. Other classificati<strong>on</strong>sdenote high quality levels with ‘5’ and count down. This anomaly has to bec<strong>on</strong>sidered and resolved in c<strong>on</strong>necti<strong>on</strong> with the exchange and comparis<strong>on</strong> <strong>of</strong> qualityresults derived by different <strong>methods</strong>.107. Another 12 percent <strong>of</strong> the <strong>methods</strong> use seven classes <strong>of</strong> water qualityoriginating from the classificati<strong>on</strong> <strong>of</strong> saprobity introduced by Liebmann (1962).26
Evaluati<strong>on</strong> <strong>of</strong> the suitability <strong>of</strong> current metrics as ‘comm<strong>on</strong> metrics’108. In Annex IX is summarised the comm<strong>on</strong> understanding <strong>of</strong> the WFDintercalibrati<strong>on</strong> process and the significance <strong>of</strong> comm<strong>on</strong> metric in this c<strong>on</strong>text.A. Lakes109. On the basis <strong>of</strong> the overview above <strong>of</strong> the assessment <strong>methods</strong> we c<strong>on</strong>cludethat it is currently not possible to identify a comm<strong>on</strong> metric satisfying therequirements for an intercalibrati<strong>on</strong> comm<strong>on</strong> metric. Independent <strong>of</strong> the <strong>biological</strong>element measured, sampling and assessment <strong>methods</strong> (metrics and classificati<strong>on</strong> arenot shared by the countries in a GIG. Also, there are few <strong>methods</strong> that are incompliance with the WFD. This informati<strong>on</strong> would have to be collated in order topossible identify Intercalibrati<strong>on</strong> comm<strong>on</strong> metrics.B. Rivers110. The situati<strong>on</strong> that applies to lakes also holds for the river phytoplankt<strong>on</strong>,phytobenthos and macrophytes. At the time the informati<strong>on</strong> for this report wasgathered Member States were developing WFD compatible <strong>methods</strong> and thus with thecurrent informati<strong>on</strong> it is not possible to identify comm<strong>on</strong> metrics for this elements.111. The overview above <strong>of</strong> the benthic invertebrate assessment <strong>methods</strong> can showwhich metrics are most comm<strong>on</strong>ly used to evaluate the quality <strong>of</strong> running waters inEurope. These metrics are likely to meet the above specified requirements since equalpremises have to be fulfilled in different countries (e.g. level <strong>of</strong> determinati<strong>on</strong>, record<strong>of</strong> abundance etc.) to calculate the metric results.112. In 15 countries saprobic indices for water quality classificati<strong>on</strong> are in usage.Despite <strong>of</strong> many country-specific modificati<strong>on</strong>s the efforts made towards harm<strong>on</strong>isedapplicati<strong>on</strong> <strong>of</strong> the saprobic system in the Danube River Basin (Knoben et al., 1999;Sommerhäuser et al., 2004) are promising. Cyprus, Est<strong>on</strong>ia, Hungary, Poland,Portugal, Sweden, Spain and United Kingdom use the BMWP score or BMWP-ASPTIndex in water quality assessment. The indicator list <strong>of</strong> this metric operating at familylevelhas been modified by Hungary, Poland, Portugal and Spain. Based <strong>on</strong> theoriginal table BMWP scores are part <strong>of</strong> multimetric indices <strong>of</strong> the AQEM systems inthe Czech Republic, Germany, Greece, Italy and Sweden.27
113. Further analysis <strong>of</strong> the metrics or metric groups integrated in the variousAQEM multimetric indices reveals comm<strong>on</strong> use <strong>of</strong> metrics listed in Table 3.Table 3. Metrics/metric groups most comm<strong>on</strong>ly used by the different AQEM systems(AQEM C<strong>on</strong>sortium, 2002).metric/metric groupsnumber <strong>of</strong> stream typeswhere metric/metric group is appliedfeeding types (scrapers, shredders, predators, …) 11z<strong>on</strong>ati<strong>on</strong> preference (crenal, rhithral, potamal, …) 10number <strong>of</strong> Ephemeroptera, Plecoptera, Trichoptera taxa 10individuals <strong>of</strong> certain tax<strong>on</strong>omic groups 10number <strong>of</strong> taxa in individual tax<strong>on</strong>omic groups 6microhabitat preference (pelal, argyllal, psammal, akal, …) 6saprobic index (Zelinka and Marvan) 6114. About Fish metrics, an extensive list <strong>of</strong> metrics from IBI index, was presentedto be tested <strong>on</strong> the FAME project. (Kestem<strong>on</strong>t, P. and G<strong>of</strong>faux, D., 2002). Themetrics are not distributed am<strong>on</strong>g the four categories <strong>of</strong> the original IBI, but classifiedwithin the 3 major categories <strong>of</strong> the WFD, i.e. species compositi<strong>on</strong> (including metricsrelated to trophic compositi<strong>on</strong>, reproducti<strong>on</strong> and c<strong>on</strong>diti<strong>on</strong>), fish abundance and agelengthstructure.C<strong>on</strong>cluding remarks and recommendati<strong>on</strong>s115. This review <strong>of</strong> the harm<strong>on</strong>izati<strong>on</strong> <strong>of</strong> <strong>biological</strong> m<strong>on</strong>itoring systems is based <strong>on</strong>data gathered and collated over the drafting period. Many <strong>of</strong> the outcomes reportedc<strong>on</strong>tinue to be valid but others have been and will c<strong>on</strong>tinue to be influenced byscientific developments supporting the implementati<strong>on</strong> <strong>of</strong> the WFD. These include theoutcomes <strong>of</strong> nati<strong>on</strong>al and European research programmes, the finalisati<strong>on</strong> <strong>of</strong> relevantCEN standards and the trialing <strong>of</strong> recently developed or modified ecologicalassessment methodologies at the nati<strong>on</strong>al level. Further, as the intercalibrati<strong>on</strong> processprogresses within the GIGs, new approaches and the possible need for <strong>methods</strong>tandardizati<strong>on</strong> will be identified.116. In order to ensure that these rapid developments are taken into account, whichwill aid the WFD implementati<strong>on</strong> process it is recommended that the harm<strong>on</strong>izati<strong>on</strong>28
group should update its primary findings <strong>on</strong> an annual basis. The outcome wouldinform ECOSTAT, the Commissi<strong>on</strong> and other partners as to the state-<strong>of</strong>-the-art, aswell as dem<strong>on</strong>strating progress and identifying gaps that need to be filled by targetedresearch at a European level. (RECOMMENDATION 1)117. This review clearly dem<strong>on</strong>strates that at present, lakes and rivers <strong>biological</strong>m<strong>on</strong>itoring systems in Europe differ widely in terms <strong>of</strong> the <strong>biological</strong> elementssampled, sampling <strong>methods</strong>, metrics and classificati<strong>on</strong> schemes adopted. Thesedifferences probably reflect varying m<strong>on</strong>itoring objectives, the pressures impacting <strong>on</strong>the water bodies and technical, ec<strong>on</strong>omic and cultural features <strong>of</strong> each country. Theyare not <strong>on</strong>ly obvious at the nati<strong>on</strong>al level, but also within some countries.118. It is, however, possible to find European wide a comm<strong>on</strong> pattern. For mostlakes, quality assessment includes chlorophyll a and phytoplankt<strong>on</strong> m<strong>on</strong>itoring andfor most rivers, quality assessment includes benthic invertebrates m<strong>on</strong>itoring. This isnot to say that the <strong>methods</strong> are identical, as in many instances this is clearly not thecase, and direct comparis<strong>on</strong>s <strong>of</strong> data using differing sampling and analytical regimesmay be problematical. The work within the GIGs will inform this process119. It is also clear from this review <strong>of</strong> harm<strong>on</strong>izati<strong>on</strong> that many countries have yetto develop m<strong>on</strong>itoring and classificati<strong>on</strong> programmes that are WFD compliant,although it is clear that progress c<strong>on</strong>tinues to be made through nati<strong>on</strong>al and Europeanresearch and development programmes. In order to manage the implementati<strong>on</strong>process it is essential to collate this informati<strong>on</strong> and make it widely available. TheHarm<strong>on</strong>isati<strong>on</strong> Group could be central to this process (RECOMMENDATION 2)120. The report show that the development many <strong>methods</strong> are still need or areunderway at the moment. For this reas<strong>on</strong> it is too early to demand the standardizati<strong>on</strong><strong>of</strong> special metrics. In this respect ECOSTAT should liaise closely with the work <strong>of</strong>CEN, with the Harm<strong>on</strong>isati<strong>on</strong> Group representing the obvious focal point(RECOMMENDATION 3).121. The previous recommendati<strong>on</strong> should be facilitated through a workshopinvolving the CEN task group c<strong>on</strong>venors, the Harm<strong>on</strong>isati<strong>on</strong> Group and otheridentified ECOSTAT members. This could be facilitated by JRC.29
122. It is acknowledged that standardisati<strong>on</strong> <strong>of</strong> WFD <strong>methods</strong> within CEN isresource limited. Where ECOSTAT and the GIGs identify priority work for CEN, itwould seek a mandate for this work through the representatives <strong>of</strong> DG Envir<strong>on</strong>ment(RECOMMENDATION 4)123. Proposed and completed research in support <strong>of</strong> WFD has the str<strong>on</strong>g potentialnow, and in the future, to encourage a wider level <strong>of</strong> method development andstandardisati<strong>on</strong> than currently exists. ECOSTAT needs to take a lead in value addingto the outputs in terms <strong>of</strong> finalizati<strong>on</strong> <strong>of</strong> ecological <strong>methods</strong>. The Harm<strong>on</strong>isati<strong>on</strong>Group could lead in this area (RECOMMENDATION 5)RECOMMENDATIONSI. The harm<strong>on</strong>izati<strong>on</strong> group should c<strong>on</strong>tinue to m<strong>on</strong>itor the development <strong>of</strong>WFD compliant methodologies for ecological assessment and classificati<strong>on</strong>and report to ECOSTAT regularly.II. The harm<strong>on</strong>izati<strong>on</strong> group should assume resp<strong>on</strong>sibility for collatingscientific developments relevant to the WFD and ensuring that these are madewidely available through the internet.III. Methods and metrics which are used in a wide geographical scale andhave the potential for standardizati<strong>on</strong> should be identified by ECOSTAT andthe GIGs as a basis for priority areas for technical standardizati<strong>on</strong>. This couldbe managed by the ECOSTAT WG in c<strong>on</strong>tact with CEN. A start-up workshopcould be facilitated by the JRC.IV. The harm<strong>on</strong>isati<strong>on</strong> group would take the lead in establishing priority areasfor standardizati<strong>on</strong> within CEN and through ECOSTAT recommend areas <strong>of</strong>work requiring a mandate from DG Envir<strong>on</strong>ment.V. The Harm<strong>on</strong>isati<strong>on</strong> Group <strong>on</strong> behalf <strong>of</strong> ECOSTAT could identify areas <strong>of</strong>ecological research relevant to the implementati<strong>on</strong> <strong>of</strong> the WFD and ensuredisseminati<strong>on</strong>.30
ReferencesAFNOR (Associati<strong>on</strong> Française de Normalisati<strong>on</strong>) 1992. Essais des eaux. Déterminati<strong>on</strong> de l'indicebiologique global normalisé (IBGN). NF T 90-350.AFNOR, (Associati<strong>on</strong> Française de Normalisati<strong>on</strong>) 2000. Norme française NF T 90-354. Qualité del’eau. Déterminati<strong>on</strong> de l’Indice Biologique Diatomées (IBD), Paris, 63 pp.AFNOR (Associati<strong>on</strong> Française de Normalisati<strong>on</strong>) 2002. Déterminati<strong>on</strong> de l’indice oligochètes debioindicati<strong>on</strong> des sédimentes (IOBS). NF T 90-390.Alba-Tercedor, J. and A.M. Pujante, 2000. Running-water biom<strong>on</strong>itoring in Spain: opportunities for apredictive approach. In: Wright, J.F., Sutcliffe, D.W. & M.T. Furse (eds.) Assessing the <strong>biological</strong>quality <strong>of</strong> fresh waters-RIVPACS and other techniques. Ambleside (FBA).Appelberg, M., 2000. Swedish standard <strong>methods</strong> for sampling <strong>freshwater</strong> fish with multi-mesh gillnets.Fiskeriverket informerar 2000:1AQEM C<strong>on</strong>sortium 2002. Manual for the applicati<strong>on</strong> <strong>of</strong> the AQEM system. A comprehensive methodto assess European streams using benthic macroinvertebrates, developed for the purpose <strong>of</strong> the WaterFramework Directive. Versi<strong>on</strong> 1.0.Armitage, P.D., Moss, D., Wright, J. and M.T. Furse, 1983. The performance <strong>of</strong> a new <strong>biological</strong> waterquality score system based <strong>on</strong> macroinvertebrates over a wide range <strong>of</strong> unpolluted running-watersites. Water Research 17: 333-347.Barbour, M.T., J.L. Plafkin, B.P. Bradley, C.G. Graves and R.W. Wisseman, 1992. Evaluati<strong>on</strong> <strong>of</strong>EPA’s rapid bioassessment benthic metrics: metric redundancy and variability am<strong>on</strong>g referencestream sites. Envir. Toxicol. Chem. 11: 437-449.Barbour, M.T., J. Gerritsen, B.D. Snyder, and J.B. Stribling, 1999. Rapid Bioassessment Protocols forUse in Streams and Wadeable Rivers: Periphyt<strong>on</strong>, Benthic Macroinvertebrates and Fish, Sec<strong>on</strong>dEditi<strong>on</strong>. EPA 841-B-99-002. U.S. Envir<strong>on</strong>mental Protecti<strong>on</strong> Agency; Office <strong>of</strong> Water; Washingt<strong>on</strong>,D.C.Belpaire, C., R. Smolders, I. Vanden Auweele, D. Ercken, J. Breine, G. Van Thuyne and F. Ollevier,2000. An index <strong>of</strong> biotic integrity characterizing fish populati<strong>on</strong>s and the ecological quality <strong>of</strong>Flandrian water bodies. Hydrobiologia 434: 17-33.Birk, S., 2003 Überblick über die Methoden zur Fliessgewässerbewertung in Europa. DGLTagungsbericht 2002 (Braunschweig).Birk, S. and U. Schmedtje (in print). Towards harm<strong>on</strong>isati<strong>on</strong> <strong>of</strong> water quality classificati<strong>on</strong> in theDanube River Basin: Overview <strong>of</strong> <strong>biological</strong> assessment <strong>methods</strong> for running waters. Large Rivers.Bo<strong>on</strong>, P.J., N.T.H Holmes, P.S.Maitland, T.A. Rowell and J. Davies, 1997. A System for EvaluatingRivers for C<strong>on</strong>servati<strong>on</strong> (SERCON Development, Structure and Functi<strong>on</strong>. In: Bo<strong>on</strong>, P.J. (ed.Freshwater quality - defining the indefinable? The Stati<strong>on</strong>ery Office, Edinburgh: 299-326.Bourelly, P., 1981. Les algues d’eau douce. Tome II. Algues jaunes et brunes. Boubee Ed. & Cie Paris517pp.Brabec, K., S. Zahrádková, D. Nemejcová, P. Paril, J. Kokeš and J. Jarkovský, 2004. Assessment <strong>of</strong>organic polluti<strong>on</strong> effect c<strong>on</strong>sidering differences between lotic and lentic stream habitats.Hydrobiologia 516: 331-346.Braukmann, U. and R. Biss, 2004. Biologische Indikati<strong>on</strong> des Säuregrades in Fließgewässern anhanddes Makrozoobenthos, Limnologica 34 (4): 433-450.Braun-Blanquet, J., 1964. Pflanzensoziologie. Grundzuge der Vegetati<strong>on</strong>skunde. Springer. Wien-NewYork.Buffagni, A., 1997. Mayfly community compositi<strong>on</strong> and the <strong>biological</strong> quality <strong>of</strong> streams. In: Landolt,P. & M. Sartori (eds.) Ephemeroptera & Plecoptera: Biology-Ecology-Systematics. MTL, Fribourg:235-246.31
Buffagni, A. and S. Erba, 2004. A simple procedure to harm<strong>on</strong>ize class boundaries <strong>of</strong> Europeanassessment systems. Discussi<strong>on</strong> paper for the Intercalibrati<strong>on</strong> process – WFD CIS WG 2.AECOSTAT. February, 6 th 2004.Capra, H., 1995. Améliorati<strong>on</strong> des modèles prédictifs d’habitat de la truite fario : échellesd’échantill<strong>on</strong>nage, intégrati<strong>on</strong> des chr<strong>on</strong>iques hydrologiques. Ph.D. thesis, University <strong>of</strong> Ly<strong>on</strong> I,Villeurbanne, France. 268 p.Cairns, J.Jr., D.W. Albough, F. Susey and M.D.Charry, 1968. The sequential comparis<strong>on</strong> index - asimplified method for n<strong>on</strong>-biologists to estimate relative differences in <strong>biological</strong> diversity in streampolluti<strong>on</strong> studies. J.Water Poll. C<strong>on</strong>trl.Fed. 40: 1607-1613.CEMAGREF, 1982. Etude des méthodes biologiques d'appréciati<strong>on</strong> quantitative de la qualité des eaux.Rapport Q.E. Ly<strong>on</strong> A.F. Bassin Rhône-Méditérannée-Corse, 218p.Cimdins, P., I. Druvietis, R. Liepa, E. Parele, L. Urtane and A. Urtans, 1995. A Latvian catalogue <strong>of</strong>indicator species <strong>of</strong> <strong>freshwater</strong> saprobity. Proceedings <strong>of</strong> the Latvian Academy <strong>of</strong> Sciences570/571(1/2 122-133.SN 75 7716:1998. Water quality, <strong>biological</strong> analysis, determinati<strong>on</strong> <strong>of</strong> saprobic index. CzechTechnical State Standard, Czech Standards Institute, Prague.De Pauw, N. and H. Vanhooren, 1983. Method for <strong>biological</strong> quality assessment <strong>of</strong> water courses inBelgium. Hydrobiologia 100: 153-168.De Pauw, N. and S. Heylen, 2001. Biotic index for sediment quality assessment <strong>of</strong> watercourses inFlanders, Belgium. Aquatic Ecology 35: 121-133.Didier, J., 1997. Indice biotique d’intégrité piscicole pour évaluer la qualité écologique desécosystèmes lotiques. PhD thesis, Presses Universitaires de Namur, Belgium, 313 p.DIN 38 410:1990. Deutsche Einheitsverfahren zur Wasser-, Abwasser- und Schlammuntersuchung -Biologisch-ökologische Gewässeruntersuchung (Gruppe M) - Bestimmung des Saprobienindex (M2). Deutsches Institut für Normung, Berlin.DIN 38 410:2003. Deutsche Einheitsverfahren zur Wasser-, Abwasser- und Schlammuntersuchung -Biologisch-ökologische Gewässeruntersuchung (Gruppe M) - Teil 1: Bestimmung desSaprobienindex in Fließgewässern (M 1). Normentwurf, Deutsches Institut für Normung, Berlin.Dussling, U., H. Klinger, C. Wolter and R. Berg, 2004. Assessing the Ecological Status <strong>of</strong> RiverSystems Using Fish Assemblages, pp 1 - 84 - In: Steinberg et al (eds.) Handbuch angew.Limnologie, Ecomed, Landsberg.EN 25667-1 Water quality –Sampling- Part 1: Guidance <strong>on</strong> the design <strong>of</strong> sampling programmes (ISO5667-1:1980)EN 25667-2 Water quality – Sampling – Part 2: Guidance <strong>on</strong> sampling techniques (ISO 5667-2:1991)EN 27828 Water quality – Methods <strong>of</strong> <strong>biological</strong> sampling - Guidance <strong>on</strong> handnet sampling <strong>of</strong> aquaticbenthic macro-invertebrates (ISO 7828:1985)EN 28265 Water quality – Methods <strong>of</strong> <strong>biological</strong> sampling – Guidance <strong>on</strong> the design and use <strong>of</strong>quantitative samplers for benthic macro-invertebrates <strong>on</strong> st<strong>on</strong>y substrata in shallow <strong>freshwater</strong>s (ISO8265:1988)EN ISO 5667-3 Water quality – Sampling guidance <strong>on</strong> the preservati<strong>on</strong> and handling <strong>of</strong> samples (ISO5667-3:1994)EN ISO 9391 Water Quality – Sampling in deep waters for macro-invertebrates – Guidance <strong>on</strong> the use<strong>of</strong> col<strong>on</strong>izati<strong>on</strong>, qualitative and quantitative samples (ISO 9391:1993)EN ISO 5667-16 Water quality – Sampling – Part 16: Guidance <strong>on</strong> biotesting <strong>of</strong> samples (ISO 5667-16:1998)EN ISO 8689-1 Water quality – Biological classificati<strong>on</strong> <strong>of</strong> rivers – Part 1: Guidance <strong>on</strong> theinterpretati<strong>on</strong> <strong>of</strong> <strong>biological</strong> quality data from surveys <strong>of</strong> benthic macro-invertebrates in runningwaters (ISO 8689-1:2000)32
EN ISO 8689-2 Water quality – Biological classificati<strong>on</strong> <strong>of</strong> rivers – Part 2: Guidance <strong>on</strong> thepresentati<strong>on</strong> <strong>of</strong> <strong>biological</strong> quality data from surveys <strong>of</strong> benthic macro-invertebrates (ISO 8689-1:2000)EN 14184 Water quality – Guidance standard for the surveying <strong>of</strong> aquatic macrophytes in runningwatersEN 13946 Water Quality – Guidance standard for the routine sampling and pre-treatment <strong>of</strong> benthicdiatoms from riversEN 14011 Water analysis – Sampling <strong>of</strong> fish with electricityEN 14407 Water quality – Guidance standard for the identificati<strong>on</strong>, enumerati<strong>on</strong> and interpretati<strong>on</strong> <strong>of</strong>benthic diatom samples from running watersEN 14614 Water quality – Guidace standard for assessing the hydromorlogical features <strong>of</strong> riversEngel, S., and S. A. Nichols, 1994. Aquatic macrophyte growth in a turbid windswept lake. JFreshwater Ecology 9(2) 97-110.Envir<strong>on</strong>ment Agency 1996 The quality <strong>of</strong> rivers and canals in England and Wales (1990 to 1995).Envir<strong>on</strong>ment Agency, Bristol.European Communities, 2003d. WFD CIS Guidance Document No. 10. Rivers and lakes – Typology,reference c<strong>on</strong>diti<strong>on</strong>s and classificati<strong>on</strong> systems. Produced by Working Group 2.3 - REFCOND.http://forum.europa.eu.int/Public/irc/env/wfd/libraryEuropean Communities 2004. Comm<strong>on</strong> Implementati<strong>on</strong> Strategy for the Water Framework Directive(2000/60/EC). Overall Approach to the Classificati<strong>on</strong> <strong>of</strong> Ecological Status and Ecological Potential.Extence, C.A., D.M. Balbi and R.P. Chadd, 1999. River flow indexing using British benthicmacroinvertebrates : a framework for setting hydroecological objectives. Regulated Rivers: Researchand Management 15: 543-574.Gassner, H. and J. Wanzenböck, 1999: Fischökologische Leitbilder fünf ausgewählterSalzkammergutseen. Limnologica 29, 436-448Ghetti, P.F., 1997. Manuale di applicazi<strong>on</strong>e Indice Biotico Esteso (I.B.E.). I macroinvertebratinell'c<strong>on</strong>trollo della qualità degli ambienti di aque correnti. - Provincia Aut<strong>on</strong>oma di Trento, Agenziaprovinciale per la protezi<strong>on</strong>e dell’ambienti.Golterman, H. L., R.S. Clymo and M.A.M. Ohnstand, 1978. Methods for physical & chemical analysis<strong>of</strong> fresh waters. Blackwell Sci. Publ., L<strong>on</strong>d<strong>on</strong>, 213p.Grbovi, J., 1999. Water quality m<strong>on</strong>itoring in Slovenia. In: Deutsche Gesellschaft für Limnologie(DGL) Tagungsbericht 1998. Band II. DGL, Tutzing: 517-520.Heiskanen, A.-S, W.J. van de Bund, A.C. Cardoso and P. Nõges, 2004. Towards good ecological status<strong>of</strong> surface waters in Europe – Interpretati<strong>on</strong> and harm<strong>on</strong>isati<strong>on</strong> <strong>of</strong> the c<strong>on</strong>cept”. Water Science andTechnology 49 (7) 169-177.Hering, D., O. Moog, L. Sandin and P.F.M. Verd<strong>on</strong>schot, 2004. Overview and applicati<strong>on</strong> <strong>of</strong> theAQEM assessment system. Hydrobiologia 516: 1-20.HMSO 1980. See http://www.opsi.gov.uk/about/hmso.htmH<strong>of</strong>mann, G., 1994. Aufwuchs-Diatomeen in Seen und ihre Eignung als Indikatoren der Trophie.Bbliotheca Diatomologica, 30. J. Cramer, Berlin, 241 pp.Holmes, N.T.H., J.R. Newman, S. Chadd, K.J. Rouen, L. Saint and F.H. Daws<strong>on</strong>, 1999. Mean TrophicRank: A User's Manual. R & D Technical <str<strong>on</strong>g>Report</str<strong>on</strong>g> E38. Bristol. Envir<strong>on</strong>ment Agency.Jäger, P, K. Pall and E. Dunfarth, 2002. Zur Methodik der Makrophytenkartierung in großen Seen.Österr. Fischerei 55: 230-238.Jager, P., K. Pall and E. Dumfarth, 2004. A method <strong>of</strong> mapping macrophytes in large lakes with regardto the requirements <strong>of</strong> the Water Framework Directive. Limnologica 2004, Heft 34, S. 140-146.Jeffrey, S.W. and G.F Humphrey, 1975. New Spectrophotometric equati<strong>on</strong>s for determiningchlorophylls a, b, c1 and c2 in higher plants, algae, and natural phytoplankt<strong>on</strong>. Biochem. Physiol.Pflanz. 167: 191-194.33
Jensen, S., 1977. An objective method for sampling the macrophyte vegetati<strong>on</strong> in lakes. Vegetatio 33,107-118.Johns<strong>on</strong>, R. K., 1995. The indicator c<strong>on</strong>cept in <strong>freshwater</strong> biom<strong>on</strong>itoring. In: Cranst<strong>on</strong>, P. (ed.)Chir<strong>on</strong>omids - from genes to ecosystems. CSIRO, Canberra: 11-26.Just, I., F. Schöll and T. Tittizer, 1998. Versuch einer Harm<strong>on</strong>isierung nati<strong>on</strong>aler Methoden zurBewertung der Gewässergüte im D<strong>on</strong>auraum am Beispiel der Abwässer der Stadt Budapest. UBA-Texte 53-98. UBA, Berlin.Karr, J.R.,1981. Assessment <strong>of</strong> biotic integrity using fish communities. Fisheries, 6, 21-27.Karr, J.R. and E.W. Chu, 1999. Restoring life in running waters: better <strong>biological</strong> m<strong>on</strong>itoring. IslandPress, Washingt<strong>on</strong>, DC, USA.Karttunen, K. and H. Toiv<strong>on</strong>en., 1995: Ecology <strong>of</strong> aquatic bryophyte assemblages in 54 small lakes,and their changes in 30 years. -Ann. Bot. Fennici 32:75-90Kelly, M.G. and B.A. Whitt<strong>on</strong>,. 1995. Use <strong>of</strong> diatoms to m<strong>on</strong>itor nutrients. NRA R&D Note 431.Bristol (Nati<strong>on</strong>al Rivers Authority).Kelly, M.G., A. Cazaub<strong>on</strong>, E. Coring, A. Dell’Uomo, L. Ector, B. Goldsmith, H. Guasch, J.Hürlimann, A. Jarlman, B. Kawecka, J. Kwandrans, R. Laugaste, E.-A. Lindstrom, M. Leitao, P.Marvan, J. Padisak, E. Pipp, J. Prygiel, E. Rott, S. Sabater, H. Van Dam and J. Vizinet, 1998.Recommendati<strong>on</strong>s for the routine sampling <strong>of</strong> diatoms for water quality assessments in Europe.Journal <strong>of</strong> Applied Phycology, 10: 215-224.Kesminas, V. and T. Virbickas, 2000. Applicati<strong>on</strong> <strong>of</strong> an adapted index <strong>of</strong> biotic integrity to rivers <strong>of</strong>Lithuania. Hydrobiologia 422/423: 257-270Kestem<strong>on</strong>t, P., J. Didier, E. Depiereux and J.C. Micha, 2000. Selecting ichtyological metrics to assessriver basin ecological quality. Arch. Hydrobiol.: 121, 321-348.Kestem<strong>on</strong>t, P. and D. G<strong>of</strong>faux, 2002. Metric Selecti<strong>on</strong> and Sampling Procedures for FAME (D 4 - 6),85 pp. http://fame.boku.ac.at/Kohler, A., 1978. Methoden der Kartierung v<strong>on</strong> Flora und Vegetati<strong>on</strong> v<strong>on</strong> Süßwasserbiotopen –Landschaft und Stadt 10: 73 –85.Kokeš, J., S. Zahrádková, J. Hodovský and D. Nmejcová, 2003. Predikní systém PERLA (Predicti<strong>on</strong>system PERLA). In: Bitušík, P. & M. Novikmec (eds ) Proc. 13th C<strong>on</strong>ference <strong>of</strong> Slovak Limnol.Soc. and Czech Limnol. Soc., Banská Štiavnica, June 2003. Acta Facultatis Ecologiae 10, Suppl. 1:239–242.Kolkwitz, R. and M. Marss<strong>on</strong>, 1902: Grundsätze für die biologische Beurteilung des Wassers nachseiner Flora und Fauna. Mitt. aus d. Kgl. Prüfungsanstalt für Wasserversorgung u.Abwasserbeseitigung Berlin 1: 33-72.Kolkwitz, R. and M. Marss<strong>on</strong>, 1908. Ökologie der pflanzlichen Saprobien. Ber. Dt. Botan. Ges. 26a:505-519.Kolkwitz, R. and M. Marss<strong>on</strong>, 1909: Ökologie der tierischen Saprobien. Int. Revue ges. Hydrobiol. 2:126-152.Knöpp, M., 1955. Grundsätzliches zur Frage biologischer Vorfluteruntersuchungen, erläutert an einemGütelängsschnitt des Mains. Archiv für Hydrobiologie Supplement 22: 363-368.Knoben, R.A.E., C. Roos and M.C.M. Van Oirschot, 1995. Biological assessment <strong>methods</strong> forwatercourses. UN/ECE Task Force <strong>on</strong> M<strong>on</strong>itoring and Assessment (working program 1994/1995).RIZA, Lelystad.Knoben, R.A.E, L. Bijlmakers and P. van Meenen, 1999. Classificati<strong>on</strong>/characterisati<strong>on</strong> <strong>of</strong> waterquality, Water Quality Enhancement in the Danube River Basin, Phare C<strong>on</strong>tract No. 98-0399.00.IWACO, Brussels.Kudelska D., H. Soszka and D.Cydzik, 1997. In Bo<strong>on</strong> and Howell (eds.) Freshwater Quality: Definingthe Indefinable. The Stati<strong>on</strong>ery Office, Edinburgh: 149-154Latvian Standard LVS 240:1999 Operative Evaluati<strong>on</strong> <strong>of</strong> the Biological Quality <strong>of</strong> Small Streams bySaprobic Index <strong>of</strong> Macrozoobenthos Communities.34
Lazaridou-Dimitriadou, M., C. Koukoumides, E. Lekka and G. Gaidagis, 2004. Integrative evaluati<strong>on</strong><strong>of</strong> the ecological quality <strong>of</strong> metalliferous streams (Chalkidiki, Maced<strong>on</strong>ia, Hellas). Envir<strong>on</strong>mentalM<strong>on</strong>itoring and Assessment 91: 59-86.Lecointe, C., M. Coste and J. Prygiel, 1993. “OMNIDIA” s<strong>of</strong>tware for tax<strong>on</strong>omy, calculati<strong>on</strong> <strong>of</strong> diatomindices and inventories management. Hydrobiologia, 269/70: 509-513.Liebmann, H., 1962. Handbuch der Frischwasser- und Abwasserbiologie. Biologie des Trinkwassers,Badewassers, Fischwassers, Vorfluters und Abwassers. Band I. Oldenbourg, München.Lodi, E. and G. Badino, 1993. Classificazi<strong>on</strong>e delle acque fluviali (z<strong>on</strong>a dei cipriniformi) mediantel’Indice Ittico. Atti Accademia Scienze Torino 125 (5-6 192-203.Lorenzen, C.F., 1967. Determinati<strong>on</strong> <strong>of</strong> chlorophyll and phaeopigments:. Spectrophotometricequati<strong>on</strong>s, Limnol. Oceanogr., 12, 343–346.Marcoci, I.,. 1984. Analiza biologica a apelor (<strong>biological</strong> analysis <strong>of</strong> waters). Romanian Academy,Bucharest. (in Romanian)McGarrigle, M.L., Lucey, J. and K.C. Clabby, 1992. Biological assessment <strong>of</strong> river water quality inIreland. In: Newman, P.J., Piavaux, M.A. & R.A. Sweeting (eds. River Water Quality. EcologicalAssessment and C<strong>on</strong>trol. Brussels (Commissi<strong>on</strong> <strong>of</strong> the European Community 371-385.Marker, A.F.H., 1972. The use <strong>of</strong> acet<strong>on</strong>e and methanol in the estimati<strong>on</strong> <strong>of</strong> chlorophyll in the presence<strong>of</strong> phaeophytin. Freshwat. Biol., 2: 361-385.Meier, C., D. Hering, R. Biss, J. Böhmer, C. Rawer-Jost, P. Haase and F. Schöll (in print)Weiterentwicklung und Anpassung des nati<strong>on</strong>alen Bewertungssystems für Makrozoobenthos an neueinternati<strong>on</strong>ale Vorgaben, UBA-Texte. UBA, Berlin.Melzer, A., R. Harlacher, K. Held, R. Sirch and E. Vogt, 1986. Die Makrophytenvetetati<strong>on</strong> desChiemsees. Informati<strong>on</strong>sbericht Bayer. Landesamt für Wasserwirtschaft 4/86: 210 pp.Minns, C. K., Cairns, V. W. Randall R. G. and J. M. Moore, 1994. An index <strong>of</strong> biotic integrity (IBI) forfish assemblages in the littoral z<strong>on</strong>e <strong>of</strong> Great Lakes' areas <strong>of</strong> c<strong>on</strong>cern. Can J. Fish. Aquat. Sci. 51:1804-1822.Moog, O., A. Chovanec, J. Hinteregger and A. Römer, 1999. Richtlinie zur Bestimmung dersaprobiologischen Gewässergüte v<strong>on</strong> Fliessgewässern. Bundesministerium für Land- undForstwirtschaft, Wien.Molen, D.T., M. van der Beers, M.S van den Berg, T. van den Broek, R.Buskens, H.C. Coops, H. vanDam, G. Duursema, M. Fagel, T. Ietswaart, M. Klinge, R.A.E. Knoben, J. Kranenbarg, J. de Leeuw,R. Noordhuis, R.C. Nijboer, R. Pot, P.F.M. Verd<strong>on</strong>schot and T. Vriese, 2004. Referenties enmaatlatten voor rivieren ten behoeve van de Kaderrichtlijn Water - versi<strong>on</strong> July 2004. Alterra,Wageningen.Murray-Bligh, J.A.D., 1999. Procedures for collecting and analysing macro-invertebrate samples.Quality Management Systems for Envir<strong>on</strong>mental m<strong>on</strong>itoring: Biological Techniques, BT001.(Versi<strong>on</strong> 2.0, 30 July 1999). Envir<strong>on</strong>ment Agency, Bristol.Nix<strong>on</strong>, S., L. Laff<strong>on</strong>, and I.D. Codling, 1997. Ecological quality <strong>of</strong> fresh surface waters in Europe:research needs scooping study. <str<strong>on</strong>g>Report</str<strong>on</strong>g> No. CO 4353. Envir<strong>on</strong>ment Agency, Bristol.Nutsch, E. A., 1980. Comparis<strong>on</strong> <strong>on</strong> different <strong>methods</strong> for chlorophyll and phaeopigmentdeterminati<strong>on</strong>. Arch. Hydrobiol. Beih. Ergebn. Limnol. 14: 14 - 30.Oberdorff, T. and R.M. Hughes, 1992. Modificati<strong>on</strong> <strong>of</strong> an index <strong>of</strong> biotic integrity based <strong>on</strong> fishassemblages to characterise rivers <strong>of</strong> the Seine Basin, France. Hydrobiologia 228: 117-130.Oberdorff, T., D. P<strong>on</strong>t, B. Hugueny and D. Chessel, 2001. A probabilistic model characterizing fishassemblages <strong>of</strong> French rivers: a framework for envir<strong>on</strong>mental assessment. Freshwater Biology, 46,399-415.Oberdorff, T., D. P<strong>on</strong>t, B. Hugueny and J.P. Porcher, 2002. Development and validati<strong>on</strong> <strong>of</strong> a fish-basedindex for the assessment <strong>of</strong> ‘river health’ in France Freshwater Biology. vol. 47, no. 9, pp. 1720-173435
OECD (Organisati<strong>on</strong> de Coopérati<strong>on</strong> et de Développement Ec<strong>on</strong>omiques), 1982. Eutrophisati<strong>on</strong> deseaux. Méthodes de surveillance, d'evaluati<strong>on</strong> et de lutte. Organisati<strong>on</strong> de Coopérati<strong>on</strong> et deDéveloppement Ec<strong>on</strong>omiques, Paris.Ofenböck, T., O. Moog, J. Gerritsen, and M. Barbour, 2004. A stressor specific multimetric approachfor m<strong>on</strong>itoring running waters in Austria using benthic macro-invertebrates. Hydrobiologia 516: 251-268.Pantle, R. and H. Buck 1955. Die biologische Überwachung der Gewässer und die Darstellung derErgebnisse. Gas- und Wasserfach 96: 604.Pars<strong>on</strong>s, T.R. and J.D.H. Strickland, 1965. Particulate organic matter. III. I. Pigment analysis. III. I. I.Determinati<strong>on</strong> <strong>of</strong> phytoplankt<strong>on</strong> pigments. J. Fish Res. Bd. Can., 8: 117-127.Peev, D. and S. Gerassimov 1999. Nati<strong>on</strong>al Biom<strong>on</strong>itoring Programme <strong>of</strong> Bulgaria. EU ProgrammePhare BG9310-04-03-01. - GEA-Libris, S<strong>of</strong>ia.Pepe, M., C. Giardino, G. Borsani, A. C. Cardoso, G. Chiaudani, G. Premazzi, E. Rodari and E. Zilioli,2001. Relati<strong>on</strong>ship between apparent optical properties and photosynthetic pigments in the subalpineLake Iseo. Science <strong>of</strong> the Total Envir<strong>on</strong>ment 268(1-3) 1-235.Persat, H., and G.H. Copp,1990. Electric fishing and point abundance sampling in for the ichthyology<strong>of</strong> large rivers. Pages 197-209 in I.G. Cowx, editor. Developments in electric fishing. BlackwellScientific Publicati<strong>on</strong>s, Ltd., Cambridge, MA.Phillips, G. L. and P. Kerris<strong>on</strong>, 1991. The restorati<strong>on</strong> <strong>of</strong> the Norfolk Broads: The role <strong>of</strong>biomanipulati<strong>on</strong>. Mem. Ist. ital. Idrobiol. 48: 75–97Pouilly, M., 1994. Relati<strong>on</strong>s entre l’habitat physique et les poiss<strong>on</strong>s des z<strong>on</strong>es à cyprinidés rhéophilesdans trois cours d’eau du bassin rhodanien : vers une simulati<strong>on</strong> de la capacite d’accueil pour lespeuplements. Ph.D. thesis, University <strong>of</strong> Ly<strong>on</strong> I, Villeurbanne, France.256 p.Prat, N., A. Munné, M. Rieradeval, C. Solá and N. Banada, 2000 ECOSTRIMED. Protocol to establishthe ecological status <strong>of</strong> Mediterranean rivers and streams. Estudis de la Qualitat ecològica dels Rius8. Diputatió de Barcel<strong>on</strong>a, Barcel<strong>on</strong>a.Raddum, G.G., 1999. Large scale m<strong>on</strong>itoring <strong>of</strong> invertebrates: Aims, possibilities and acidificati<strong>on</strong>indexes. In: Raddum, G.G., Rosseland, B.O.& J. Bowman (eds. Workshop <strong>on</strong> <strong>biological</strong> assesmentand m<strong>on</strong>itoring; evaluati<strong>on</strong> and models. NIVA <str<strong>on</strong>g>Report</str<strong>on</strong>g> SNO 4091/1999, ICP Waters: 7-16.Rolauffs, P., I. Stubauer, S. Zahrádková, K. Brabec and O. Moog 2004. Integrati<strong>on</strong> <strong>of</strong> the SaprobicSystem into the European Uni<strong>on</strong> Water Framework Directive. Case studies in Austria, Germany andCzech Republic. Hydrobiologia 516: 285-298.Rothschein, J., 1962 . Grafické znázornenie výsledkov biologického hodnotenia cistoty vod. Výsk.Ústav vodohosp, Bratislava 9: 1-63.Ruse, L.P., 2000 . A simple key to water quality based <strong>on</strong> chir<strong>on</strong>omid pupal exuviae. In: H<strong>of</strong>frichter,O. (ed. Late 20th Century Research <strong>on</strong> Chir<strong>on</strong>omidae. Aachen (Shaker Verlag 405-413.Rutt, G.P., N.S. Weatherly and S.J. Ormerod, 1990. Relati<strong>on</strong>ships between physicochemistry andmacroinvertebrates in British upland streams: the development <strong>of</strong> modelling and indicator systemsfor predicting stream fauna and detecting acidity. Freshwater Ecology 2: 463-480.Schaumburg, J., U. Schmedtje, C. Schranz, B. Köpf, S. Schneider, P. Meilinger, D. Stelzer, G.H<strong>of</strong>mann, A. Gutowski and J. Foerster, 2004. Erarbeitung eines ökologischen Bewertungsverfahrensfür Fließgewässer und Seen im Teilbereich Makrophyten und Phytobenthos zur Umsetzung der EG-Wasserrahmenrichtlinie. Abschlussbericht. Januar 2004. München. Bayerisches Landesamt fürWasserwirtschaft.Schmutz, S., M. Kaufmann, B. Vogel, M. Jungwirth and S. Muhar, 2000. “A multi-level c<strong>on</strong>cept forfish-based, river-type-specific assessment <strong>of</strong> ecological integrity.”Hydrobiologia, 422/423: 279-289.Schöll, F. and A. Haybach, 2001. Bewertung v<strong>on</strong> großen Fließgewässern mittels Potam<strong>on</strong>-Typie-Index(PTI). Verfahrensbeschreibung und Anwendungsbeispiele. BfG-Mitteilungen Nr. 23. Bundesanstaltfür Gewässerkunde, Koblenz.SEPA (Swedish Envir<strong>on</strong>mental Protecti<strong>on</strong> Agency) 2000. Envir<strong>on</strong>mental Quality Criteria - lakes andwatercourses. <str<strong>on</strong>g>Report</str<strong>on</strong>g> no. 5050. SEPA, Stockholm.36
Shann<strong>on</strong>, C.E. and W. Weaver, 1949. The mathematical theory <strong>of</strong> communicati<strong>on</strong>. Urbana Univ.Illinois Press.Schönfelder, I., 1997. Eine Phosphor-Diatomeen-Relati<strong>on</strong> für alkalische Seen und Flüsse Brandenburgsund ihre Anwendung für die paläolimnologische Analyse v<strong>on</strong> Auensedimenten der unteren Havel. J.Cramer, Berlin, Stuttgart Dissertati<strong>on</strong>es Botanicae 283,148 pp.Simps<strong>on</strong>, E.H., 1949. Measurement <strong>of</strong> diversity. Nature 163: 688.Skriver, J., 1999. Danish Stream Fauna Index (DSFI) as an indicator <strong>of</strong> rare and threatened benthicmacroinvertebrates. Biodiversity in benthic ecology. Proceedings from Nordic BenthologicalMeeting in Silkeborg, Denmark, 13-14 November 1997: 97-105.Skoulikidis, N.T., K.C. Gritzalis, T. Kouvarda and A. Buffagni, 2004. The development <strong>of</strong> anecological quality assessment and classificati<strong>on</strong> system for Greek running waters based <strong>on</strong> benthicmacroinvertebrates. Hydrobiologia 516: 149-160.Skriver, J., N. Friberg and J. Kirkegaard, 2000. Biological assessment <strong>of</strong> running waters in Denmark:Introducti<strong>on</strong> <strong>of</strong> the Danish Stream fauna Index (DSFI). Verh. Internat. Verein. Limnol. 27: 1822-1830.Sládeek, V., 1973. System <strong>of</strong> water quality from the <strong>biological</strong> point <strong>of</strong> view. Archiv fürHydrobiologie Ergebnisse der Limnologie 7: 1-218.Sommerhäuser, M., S. Robert, S. Birk, O. Moog, I. Stubauer, and T. Ofenböck 2004. Final report <strong>of</strong> theactivities 1.1.2, 1.1.6 and 1.1.7 <strong>of</strong> the UNDP/GEF Danube Regi<strong>on</strong>al Project “Strengthening theImplementati<strong>on</strong> Capacities for Nutrient Reducti<strong>on</strong> and Transboundary Cooperati<strong>on</strong> in the DanubeRiver Basin”. University <strong>of</strong> Duisburg-Essen and BOKU Vienna, Essen and Vienna.STN (Slovenská Technická Norma) 83 0532 – 1 to 8:1978/79 Biologický rozbor povrchovej vody.(Biological analysis <strong>of</strong> surface water quality). Úrad pro Normalizaci a Mereni, Praha.Stoch, F., 1986. La valutazi<strong>on</strong>e della produttività ittica delle acque correnti. Indici ambientali eproduttività teorica. – Quaderni E.T.P., Udine, 14: 175-181.Strickland, J. D. H., and T. R. Pars<strong>on</strong>s, 1968. A practical handbook <strong>of</strong> seawater analysis. Fish. Res. Bd.Can. Bull. 167, 311 ppStrickland, J. D. H. and T. R. Pars<strong>on</strong>s, 1972. A Practical Handbook <strong>of</strong> Seawater Analysis. Bull. 167Fisheries Res. Bd. Ottawa, Canada.Talling, J.F. and D. Driver, 1963. Some problems in the estimati<strong>on</strong> <strong>of</strong> chlorophyll-a in phytoplankt<strong>on</strong>.In: Proceedings, C<strong>on</strong>ference <strong>of</strong> Primary Productivity Measurements, Marine and Freshwater. U.S.Atomic Com. Publ. TID –7633, 142 - 146.Ten Brink, B.J.E., S.H. Hosper and F. Colijn, 1991. A quantitative method for descripti<strong>on</strong> andassessment <strong>of</strong> ecosystems: the AMOEBA approach. Mar. Poll. Bull. 23: 265-270.Tripkovic, D. (ed.) 2003. Nati<strong>on</strong>al water m<strong>on</strong>itoring strategy. Regi<strong>on</strong>al Envir<strong>on</strong>mental Center forCentral and Eastern Europe – Country Office Serbia and M<strong>on</strong>tenegro, Belgrade.Utermöhl, H., 1958. Zur Vervollkommung der quantitativen phytoplankt<strong>on</strong>-methodik. Mitt. Internat.Verein. Limnol., 9, 1-38.Van den Berg, M., D.T. Van der Molen and P.C.M. Boers, 2002. Setting up reference c<strong>on</strong>diti<strong>on</strong>s forphytoplankt<strong>on</strong>, turbidity and submerged macrophytes in Dutch lakes. TemaNord 566:28-31Verd<strong>on</strong>schot, P.F.M., 2000. Integrated ecological assessment <strong>methods</strong> as a basis for sustainablecatchment management. Hydrobiologia 422/423: 389-412.Vighi, M and Chiaudani, G., 1985. A simple method to estimate lake phosphorus c<strong>on</strong>centrati<strong>on</strong>sresulting from natural, background, loadings. Wat. Res. 19: 987-991.Wolfe-Murphy S.A., E.W. Lawrie, S.J. Smith and C.E. Gibs<strong>on</strong>, 1991. A <str<strong>on</strong>g>Report</str<strong>on</strong>g> by the Northern IrelandLakes Survey. Department <strong>of</strong> the Envir<strong>on</strong>ment (Northern Ireland)Woodiwiss, F.S., 1978. Biological water assessment <strong>methods</strong>. Sec<strong>on</strong>d Technical Seminar -Background informati<strong>on</strong>. Commissi<strong>on</strong> <strong>of</strong> the European Communities. - First Draft report.37
Wright, J.F., D.W. Sutcliffe and M.T. Furse, 2000. Assessing the <strong>biological</strong> quality <strong>of</strong> fresh waters -RIVPACS and other techniques. Freshwater Biological Associati<strong>on</strong>, Ambleside.Zelinka, M. and P. Marvan 1961. Zur Präzisierung der biologischen Klassifikati<strong>on</strong> der Reinheitfließender Gewässer. Arch. Hydrobiol. 57: 389-407.38
Annex I: Compositi<strong>on</strong> <strong>of</strong> the Geographic Intercalibrati<strong>on</strong> GroupsTable 1. Distributi<strong>on</strong> <strong>of</strong> countries by Geographic Intercalibrati<strong>on</strong> Groups (GIGs) andwater categories, with numbers <strong>of</strong> sites in the draft register for each country (25May 2005).CountriesGIGRALRCERiversRECRMELakesAustria 20 10 4 15Belgium 21 2ulgaria 5Cyprus 2 2Czech Republic 22Germany 9 61 13 12Denmark 14 21Est<strong>on</strong>ia 10 13Spain 11 35 55 18Finland 8 12France 22 127 11 8 3 2UK 59 36 11 35Greece 15 2Hungary 16 5Ireland 15 8 19 9Italy 18 6 55 9 4Lithuania 21 6Luxemburg 4Latvia 8 6Malta 1Netherlands 18 21Norway 55 49Poland 13 21Portugal 32 8Romania 14 8Sweden 2 13 25Slovenia 4 2Slovakia 12TOTAL 84 446 51 171 120 47 41 121 44 130RNOLALLATLCELMELNO39
Annex II: Summary <strong>of</strong> the informati<strong>on</strong> gathered from ECOSTATand M<strong>on</strong>itoring WG <strong>on</strong> the nati<strong>on</strong>al lake <strong>biological</strong> <strong>methods</strong>Table 1. Summary <strong>of</strong> general characteristics <strong>of</strong> the lake <strong>biological</strong> <strong>methods</strong> employed indifferent countries (The informati<strong>on</strong> in this table is not complete but gather <strong>on</strong>ly theinformati<strong>on</strong> received from the ECOSTAT WG 2A during the first half <strong>of</strong> 2004 andinformati<strong>on</strong> reported in the WFD CIS M<strong>on</strong>itoring WG fact sheets).BiologicalelementPhytoplankt<strong>on</strong>Aquatic plantsBenthicMacroinvertebratesFishMacro-inv.aquaticplantsPressure Country Sampling Metric AssessmentEutrophicati<strong>on</strong>Eutrophicati<strong>on</strong>Eutrophicati<strong>on</strong>,,acidificati<strong>on</strong>Eutrophicati<strong>on</strong>Eutrophicati<strong>on</strong>,acidificati<strong>on</strong>Eutrophicati<strong>on</strong>,acidificati<strong>on</strong>AT, EE,FIN, IE, IT,LV, LT,NO, PT,SE, SL, SP,UKEE, DE, IE,FIN, LV,LT, SE,SL, UKIE, SE, NOUK,CY, LV,SEInterests differ Lakeareas, frequencies,qualitative orquantitative samples.Using nati<strong>on</strong>al Std orpublished <strong>methods</strong>Different strategies,influence <strong>on</strong> plants intransect from shore todeep waterDifferent samplingaccording to lakearea <strong>of</strong> interestInternati<strong>on</strong>al orNati<strong>on</strong>al StdHand net or beaker,Ekman grabNati<strong>on</strong>al Std (LT,SE)Chl as biomass,tax<strong>on</strong>omiccompositi<strong>on</strong>,abundance andbiovolumeID to species,abundance as %coverageSpeciesabundance,presence orabsence <strong>of</strong>sensitive speciesFamily, genus,speciesSE, SP, UK 5 different <strong>methods</strong> Applicable todifferent lakes.Most ID to speciesand abundanceUKNati<strong>on</strong>al Std for bothbiol.elementsMultimetric indexPSYMRef. C<strong>on</strong>d notc<strong>on</strong>sidered or <strong>on</strong>lyfor limited No <strong>of</strong>lakes. N<strong>on</strong>e WFDcompatibleOne c<strong>on</strong>siders refc<strong>on</strong>d. but forlimited No <strong>of</strong>lakes, mostly usedto m<strong>on</strong>itorchanges. NotWFD compatibleSpeciesApplicable todifferent areas(littoral orpr<strong>of</strong>undal)ref. c<strong>on</strong>d. or needto develop typespecific ref. c<strong>on</strong>d.,5 quality classes.2 WFDcompatibleApplicable topr<strong>of</strong>undalType specific ref.c<strong>on</strong>d., 5 qualityclasses, WFDCompatibleOne with typespecies ref. c<strong>on</strong>d.Good basis fordeveloping WFDcompatible<strong>methods</strong>Ref. C<strong>on</strong>d. forrange <strong>of</strong> env.c<strong>on</strong>d. and geology.Good applicabilityto WFD. Smallstanding water<strong>on</strong>lyAT= Austria, CY= Cyprus, DE= Germany, EE= Est<strong>on</strong>ia, FIN= Finland, IE= Ireland, IT= Italy, LV=Latvia, LT= Lithuania, NO= Norway, PT= Portugal, SE= Sweden, SL= Slovenia, SP= Spain, UK=United Kingdom41
Annex III: River <strong>biological</strong> assessment <strong>methods</strong> from WaterviewDatabase (2004)Table 1. River <strong>biological</strong> assessment <strong>methods</strong> from Waterview Databaseincluded in this review.method country status referenceAssessment <strong>of</strong> sapro<strong>biological</strong> quality <strong>of</strong> rivers Austria u Moog et al. (1999)WFD method for macroinvertebrates (Multimetric Index) Austria d no publicati<strong>on</strong>Belgian Biotic Index (BBI) Belgium uDe Pauw andVanhooren (1983)Biotic Sediment Index (BSI) Belgium nDe Pauw and Heylen(2001)Biotic Index based <strong>on</strong> 'Quality Rating System' Bulgaria uMCgarrigle et al.(1992)Pantle and BuckDeterminati<strong>on</strong> <strong>of</strong> Saprobic Index according to Pantle andBulgarian (1955), RothscheinBuck and Rothschein(1962)Evaluati<strong>on</strong> <strong>of</strong> BSI according to BMWP and quantificati<strong>on</strong> <strong>of</strong>uCyprusBDI according to SCI methodologyCairns et al., 1968PERLA Czech Republic ? Kokes et al. (2003)Sapro<strong>biological</strong> M<strong>on</strong>itoring Czech Republic ? CSN 757716 (1998)DSFI (Danish Stream Fauna Index) Denmark u Skriver et al. (2000)Quality Assessment <strong>of</strong> Est<strong>on</strong>ian Watercourses using BenthicMacroinvertebratesEst<strong>on</strong>ia u SEPA (2000)I.B.G.N. - Indice Biologique Global Normalisé France u AFNOR (1992)I.O.B.S. - Indice Oligochètes de Bioindicati<strong>on</strong> des Sédiments France n AFNOR (2002)Ecological classificati<strong>on</strong> <strong>of</strong> benthic fauna in rivers Germany u Meier et al. (in print)Potam<strong>on</strong>-Characterisati<strong>on</strong>-Index (PTI) Germany u*Schöll and Haybach(2001)AQEM Greece Greece nSkoulikidis et al.(2004)Hellenic Evaluati<strong>on</strong> System (HES) Greece nLazaridou-Dimitriadouet al. (2004)BMWP - HY (adapted to Hungarian c<strong>on</strong>diti<strong>on</strong>s) Hungary ? Just et al. (1998)Quality Rating System Ireland uMCgarrigle et al.(1992)Extended Biotic Index - IBE ('Indice Biotico Esteso')modified according to GhettiItaly u Ghetti (1997)Operative Evaluati<strong>on</strong> <strong>of</strong> the Biological Quality <strong>of</strong> SmallLatvian Standard LVSStreams by Saprobic Index <strong>of</strong> MacrozoobenthosLatviau240 (1999)CommunitiesWater Quality Assessment Liechtenstein n Moog et al. (1999)Operative Evaluati<strong>on</strong> <strong>of</strong> the Biological Quality <strong>of</strong> SmallStreams by Biotic Integrity Index <strong>of</strong> Macrozoobenthos Lithuania u no informati<strong>on</strong>CommunitiesI.B.G.N. - Indice Biologique Global Normalisé Luxembourg u no publicati<strong>on</strong>AMOEBE - general method for ecosystem descripti<strong>on</strong> andassessmentNetherlands n Ten Brink et al. (1991)Ecological classificati<strong>on</strong> system for rivers Netherlands u Molen et al. (2004)Acidificati<strong>on</strong> Index Norway n Raddum (1999)Invertebrate M<strong>on</strong>itoring Norway n no informati<strong>on</strong>BMWP - PL (Biological M<strong>on</strong>itoring Working Party scoreWATERVIEWPolanddadapted to Polish c<strong>on</strong>diti<strong>on</strong>s)DATABASE (2004)BMWP’ (Biological M<strong>on</strong>itoring Working Party scoreAlba-Tercedor andPortugaluadopted to Iberian c<strong>on</strong>diti<strong>on</strong>s)Pujante (2000)Determinati<strong>on</strong> <strong>of</strong> Saprobic Index according to Pantle and Romania n Marcoci (1984)43
method country status referenceBuckSapro<strong>biological</strong> Analysis Slovenia u Grbovic (1999)ECOSTRIMED – Ecological Status <strong>of</strong> Streams and Rivers inthe Spanish Mediterranean AreaSpain d Prat et al. (2000)Benthic Fauna in Lake Littorals and Running Water - TimeSeriesSweden u SEPA (2000)Acidificati<strong>on</strong> Index United Kingdom ? Rutt et al. (1990)Biological GQA (General Quality Assessment) classificati<strong>on</strong> United Kingdom uENVIRONMENTAGENCY (1996)Lotic-invertebrate Index for Flow Evaluati<strong>on</strong> (LIFE) Index United Kingdom u* Extence et al. (1999)System for Evaluating Rivers for C<strong>on</strong>servati<strong>on</strong> (SERCON) United Kingdom n Bo<strong>on</strong> et al. (1997)u - to be used in WFD-compliant m<strong>on</strong>itoring (<strong>on</strong>ly Member States)u* - part <strong>of</strong> method to be used in WFD-compliant m<strong>on</strong>itoringn - not to be used in WFD-compliant m<strong>on</strong>itoringd - under development to be used in WFD-compliant m<strong>on</strong>itoring (<strong>on</strong>ly Member States)c - m<strong>on</strong>itoring disc<strong>on</strong>tinued? - usage in WFD-compliant m<strong>on</strong>itoring uncertain44
Annex IV: Analysis <strong>of</strong> lake <strong>biological</strong> m<strong>on</strong>itoring <strong>methods</strong>(Intercalibrati<strong>on</strong> metadata at 14/01/2004)CHLOROPHYLL1. The WFD allows for the use <strong>of</strong> chlorophyll a as surrogate for phytoplankt<strong>on</strong>biomass and, thus, is c<strong>on</strong>sidered a <strong>biological</strong> parameter, and the most frequentlymeasured in lakes. In the GIGs the percentage <strong>of</strong> lakes for which chlorophyll a ismeasured varies between 40% (Eastern C<strong>on</strong>tinental, EC) and 100% (Mediterranean,ME), with an overall average <strong>of</strong> 82.5% (Fig. 1). A possible explanati<strong>on</strong> for a smallerpercentage <strong>of</strong> lakes with chlorophyll a data in the Eastern C<strong>on</strong>tinental and NorthernGIGs could be a m<strong>on</strong>itoring strategy targeted to identify acidificati<strong>on</strong> impacts and forwhich chlorophyll a is less used.Percentage measuring Chl-a per GIG1008060%40200AL AT BA CE EC ME NOFigure 1. Percentage <strong>of</strong> lakes for which chlorophyll a is measured in the GIG (Al= Alpine;AT= Atlantic, BA= Baltic; CE= Central; EC= Eastern c<strong>on</strong>tinental, ME= Mediterranean,NO= Northern).2. However, there is great heterogeneity both within GIG and between GIGs in terms<strong>of</strong> the sampling <strong>methods</strong>. Most lakes in the GIGs are sampled for chlorophyll abetween 2 and 12 times per year (Fig. 2), and samples are taken over the whole year(m<strong>on</strong>thly) or c<strong>on</strong>centrated during spring, summer, or vegetati<strong>on</strong> periods (Fig. 3).45
Sampling frequencyNOMEECCEBAAT1x2-6x year7-12x yearmore 12x yearAL0 20 40 60 80 100%Figure 2. Sampling frequencies for chlorophyll a in times (x) per year in the GIG.Sampling period1009080706050403020100%AL AT BA CE EC ME NOwhole yrice freevegetati<strong>on</strong>springwintersummerautumnFigure 3. Chlorophyll a sampling periods in the GIGs.3. Most lakes, are m<strong>on</strong>itored for chlorophyll a at <strong>on</strong>ly <strong>on</strong>e stati<strong>on</strong>, a smallerpercentage is sampled at two stati<strong>on</strong>s, particularly in the EC and ME GIGs (Fig. 4.).46
Number <strong>of</strong> sampling stati<strong>on</strong>s10080%6040201 sampling stati<strong>on</strong>2-10 samplingstati<strong>on</strong>s0AL AT BA CE EC ME NOFigure 4. Number <strong>of</strong> sampling stati<strong>on</strong>s for chlorophyll a in the GIGs.4. The sampling depth and volume sampled may c<strong>on</strong>tribute to large differences inthe determinati<strong>on</strong> <strong>of</strong> chlorophyll a c<strong>on</strong>centrati<strong>on</strong>s in a lake. The most frequent methodin all the GIGs involves the collecti<strong>on</strong> <strong>of</strong> surface samples. In some GIGs (mostcountries in the AL, ME and NO GIGs), for a few lakes chlorophyll a is estimatedfrom integrated samples (Fig. 5). In the AL and BA GIGs the collecti<strong>on</strong> <strong>of</strong> more than<strong>on</strong>e discrete sample at different depths is regularly practiced.Sampling depth10080%6040200AL AT BA CE EC ME NO1 surface sample 1 integrated sample more than 1 discrete depthsFigure 5. Sampling depth for chlorophyll a in the GIGs.5. Am<strong>on</strong>g the most heterogeneous steps in the assessment <strong>of</strong> chlorophyll a are,however, the extracti<strong>on</strong> <strong>methods</strong> (e.g. Marker, 1972; Pepe et al, 2001), which varywidely within GIGs, am<strong>on</strong>g GIGs and even within a single country (Table 1). Thesecan explain c<strong>on</strong>siderable variance in the measurement <strong>of</strong> chlorophyll a c<strong>on</strong>centrati<strong>on</strong>.47
6. Some countries (Cyprus, Latvia, Finland and Slovenia) employ internati<strong>on</strong>alstandard <strong>methods</strong> for the determinati<strong>on</strong> <strong>of</strong> chlorophyll, a number <strong>of</strong> other countriesmake use <strong>of</strong> nati<strong>on</strong>al standardized <strong>methods</strong> (Germany and France), and the rest referto several different published <strong>methods</strong>. Some countries gave no reference to themethod employed.Table 1. Chlorophyll determinati<strong>on</strong> <strong>methods</strong> in the different countries within GIGs.GIG/CountryATDEExtracti<strong>on</strong> Measurement Referencesethanol 2 or ethanol and acet<strong>on</strong>e 3ALPINEfluorimetricspectrophotometric or DIN 384 12-L 16HPLC (since 1999)ES methanol (100 %) 4 spectrophotometric Pars<strong>on</strong>s and Strickland (1965)FRAFNORIT acet<strong>on</strong>e (90%) spectrophotometricSLmethanol spectrophotometric SIST ISO 10260:2001 -modifiedATLANTICIE boiling methanol spectrophotometricUKcold acet<strong>on</strong>e (100%) or hot methanolspectrophotometric(90%)BALTICEE ethanol (96%) spectrophotometric Jeffrey and Humphrey (1975)PL acet<strong>on</strong>e spectrophotometricLV ethanol spectrophotometric ISO 10260:1992LTspectrophotometricCENTRALBEacet<strong>on</strong>e (90%) spectrophotometric Golterman et al.(1978),Strickland and Pars<strong>on</strong>s (1968)ethanol (90%)DIN 38 412, modified byDENusch (1980); or Stricklandand Pars<strong>on</strong>s (1972)NL ethanol (80 %) at 75oC spectrophotometricPL acet<strong>on</strong>e spectrophotometricacet<strong>on</strong>e (90%) 5 or cold acet<strong>on</strong>e spectrophotometric Golterman et al.(1978),UK (100%) or hot methanol (90%)Strickland and Pars<strong>on</strong>s (1968);or Phillips and Kerris<strong>on</strong> (1991)EASTERN CONTINENTALHU methanol Wolfe-Murphy et al (1991)MEDITERRANEANacet<strong>on</strong>e (90%) buffered spectrophotometric Standard Methods for theCYexaminati<strong>on</strong> <strong>of</strong> Water andWaste waterESmethanol 6 or acet<strong>on</strong>e (90%) 7 or spectrophotometric Strickland and Pars<strong>on</strong>s (1968)metanol (100 %) 8 or Talling and Driver (1963)2 With spectrophotometric determinati<strong>on</strong>.3 With HPLC determinati<strong>on</strong>.4 Golterman et al. (1978)5 Strickland and Pars<strong>on</strong>s (1968) or Phillips and Kerris<strong>on</strong> (1991)6 Strickland and Pars<strong>on</strong>s (1968)48
IT 90% acet<strong>on</strong>e spectrophotometricPT acet<strong>on</strong>e spectrophotometric Lorenzen (1967)NORTHERNNO 100% methanol spectrophotometricIE boiling methanolUKcold acet<strong>on</strong>e (100% or hot methanol spectrophotometric HMSO (1980)(90% methanol); acet<strong>on</strong>e)FIN spectrophotometric ISO 10260:1992SEspectrophotometricPHYTOPLANKTON7. Most countries include in their <strong>biological</strong> m<strong>on</strong>itoring systems some metric forphytoplankt<strong>on</strong>, as shown in Figure 6. The lowest number <strong>of</strong> lakes for whichphytoplankt<strong>on</strong> is m<strong>on</strong>itored is in the NO GIG (54%), in all other GIGs at least 60% <strong>of</strong>the lakes are m<strong>on</strong>itored for phytoplankt<strong>on</strong>. A possible explanati<strong>on</strong> for a smallerpercentage <strong>of</strong> lakes with phytoplankt<strong>on</strong> data in the Northern GIG could be am<strong>on</strong>itoring strategy targeted to identify acidificati<strong>on</strong> impacts and for whichchlorophyll a is less used.Percentage determining phytoplankt<strong>on</strong> by GIG1008060%40200AL AT BA CE EC ME NOFigure 6. Percentage measuring phytoplankt<strong>on</strong> within the GIGs.8. Lake sampling frequency is variable but in most GIGs, and for most lakes is 2-12times per year (Fig.7), and spring and summer as the most comm<strong>on</strong> sampling seas<strong>on</strong>s(Fig. 8).7 Spectrophotometric determinati<strong>on</strong>8 Talling and Driver (1963)49
Sampling frequencyNOMEECCEBAAT1x yr2-6x yr7-12x yr+12xAL0 20 40 60 80 100Figure 7. Phytoplankt<strong>on</strong> sampling frequency in the GIGs.Sampling period1008060%40200AL AT BA CE EC ME NOwhole yrvegetati<strong>on</strong> periodIce free periodwinterspringsummerautumnFigure 8. Phytoplankt<strong>on</strong> sampling period in the GIGs.9. Most lakes are m<strong>on</strong>itored for phytoplankt<strong>on</strong> at <strong>on</strong>ly <strong>on</strong>e sampling stati<strong>on</strong>, asmaller percentage is sampled in two stati<strong>on</strong>s, as is the case in the EC, ME and CEGIGs (Fig. 9).Number <strong>of</strong> sampling stati<strong>on</strong>s12010080%1 sampling stati<strong>on</strong>s602-10 sampling stati<strong>on</strong>s40200AL AT BA CE EC ME NOFigure 9. Number <strong>of</strong> stati<strong>on</strong>s sampled per lake per GIG.50
10. The sampling depth and volume sampled may c<strong>on</strong>tribute to large differences inthe measured phytoplankt<strong>on</strong> biomass and tax<strong>on</strong>omic compositi<strong>on</strong>. The most frequentmethod involves the collecti<strong>on</strong> <strong>of</strong> surface samples or other discrete samples althoughsome countries take integrated samples (a few lakes by most countries in the NO,some in the AL, AT and ME GIGs) (Fig. 10).12010080Sampling depth%6040200AL AT BA CE EC ME NO1 surf. Sample 1 integrated sample +1 discrete sampleFigure 10. Phytoplankt<strong>on</strong> sampling depth in the GIGs.11. Also, the metrics used in the assessment differ both within and am<strong>on</strong>g GIGs, butmost countries measure abundance and biomass and successively less countries recordbloom occurrence, size compositi<strong>on</strong> and primary productivity (Fig. 11).Phytoplankt<strong>on</strong> metrics%1009080706050403020100AL AT BA CE EC ME NOsize compositi<strong>on</strong>abundancebiomassbloom occurrenceprimary productivityFigure 11. Phytoplankt<strong>on</strong> metrics in the GIGs.51
12. Table 2 shows that sampling <strong>methods</strong> and metrics <strong>of</strong>ten differ between countriesat GIG level, and that apart from biomass as indicated from chlorophyllc<strong>on</strong>centrati<strong>on</strong>s, for a specific lake or lake type each country uses different metrics.Also, there are no countries that completely fulfill the WFD metric requirements.Table 2. Phytoplankt<strong>on</strong> sampling device and metrics used in different countries within theGIGs.GIG/ Sampling methodMetricCountryALPINEATabundance, biomass, group ratios, indicator taxaITabundanceAT point samples abundance, biomass, indicator taxa, group ratiosSI single depth samples temporal and spatial distributi<strong>on</strong> <strong>of</strong> different speciesDE integrated samples species compositi<strong>on</strong> and abundance or abundance and biomass<strong>of</strong> single speciesFR net <strong>on</strong> secchi depth or <strong>on</strong>integrated sampling from 0to 50mabundanceATLANTICIE standard net or aliquot <strong>of</strong> relative abundance, indicator taxa and group ratios, annual cycle,GBPLLVEEPLNLDEROintegrated sampleRutner water sampler everymetre from surfacecomposited, supplementedby phytoplankt<strong>on</strong> net towover lake surface.Composite tube sampling.abundance estimated by analysis <strong>of</strong> the pigment chlorophyllabundance and identificati<strong>on</strong> <strong>of</strong> algal speciesBALTIC15 l <strong>of</strong> water filtered by dominance structure, indicator taxa.plankt<strong>on</strong> net No25 from thedepth <strong>of</strong> 1m and 5m.with Ruttner bathometer, biomass, indicator taxa, relative c<strong>on</strong>tributi<strong>on</strong> <strong>of</strong> Cyanophyta,from 0,5 m depth other Chrysophyta, Bacillariophyta etc, saprobic index, number <strong>of</strong>from 0.2-0.3 m depth and 5-species10mRuttner sampler or VanDorn sampler Utermöhl's(1958) technique1l and qualitative drawnsample from photic z<strong>on</strong>e.plankt<strong>on</strong>-net no 25.abundance, frequency <strong>of</strong> occurrence, indicator taxa, group ratios,percentages <strong>of</strong> larger tax<strong>on</strong>omic groups, community structure,chlorophyll a c<strong>on</strong>centrati<strong>on</strong>CENTRALdominance structure, indicator taxa.cell counting (from col<strong>on</strong>ies cells are estimated), identificati<strong>on</strong> tospecies or to genera level, share <strong>of</strong> groups (diatoms-blue – greenotheralgae)surface sample or standard No informati<strong>on</strong> availablewater sampler in a depth <strong>of</strong>1 m, or 5-liter integralsampler, sampling theepilimnetic layersamples takes with bucket,Knopp method SR ISOspecies density, abundance, wet biomass, biomass <strong>on</strong>systematical gr, probic index52
PTESFIIE5667-2/98 Romanianstandardisated method(STAS-ICIM)bottle sampler andUtermohl method -qualitative analysisMEDITERRANEANspecies abundance classes (present, frequent, abundant andbloom)abundance and species compositi<strong>on</strong>NORTHERNOne composite sample from biomass, species number, relative abundance.the epilimni<strong>on</strong>, usually 0 - 2m. Sampling, preservati<strong>on</strong>and analysis described indetail in Swedish EPAreports 4860 and 4861.Standard net, haul from 6mfor quantitative data andsub-surface waterrelative abundance, indicator taxa and group ratiosGB 5m integrated tube, species listNO 2m tube sampler taken atsite <strong>of</strong> max.depth. Separatesamples are mixed fromdifferent depth intervals: 0-2, 2-4, 4-6 m etc. down to2x secchi depthbiomass per species for each species presentSEdepth- and surfaceintegrated pelagial samplescollected with a plexiglasstube. Sampling,preservati<strong>on</strong>, and analysesdescribed in detail inSwedish EPA reports 4860and 4861total biovolumePHYTOBENTHOS13. Most countries do not use phytobenthos in their <strong>biological</strong> m<strong>on</strong>itoring (Fig. 12),The highest number <strong>of</strong> lakes m<strong>on</strong>itored for phytobenthos is found in the EC GIGfollowed closely by CE and AL GIGs, while in the NO GIG countries this <strong>biological</strong>element is not used at all.53
Phytobenthos per GIG1008060%40200AL AT BA CE EC ME NOintercalibrati<strong>on</strong> GIGFigure 12. Percentage measuring phytobenthos in the GIGs.14. In cases where phytobenthos is sampled, the most frequent sampling frequency is2-6 times per year, but in Mediterranean countries it is <strong>on</strong>ly sampled <strong>on</strong>ce a year (Fig.13). The samples are taken in either <strong>on</strong>e lake stati<strong>on</strong> (all AT and EC), or 2-10 stati<strong>on</strong>s(most BA and CE), or more than 10 stati<strong>on</strong>s (all ME and most AL) (Fig. 14).Sampling frequencyNOMEECCEBAATAL1x yr2-6x yr7-12x0 20 40 60 80 100%Figure 13. Phytobenthos sampling frequency in the GIGs.54
Sampling stati<strong>on</strong>s%1008060402001 2-10 +10Number <strong>of</strong> stati<strong>on</strong>sALATBACEECMENOFigure 14. Phytobenthos sampling stati<strong>on</strong>s in the GIGs.15. As with chlorophyll a and phytoplankt<strong>on</strong>, sampling is held during the vegetati<strong>on</strong>growth period, spring and summer (Fig. 15). Sampling and metrics vary (Table 3).The habitats sampled differ, some countries sample epilithic and others epiphyticphytobenthos. The compositi<strong>on</strong> metrics are species compositi<strong>on</strong>, presence or absence<strong>of</strong> species and indicator taxa. The quantity metrics are the relative abundance <strong>of</strong>species, indicator taxa and excessive growth <strong>of</strong> nuisance species such as Cladophora.Sampling period100%806040200AL AT BA CE EC ME NOWholeYearVegetati<strong>on</strong> periodSpringSummerAutumnFigure 15. Phytobenthos sampling period in the GIG’s.55
Table 3. Phytobenthos sampling and metrics used in different countries within the GIGs..GIG/CountrySampling Method Compositi<strong>on</strong> Metric QuantityMetricALPINEDE epilithic diatoms species compositi<strong>on</strong> relative abundance according to400 counted valvesATLANTICGBdirect observati<strong>on</strong> in thelittoral z<strong>on</strong>epresence/absence by directobservati<strong>on</strong>.excessive growths <strong>of</strong> nuisancespecies such as Cladophora agg.BALTICEE species compositi<strong>on</strong> Biomass as chlorophyll aBEDiatoms relative abundance;sediment assemblage,epiphytesCENTRALrelative abundance <strong>of</strong>indicator taxa (species)DE epilithic diatoms species compositi<strong>on</strong> andrelative abundanceDE (1) benthic diatoms attached Trophic state index<strong>on</strong> reed and submerged (H<strong>of</strong>mann 1994); IndexmacrophytesBRB (phosphorus(2) diatom remains from availability, Schönfelderdeepest point surface 1997)sediment (Niederreiter gravitycorer)DE epilithic diatoms species compositi<strong>on</strong> andrelative abundanceROKnopp methodPantle - Buck methodSR ISO 5667-2/98EASTERN CONTINENTALspecies list, indicator taxa;annual medium number <strong>of</strong>species; annual mediumdensity <strong>of</strong> speciesMEDITERRANEANES submerged substrates species determinati<strong>on</strong>relative abundance (counts <strong>of</strong>500 valves)relative abundancerelative abundances(percentages) <strong>of</strong> each speciesrelative abundancenumber <strong>of</strong> ind/m256
MACROPHYTES16. The aquatic Macrophytes are widely used in the <strong>biological</strong> m<strong>on</strong>itoring systems <strong>of</strong>the AT, BA and CE GIGs and less in all other GIGs (Fig. 16).Angiosperms per GIG%80706050403020100Al AT BA CE ME NOFigure 16. Percentage sampling Macrophytes in the GIGs.17. Sampling occurs mostly between 2 and 6 times per year, in some GIGs a smallernumber <strong>of</strong> lakes are sampled from 7 to 12 times per year (in the AT, BA, CE and NOGIGs) (Fig. 17), all during the summer or vegetati<strong>on</strong> period (Fig. 18).Sampling frequencyNOMECEBAATAL12-67-12+120 20 40 60 80 100Figure 17. Macrophytes sampling frequency in the GIGs.%57
Sampling period%120100806040200AL AT BA CE ME NOWhole yearVegetati<strong>on</strong> periodIce free periodWinterSpringSummerAutumnFigure 18. Macrophytes sampling period in the GIGs.18. The number <strong>of</strong> sampling stati<strong>on</strong>s per lake is widely variable (Fig. 19), in a singleGIG the number can be <strong>of</strong> 1, 2-10 or more than 10, excepting for the ME were thenumber is 2-20.Number <strong>of</strong> sampling stati<strong>on</strong>s%10090807060504030201001 2-10 +10Figure 19. Macrophytes number <strong>of</strong> stati<strong>on</strong>s in the GIGS.ALATBACEMENOy19. In the AL, AT, BA and ME GIGs all emergent, floating and submerged plants aresampled. In c<strong>on</strong>trast in the CE and NO GIGs not all countries sample the three groups<strong>of</strong> plants (Fig. 20).58
Plants sampled per GIG1008060%40EmergentFloatingSubmerged200AL AT BA CE ME NOFigure 20. Groups <strong>of</strong> Macrophytes sampled in the GIGs.20. In Table 4 the sampling <strong>methods</strong> and metrics for Macrophytes are presented.Compositi<strong>on</strong> and abundance are recorded from visual inspecti<strong>on</strong>s in the field from theshore. In cases when the whole lake is m<strong>on</strong>itored this is d<strong>on</strong>e by boat. One countryuses an aqua-scope to m<strong>on</strong>itor plant growth underneath the water surface. Rakes andgrapnels are used to remove the plants, al<strong>on</strong>g transects, for estimati<strong>on</strong> <strong>of</strong> abundanceand tax<strong>on</strong>omic identificati<strong>on</strong>. In most countries the plants are identified to species andabundance and/or diversity determined.Table 4. Macrophytes sampling and metrics used in different countries within the GIGs.GIG/ Sampling Method Compositi<strong>on</strong> Metric Quantity MetricCountryALPINEIT rake species listAT Jager et al. (2002, 2004)Melzer et al. (1986).plant massSI combined geobotanical quadrate species diversity relative abundance,estimati<strong>on</strong> by degrees 1-5DEIEGBtransect method with boat andrake/grab; mapping <strong>of</strong> ecologicallyhomogenous secti<strong>on</strong>s <strong>of</strong> the wholelittoral z<strong>on</strong>eshoreline examinati<strong>on</strong>s and samplingat 6m intervals al<strong>on</strong>g transects fromshoreline using rake and underwatercameras Recording <strong>of</strong> abundance andspecies in littoral z<strong>on</strong>e <strong>of</strong> the lakeaugmented with emergents readilyidentifiable at distance.inshore transects using rake;shoreline examinati<strong>on</strong>s and samplingat 6m intervals al<strong>on</strong>g transects fromshoreline using rake and underwatermapping speciescompositi<strong>on</strong>ATLANTICspecies, frequency <strong>of</strong>occurrence, indicator taxa,group ratiosspecies compositi<strong>on</strong>,frequency <strong>of</strong> occurrence,indicator taxa, group ratiosabundance(semiquantitative),5 point scale according toKohler (1978)abundance, weight <strong>of</strong>discrete samples DAFORrelative abundance, weight<strong>of</strong> discrete samples,DAFOR59
PLEENLGBcameras; recording <strong>of</strong> abundance andspecies in littoral z<strong>on</strong>e <strong>of</strong> the lakeaugmented with emergents readilyidentifiable at distance; believed to betransect using grapnel from boatfields observati<strong>on</strong>s: occurrence <strong>of</strong>submerged and emergent sensitiveangiosperm taxa; plant survey(Braun-Blanquet, 1964)mapping <strong>of</strong> the species <strong>of</strong> the wholelake, rake method, distributi<strong>on</strong> depth.vegetati<strong>on</strong> is sampled with a rake,1000 sample points, cover estimatedby eye in eight classes per species,Charophytes and mosses are alsosampled, but determined at genusleveltransect survey with grapnel;transects using a double headed rake;believed to be transect with grapnelBALTICplant compositi<strong>on</strong>, presence<strong>of</strong> indicator species,diversity <strong>of</strong> plantcommunitiesspecies compositi<strong>on</strong>, speciesdiversity, coverage anddistributi<strong>on</strong> depth PVI(percent volume infested)CENTRALspecies compositi<strong>on</strong> ,Tensley scale per speciesavailablespecies list, number <strong>of</strong>speciescol<strong>on</strong>isati<strong>on</strong> index, index<strong>of</strong> the age <strong>of</strong> ecosystem,synanthropisati<strong>on</strong> index,area covered by particularplant communitiesrelative abundance, depthdistributi<strong>on</strong>, density (shootsper m2*, PVI)total covered area,submerged macrophytes,Tansley scalerelative abundance, ranked1-4, abundance usingDAFOR scaleBEPLNLDENLESIEshore-based, rake (littoral); grid, boat, type specific speciesgrapnel (whole lake)(abundance weighted),disturbance indicators,growth formsPlant survey (Braun-Blanquet, 1964). presence <strong>of</strong> indicatorspecies, diversity <strong>of</strong> plantcommunities.Tansley scale sampling <strong>on</strong> 50 metertransects, including charophytestransect method with boat andrake/grab; mapping <strong>of</strong> ecologicallyhomogenous secti<strong>on</strong>s <strong>of</strong> the wholelittoral z<strong>on</strong>e New method for WFD,method <strong>of</strong> mapping (Kohler, 1978);aquatic spermatophyta, pteridophyta,characeae, bryophyta, rake (Jensen,1977, Engel and Nichols, 1994,Karttunen and Toiv<strong>on</strong>en, 1995)Tansley, Charophytes are alsosampled, but determined at genuslevelspecies, tansley scalemapping specificcompositi<strong>on</strong>Tansley scaleMEDITERRANEANmanual sample collecti<strong>on</strong> and grabber species abundancesamplersNORDICshoreline examinati<strong>on</strong>s and sampling frequency <strong>of</strong> occurrence,at 6m intervals al<strong>on</strong>g transects from indicator taxa, group ratiosshoreline using rake and underwatercameras.cover/ frequency (Tansley);aquatic vegetati<strong>on</strong>, shorevegetati<strong>on</strong>col<strong>on</strong>isati<strong>on</strong> index, index <strong>of</strong>the age <strong>of</strong> ecosystem,synanthropisati<strong>on</strong> index,area covered by particularplant community,abundance.abundance, tansley scaleabundance(semiquantative),abundance in differentsoundings (Kohler, 1978)5 point scale according toBraun-Blanquetcover <strong>of</strong> growth forms areestimated% coverabundance, weight <strong>of</strong>discrete samples60
NO qualitativ method species number, ALS relative abundance, areacoverageNOSEplants recorded using aqua scope andcollected by dredging from boat,whole-lake investigati<strong>on</strong> with respectto species richness, quantitativeestimate <strong>of</strong> the percentage coveragefor randomly selected squares al<strong>on</strong>g<strong>on</strong>e transect.species richness, indicatorscoresIE inshore transects using rake frequency <strong>of</strong> occurrence,indicator taxa, group ratiosrelative abundanceabundance <strong>of</strong> the species isscored by ascale(1=rare,2=scattered,3=comm<strong>on</strong>, 4=locallydominant and 5=dominant)area coverage - expertopini<strong>on</strong>percentage coverrelative abundanceBENTHIC INVERTEBRATES21. The percentage <strong>of</strong> lakes for which benthic invertebrates are sampled within theGIGs is for part most below 40%, with excepti<strong>on</strong> <strong>of</strong> AT and CE (Fig. 21).Benthic invertebratesper GIG%9080706050403020100Al AT BA CE EC ME NOFigure 21. Percentage <strong>of</strong> lakes sampled for benthic invertebrates in the GIGs.22. Sampling frequency is variable between GIGs, the most comm<strong>on</strong> frequencies are1 or 2-6 times per year, but EC countries sample a few lakes 7-12 times per year, andthe BA, AT and AL include a combinati<strong>on</strong> <strong>of</strong> different sampling frequencies (Fig.22). Sampling occurs mostly in spring and summer but in the AL and NO GIGs it isperformed most <strong>of</strong>ten in the Autumn (Fig. 23).61
Sampling frequencyNOMEECCEBAATAL12-67-12+120 20 40 60 80 100Figure 22. Benthic invertebrates sampling frequency in the GIGs.Sampling period%120100806040200AL AT BA CE EC ME NOWhole yearVegetati<strong>on</strong> periodIce free periodWinterSpringSummerAutumnFigure 23 Benthic invertebrates sampling period in the GIGs.23. In Table 5 the sampling <strong>methods</strong> and metrics for benthic invertebrates arepresented. It shows that a wide number <strong>of</strong> sampling approaches and metrics are used.The collecti<strong>on</strong> <strong>of</strong> samples is performed by several different devices: grab, Eckmanskip, sticking cylinder, triangle bottom scraper and hand net. The mesh size varieswidely from 100µm to 670µm. When kick sampling is used time (1-3 minutes), meshsize (100-670µm) and habitat sampled (littoral in general or st<strong>on</strong>es) are different.Some countries sampled in lake littoral, other the pr<strong>of</strong>undal and some in both lakez<strong>on</strong>es (IE). Two countries make use <strong>of</strong> internati<strong>on</strong>al sampling standard <strong>methods</strong>,Est<strong>on</strong>ia and Romania. These standards are currently under revisi<strong>on</strong>.24. Every country uses a different combinati<strong>on</strong> <strong>of</strong> metrics, the following metrics areeither used al<strong>on</strong>e or in combinati<strong>on</strong>: abundance and relative abundance, diversity62
indicators, species lists, frequency <strong>of</strong> occurrence <strong>of</strong> individual taxa, number <strong>of</strong> taxa,group ratios, average score per taxa, biotic score, biotic integrity index, saprobicindex, average score per tax<strong>on</strong> and ratio <strong>of</strong> littoral to pr<strong>of</strong>undal taxa.Table 5. Benthic invertebrates sampling and metrics used in different countries withinthe GIGs..GIG/CountrySampling MethodMetricDEFRIEGBPLLTEEEEALPINEsampling with grab or sticking cylinder; meshsize for sieving 0.2 mmEckman skip + strainerlittoral samples taken by kick sampling <strong>on</strong> st<strong>on</strong>y abundance, frequency <strong>of</strong> occurrence,substrate for 2 minutes using 670µm mesh size; presence <strong>of</strong> indicator taxa, group ratios andp<strong>on</strong>d net bag with rectangular frame (260mm diversitywide, 200mm high); pr<strong>of</strong>undal samples taken byEckman Grab (5 replicates) at deepest point <strong>of</strong>lake3 minute kick sample with Freshwater biotic score, number <strong>of</strong> taxa and averageBiological Associati<strong>on</strong> p<strong>on</strong>d net mesh 100um score per tax<strong>on</strong>, log abundance estimates,indicator taxa.BALTICEkmann and Birdge sampler, samples from the dominance structuredepth <strong>of</strong> 20 - 50 m5 samples taken in 1/40 m2 area by special biotic integrity indexdevice for quantitative measurements and 1sample by triangle bottom scraper, which isdragged for 2-5 metresguidance <strong>of</strong> sampling <strong>of</strong> aquatic benthic macroinvertebrates(ISO 7828:1985),(ISOspecies compositi<strong>on</strong>, number <strong>of</strong> species8265:1988),(ISO 9391:1993),(ISO 8689-1:2000),(ISO 8689-1:2000).Borutsky or Zabolotsky bottom sampler;internati<strong>on</strong>al standards: (ISO 7828:1985). (ISO8689-1:2000)(ISO 8689-2:2000).percentages <strong>of</strong> larger tax<strong>on</strong>omic groups,ASPT, EPT indexesCENTRALNL depending <strong>on</strong> substrate macroinvertebrates are no metric used for classificati<strong>on</strong>; Zebrasampled from st<strong>on</strong>es (5 st<strong>on</strong>es), or the substrate mussels: biovolume and number <strong>of</strong>itself is sampled with a grab (Ekman samples sites0.15x0.15m), or tube (diameter ca. 0.1m) orhand net (mesh 0.5 mm).GB 1 minute kick/sweep species listBE littoral, standard netDE sampling stati<strong>on</strong>s in different depths (2-3, 5, 7, indicator taxa, abundance, group ratio:10, 15, 24 m) al<strong>on</strong>g <strong>on</strong>e transect, mesh size: 405 littoral/pr<strong>of</strong>undal faunaµm; or with grab or sticking cylinder; mesh sizefor sieving 0.2 mm and 0,5 mm; or Ekman-Birge sampler, dredgeEASTERN CONTINENTALRO Knopp method; Pantle - Buck method; SR ISO density, indicator taxa, abundance, number5667-2/98<strong>of</strong> species, saprobic indexES grabber samplers species determinati<strong>on</strong>63
CY replicate samples with hand net or beaker in evaluati<strong>on</strong> based <strong>on</strong> BSI (Benthicspring and autumn from 6 points at depth <strong>of</strong> 1m. Saprobity index) and BDI (Biologicaldiversity index). Manual <strong>on</strong> Water QualityEvaluati<strong>on</strong> (BDI:quantified according toSequential Comparis<strong>on</strong> index. BSI:determinati<strong>on</strong>s up to family level)NORDICFI Littoral: recently some separate preparatory Metrics to be further developedsurveys, using various sampling <strong>methods</strong>.Sampling in Autumn (or also spring). Kicksampling 20s x 1m. Modified nti<strong>on</strong>al standard(SFS 5077). Pr<strong>of</strong>undal: sampling most usuallyat point <strong>of</strong> maximum depth (but other depthsmay be sampled) Ekman sampler but also tubesampler used. Sieving mesh size 0.5mm. (SFS-EN-ISO 9391:1995, SFS 5076 and SFS 5730).IE littoral samples taken by kick sampling <strong>on</strong> st<strong>on</strong>y abundance or relative abundance,substrate for 2 minutes using 670µm mesh size; frequency <strong>of</strong> occurrence, presence <strong>of</strong>p<strong>on</strong>d net bag with rectangular frame (260mm indicator taxa, group ratios and diversitywide, 200mm high). Pr<strong>of</strong>undal samples taken byEckman Grab (5 replicates) at deepest point <strong>of</strong>lake.NO kick-sampling with net in littoral z<strong>on</strong>e: min 120 Raddum acidity index (acid sensitive taxa)seek per substrate type, mesh size: 0.25 mm (0.5mm)SE kick samples, 20s x 1m, mesh size= 0.5mm Average Score Per Tax<strong>on</strong>, Danish FaunaIndex, acidity index, Shann<strong>on</strong> diversityFISH25. Most countries do not use fish in their <strong>biological</strong> m<strong>on</strong>itoring and assessmentprogrammes (Fig 24). The highest number <strong>of</strong> lakes sampled for fish is found in theBA GIG followed closely by CE and NO GIGs, while in the AT GIG the countriesthis <strong>biological</strong> element is not used at all.Fish per GIG%1009080706050403020100Al AT BA CE ME NOFigure 24. Percentage sampling fish in the GIGs.64
26. The sampling frequency is variable generally 2-12 times per year (Fig. 25), withsummer and autumn as the most comm<strong>on</strong> sampling seas<strong>on</strong>s (Fig. 26).Sampling frequencyNOMECEBAAT12-67-12+12AL0 20 40 60 80 100Figure 25. Fish sampling frequency in the GIGs.Sampling period%80706050403020100AL AT BA CE ME NOWhole yearVegetati<strong>on</strong> periodIce free periodWinterSpringSummerAutumnFigure 26. Fish sampling frequency in the GIGs.27. Table 6 describes the sampling <strong>methods</strong> and metrics for fishes. It shows a widenumber <strong>of</strong> sampling approaches and metrics. A total <strong>of</strong> 13 countries are samplingfishes in lakes using a total <strong>of</strong> 7 different approaches, either al<strong>on</strong>e or in combinati<strong>on</strong>,that are used for gathering the informati<strong>on</strong>: net fishing (gillnets and trammel net),electr<strong>of</strong>ishing, hydroacoustics, catch statistics, informati<strong>on</strong> from anglers and historicdata. The majority <strong>of</strong> the countries determine species compositi<strong>on</strong>, some the nativespecies and or functi<strong>on</strong>al group ratios. Fish abundance is determined as total biomass,relative biomass (CPUE), either for the whole fish community per species, and as65
density. The age structure or size structure is determined in all but three countries:Poland, Finland and UK.Table 6. Fish sampling and metrics used in different countries within the GIGs..GIG/CountrySampling method Compositi<strong>on</strong> metric Quantity metric Age/ size structureALPINEIT net fishing species compositi<strong>on</strong> YATDEPLgillnets, electr<strong>of</strong>ishing,hydroacoustics (Gassner, H.and J. Wanzenböck, 1999)catch statistic <strong>of</strong> pr<strong>of</strong>essi<strong>on</strong>alfishermen and sport fishing;test-fishinginformati<strong>on</strong> from anglers;historical dataLT selective fish-net, length - 5m,porosity - 14, 18, 22, 25, 36,40, 50, 60 mmEENLGBDEselectiv fish-net, 5m length,porosity - 14, 18, 22, 25, 36,40, 50, 60 mm; Lundgrenmulti-mesh nyl<strong>on</strong>m<strong>on</strong><strong>of</strong>ilament gillnetsLundgren type gillnets; trawls(10x1,5 m), mesh 12 mm.hydroacoustics - survey carriedout using a portableechosounder operating at200kHz. Central arm had 10transects with a total length <strong>of</strong>1935mPoint electro fishing accordingto EN 14011,al<strong>on</strong>g transectlines; multimesh gillnetsaccording to Swedish standardnative speciescaught speciesBALTICoccurrence <strong>of</strong> the fishtaxa <strong>on</strong> the basis <strong>of</strong>anglers' informati<strong>on</strong>or catches; indicatortaxanumber <strong>of</strong> speciescaptured fishes aresorted by mesh sizeand species, measuredby the total length,number <strong>of</strong> speciespiscivor./planktivorandpiscivor./omnivor.ratiosCENTRALspecies listsno data available forindividual speciesYmetric t<strong>on</strong>s per year Yabundance inunits/ha andbiomass in kg/haNYabundance in Yunits/ha, biomass inkg/ha, CPUEtotal biomass andspecies share <strong>of</strong>total biomass,CPUEfish density at -50db and fishdensity at -56 dBspecies compositi<strong>on</strong> relative abundanceand estimate <strong>of</strong>biomass, CPUEage distributi<strong>on</strong>,size structureMEDITERRANEANES Trammel net, RFAI Method species determinati<strong>on</strong> size compositi<strong>on</strong>FI prEN 14757 Water quality –sampling <strong>of</strong> fish with gillnets;Nordic gillnets in littoral,pr<strong>of</strong>undal and pelagic.NORDICnative species,species compositi<strong>on</strong>NYCPUE, number and Yweight66
CEN/TC 230/WG 2/ TG 4 N28, 2 nd working draftNO prEN 14757 Water quality -Sampling <strong>of</strong> fish with gillnets;Nordic gillnets in littoral,pr<strong>of</strong>undal and pelagial,CEN/TC 230/WG 2/TG 4 N28, 2nd Working draftSENordic multiple mesh sizegillnetting. Both pelagic andbottom nets are used, seeSwedish EPA report 4921 andAppelberg, 2000species numberspecies number,diversityunit catches, Yrelative abundance,CPUE for eachspecies (mainlytrout)abundance, biomass Y67
Annex V: Analysis <strong>of</strong> river <strong>biological</strong> m<strong>on</strong>itoring <strong>methods</strong>.PHYTOPLANKTON1. The overview <strong>of</strong> the river phytoplankt<strong>on</strong> m<strong>on</strong>itoring systems includes theapproaches <strong>of</strong> 4 nati<strong>on</strong>al <strong>methods</strong>: Est<strong>on</strong>ia, Hungary, Latvia and Romania.2. The phytoplankt<strong>on</strong> sampling includes quantitative and qualitative <strong>methods</strong>:Est<strong>on</strong>ia uses a bottle sampler, Latvia uses the Rutther bathometer (APHA 10200),Romania uses a handnet and Hungary a scoop-sampler.3. With respect to the sampling frequency, the programmes vary from weeklysampling at some sites (Hungary) to every five years (Est<strong>on</strong>ia).4. The level <strong>of</strong> tax<strong>on</strong>omic resoluti<strong>on</strong> used in all the assessment methodologies based<strong>on</strong> river phytoplankt<strong>on</strong> is the species or genus.5. Abundance is expressed as number <strong>of</strong> cells (Est<strong>on</strong>ia and Romania) while inHungary is expressed in 7 abundance classes. Both Latvia and Romania calculatebiomass.6. Three different categories <strong>of</strong> assessment <strong>methods</strong> were identified in this review:biotic indices, assemblage/community assessment and multimetric indices.7. For phytoplankt<strong>on</strong>, two countries use biotic indices (Romania and Hungary), <strong>on</strong>ea biomass, assemblage/community assessment (Latvia) and another a multimetricindex (Est<strong>on</strong>ia).8. Romania samples phytoplankt<strong>on</strong> in additi<strong>on</strong> to phytobenthos, benthicinvertebrates and zooplankt<strong>on</strong> while Hungary samples phytoplankt<strong>on</strong> in additi<strong>on</strong> tophytobenthos and benthic invertebrates. Both countries use the Saprobic Index (Pantleand Buck, 1955) and classify the <strong>biological</strong> quality <strong>of</strong> the watercourses into <strong>on</strong>e <strong>of</strong>five quality classes.PHYTOBENTHOS9. The overview <strong>of</strong> the river phytobenthos m<strong>on</strong>itoring systems includes theapproaches <strong>of</strong> 15 countries. The phytobenthos community includes diatom and n<strong>on</strong>diatomgroups. However, most <strong>of</strong> the developed <strong>methods</strong>, especially in m<strong>on</strong>itoring69
programs are based <strong>on</strong>ly <strong>on</strong> the diatom group. This is because diatoms are found inabundance in most lotic ecosystems and are differentially adapted to a wide range <strong>of</strong>ecological c<strong>on</strong>diti<strong>on</strong>s (Barbour et al, 1999). The identificati<strong>on</strong> <strong>of</strong> the n<strong>on</strong>-diatomgroups requires a c<strong>on</strong>siderable effort, expertise and expense. In this report <strong>on</strong>lyRomania has a m<strong>on</strong>itoring programme covering both diatom and n<strong>on</strong>-diatom groups,while DE (Germany) has a new assessment method under development that includesboth groups.10. The sampling procedure is based in the European Norms EN 13946 (2003) Waterquality: Guidance standard for the routine sampling and pretreatment <strong>of</strong> benthicdiatoms for rivers for water quality assessment and/or in nati<strong>on</strong>al methodologicalguidelines. Some countries, for example Germany and the United Kingdom use therecommendati<strong>on</strong>s <strong>of</strong> Kelly et al. (1998).11. Both documents <strong>on</strong>ly c<strong>on</strong>cern diatoms and are related to the choice <strong>of</strong> substratumand sample site selecti<strong>on</strong>, field sampling procedure and sample pre-treatment prior tomicroscope identificati<strong>on</strong> and lists sampling equipment and reagents. A workingdocument for a proposed new European Standard is in preparati<strong>on</strong> which includesalgal groups other than diatoms (cyanobacteria, green algae, red algae, etc.).12. A recent draft summarising the <strong>methods</strong> using benthic algae to assess waterquality in running water c<strong>on</strong>cluded that the main processes in use for routine samplingare similar, <strong>on</strong>ly details that depend <strong>on</strong> current velocity and dominating type <strong>of</strong>available substratum may vary (CEN TC230 N68).13. The available informati<strong>on</strong> shows that scraping with a brush from the naturalsubstrates (st<strong>on</strong>es) is the most comm<strong>on</strong> method. In France and in Spain a brush or anet-scrapper with 0,3mm mesh-size is used in stream secti<strong>on</strong>s 10 times l<strong>on</strong>g as wide.Quantitative sampling is performed in some cases, using a fixed surface area forsampling that varies between 9cm 2 and 100cm 2 .14. Artificial subtracts are <strong>on</strong>ly used by France and the United Kingdom.15. C<strong>on</strong>cerning the sampling habitat, 6 methodologies are multihabitat, 6 are singlehabitat related with hard subtracts (cobbles or st<strong>on</strong>es) and 3 did not answer. All thesedifferent procedures do not allow comparability between the results as they reflectdifferent ecological situati<strong>on</strong>s. The multihabitat sampling best characterizes the70
enthic algae in the reach, but results may not be sensitive to subtle water qualitychanges because <strong>of</strong> habitat variability between reaches. Species compositi<strong>on</strong> <strong>of</strong>assemblages from a single habitat potentially reflect water quality differences betweenstreams more precisely than multihabitat sampling, but impacts in other habitats in thereach may be missed (Barbour et al, 1999).16. The sampling frequency for phytobenthos m<strong>on</strong>itoring varies from annually inFrance, every 3 years in Austria and 4 years in Romania.17. Barbour et al. (1999) recommended that single habitat sampling should be usedwhen biomass <strong>of</strong> periphyt<strong>on</strong> is assessed. In other circumstances the use <strong>of</strong>multihabitat sampling may be more appropriated. The <strong>on</strong>ly references for biomassquantificati<strong>on</strong> relate to the assessment method developed by Norway, which isperformed in a single substratum, in riffle c<strong>on</strong>diti<strong>on</strong>s.18. The level <strong>of</strong> tax<strong>on</strong>omic resoluti<strong>on</strong> used in the assessment methodologies based inphytobenthos is the species or species groups. Only Slovenia uses a higher tax<strong>on</strong>omiclevel, which varies from species to family or higher tax<strong>on</strong>omic level. Forphytobenthos most <strong>of</strong> the indices require species-level identificati<strong>on</strong>, although somecan be used with genera, or a mixture <strong>of</strong> genera and species. Some taxa are difficult toidentify and in these cases the taxa have been pooled into “paired taxa”.19. Despite the complexity <strong>of</strong> diatoms identificati<strong>on</strong>, this is costly and timec<strong>on</strong>suming process and hence, the lowest tax<strong>on</strong>omic level is <strong>of</strong>ten preferable,providing a better ecological resoluti<strong>on</strong>, especially for definiti<strong>on</strong> <strong>of</strong> referencec<strong>on</strong>diti<strong>on</strong>s. This problem will be enhanced if the m<strong>on</strong>itoring programmes includediatoms and n<strong>on</strong>-diatoms groups.20. The identificati<strong>on</strong> process is based <strong>on</strong> a European Standard EN 14407 (2004)Water quality: Guidance standard for the identificati<strong>on</strong>, enumerati<strong>on</strong> andinterpretati<strong>on</strong> <strong>of</strong> benthic diatom samples from running water. This standardestablishes <strong>methods</strong> for identificati<strong>on</strong> and enumerati<strong>on</strong> <strong>of</strong> relative proporti<strong>on</strong>s <strong>of</strong>diatom taxa <strong>on</strong> prepared slides and <strong>of</strong> data interpretati<strong>on</strong> relevant to assessment <strong>of</strong>water quality in rivers and streams. It is suitable for use with indices and assessment<strong>methods</strong> based <strong>on</strong> the relative abundance <strong>of</strong> taxa.71
21. Some countries like France, Est<strong>on</strong>ia and Sweden use the OMNIDIA s<strong>of</strong>tware fortax<strong>on</strong>omic identificati<strong>on</strong> (Lecointe et al., 1993), which allows the calculati<strong>on</strong> <strong>of</strong> agreat number <strong>of</strong> diatom indices and c<strong>on</strong>tains a systematic and an ecological database.C<strong>on</strong>sultati<strong>on</strong> <strong>of</strong> other literature is also recommended for the algal identificati<strong>on</strong>, likefloras, identificati<strong>on</strong> guides and ic<strong>on</strong>ographs appropriated to the habitats andgeographic regi<strong>on</strong> under c<strong>on</strong>siderati<strong>on</strong>.22. The recording <strong>of</strong> abundance is usually expressed as the number <strong>of</strong> cells per tax<strong>on</strong>per sample <strong>on</strong> occasi<strong>on</strong>s using abundance classes. Relative coverage <strong>of</strong> the river bedis also menti<strong>on</strong>ed by Norway.23. With respect to the n<strong>on</strong>-diatom group, Austria estimates abundance in microscopepreparati<strong>on</strong>s and estimates coverage <strong>of</strong> channel bed by macroalgae. Germany is alsodeveloping a method which includes an abundance specificati<strong>on</strong> in 5 classes based ina verbal descripti<strong>on</strong>s.24. Three different categories <strong>of</strong> assessment <strong>methods</strong> were identified in this review:biotic indices, assemblage/community assessment and multimetric indices.25. For phytobenthos, biotic indices are the most comm<strong>on</strong> assessment methodincluding 5 different approaches all based in diatom assemblages, applied to 9countries. Only <strong>on</strong>e country is using assemblage/community assessment (Austria) andtwo are using multimetric indices (Est<strong>on</strong>ia and Germany).26. The Biological Diatom Index’ (IBD- Indice Biologique Diatomées; AFNOR,2000) is the <strong>on</strong>ly standardized method applied <strong>on</strong> a nati<strong>on</strong>al level. This has been usedin France as part <strong>of</strong> a m<strong>on</strong>itoring program since 1999. Other countries, like Spain andEst<strong>on</strong>ia are also using IBD as their assessment method, while Sweden use “TheGeneric Diatom Index” (Bourrelly, 1981) and the “Specific Polluti<strong>on</strong> SensitivityIndex” (Cemagref, 1982). Both are diatom indices <strong>of</strong> French origin, and assess thegeneral quality <strong>of</strong> the watercourses. The IBD is used to assess different pressures likeorganic polluti<strong>on</strong>, eutrophicati<strong>on</strong>, acidificati<strong>on</strong> and toxic substances.27. Another index comm<strong>on</strong>ly used is the British Trophic Diatom Index (TDI - Kellyand Whitt<strong>on</strong>, 1995; Kelly et al., 1998). This index is based <strong>on</strong> diatoms and provides am<strong>on</strong>itoring tool that separates the influence <strong>of</strong> nutrients from that <strong>of</strong> other c<strong>on</strong>stituents<strong>of</strong> sewage discharges. Its applicati<strong>on</strong> comprises both an indicati<strong>on</strong> <strong>of</strong> eutrophicati<strong>on</strong>72
y filtered reactive phosphorus and determinati<strong>on</strong> <strong>of</strong> the percentage polluti<strong>on</strong> tolerantvalves (%PTV) to estimate the influence <strong>of</strong> organic polluti<strong>on</strong> (Birk, 2003). This indexis used in United Kingdom and in Est<strong>on</strong>ia and has been applied in Ireland.28. As stated above, besides Romania and Hungary, Slovenia also uses a saprobioticanalysis in its m<strong>on</strong>itoring programme, including phytobenthos samples in additi<strong>on</strong> tothe benthic invertebrates samples. This method is based in the Saprobic Index (Pantleand Buck, 1955) modified by Zelinka and Marvan (1961), in a seven scheme qualityclassificati<strong>on</strong> from unpolluted/very slightly polluted to excessively polluted. The sameindex is used in Czech Republic but is presented in five quality classes.29. In Austria, a single metric is used in a diatom based trophic state indicator, whichallows a classificati<strong>on</strong> <strong>of</strong> sites according to total phosphorous and nitrogencompounds.30. C<strong>on</strong>cerning multimetric indices, <strong>on</strong>ly Est<strong>on</strong>ia and Germany have a multimetricassessment method under development. Est<strong>on</strong>ia uses both IBD and TDI indices toevaluate the <strong>biological</strong> quality <strong>of</strong> the watercourses, while Germany is still developinga method based in n<strong>on</strong>-diatom and diatom groups.MACROPHYTES31. Macrophytes are m<strong>on</strong>itored in ten countries <strong>of</strong> the European Uni<strong>on</strong> also includingNorway (Table 1). All <strong>methods</strong> comprise the investigati<strong>on</strong> <strong>of</strong> watercourse vegetati<strong>on</strong>by means <strong>of</strong> regular visual surveys to record the tax<strong>on</strong>omic compositi<strong>on</strong> andabundance <strong>of</strong> water plants. Assessment <strong>of</strong> the ecological quality <strong>of</strong> watercourses isd<strong>on</strong>e by five schemes using numerical evaluati<strong>on</strong> <strong>on</strong> the basis <strong>of</strong> metrics. Austria,Germany and The Netherlands have recently developed macrophyte <strong>methods</strong> to meetthe requirements <strong>of</strong> the WFD.73
Table 1. European <strong>methods</strong> for m<strong>on</strong>itoring and assessment <strong>of</strong> macrophytes in watercourses.Method Country ReferenceWFD method for macrophytes Austria no referenceMacrophyte m<strong>on</strong>itoring Denmark Skriver 1999Macrophyte m<strong>on</strong>itoring Est<strong>on</strong>ia no referenceIndice Biologique Macrophytes en RivièreAFNOR (Associati<strong>on</strong> FrançaiseFrance(I.B.M.R.)de Normalisati<strong>on</strong>) 2002PHYLIB Germany Schaumburg et al. 2004Method for the survey <strong>of</strong> aquaticmacrophytes in running watersLatvia Cimdins et al. 1995KRW-Maatlatten for Aquatic FloraTheNetherlandsMolen et al. 2004Macrophyte assessment Norway no referenceMacrophyte m<strong>on</strong>itoringMean Trophic Ranking (MTR)SwedenUnitedKingdomSwedish Envir<strong>on</strong>mentalProtecti<strong>on</strong> Agency 2000Holmes et al. 199932. Compositi<strong>on</strong> and abundance <strong>of</strong> in-stream macrophytes are recorded in the field byvisual inspecti<strong>on</strong> from the banks or by wading in the stream. Larger watercourses areinvestigated by boat or diving. In some countries aqua-scopes are employed, whichare specifically designed tools to survey the plant growth underneath the watersurface. Rakes or grapnels are used to remove macrophytes for abundance estimati<strong>on</strong>or further tax<strong>on</strong>omic identificati<strong>on</strong>.33. Sampling area differs between individual <strong>methods</strong>. In the Nordic countriesseparate transects <strong>of</strong> 0.25 * 0.25 m² are sampled. The French and Latvian <strong>methods</strong>specify to survey an area <strong>of</strong> at least 100 m². Other schemes prescribe the investigati<strong>on</strong><strong>of</strong> stream reaches <strong>of</strong> 100 m or 500 m.34. Latvia and Norway follow the standard EN 14184:2003 Water quality: Guidancestandard for the surveying <strong>of</strong> aquatic macrophytes in running waters.35. Most comm<strong>on</strong>ly macrophytes are identified to species level, which is usually d<strong>on</strong>ein the field. Uncertain identificati<strong>on</strong>s are verified in the laboratory by referring toherbarium species.36. Two different schemes to record macrophyte abundance are in use. In mostcountries the relative coverage <strong>of</strong> the macrophyte community is measured. Methodsapplied in Austria and Germany specify the ‘plant mass estimate’ which accounts forthe three-dimensi<strong>on</strong>al extensi<strong>on</strong> <strong>of</strong> the plant stand. In both opti<strong>on</strong>s abundance is74
expressed in classes. For most <strong>methods</strong> the number <strong>of</strong> classes and the defined rangesdeviate.37. The numerical evaluati<strong>on</strong> <strong>of</strong> macrophyte compositi<strong>on</strong> and abundance is d<strong>on</strong>e inassessment <strong>methods</strong> <strong>of</strong> France, Germany, Latvia, The Netherlands and UnitedKingdom. Quality appraisal is mainly based <strong>on</strong> a single biotic index integratingindicator species and their abundance. Most indicator species included in the indices<strong>of</strong> the French and British schemes are sensitive to the trophic state <strong>of</strong> the water andthe sediment. In Latvia macrophytes are part <strong>of</strong> the Saprobic System to detect organicpolluti<strong>on</strong>.38. Multimetric assessment based <strong>on</strong> macrophytes is d<strong>on</strong>e by Germany and TheNetherlands. Dependent <strong>on</strong> the stream type assessed by the German method, mossesand phanerogams are separately evaluated, or further metrics (e.g. evenness,percentage <strong>of</strong> Sparganium emersum etc.) are added to the results <strong>of</strong> the main index.Besides the assessment <strong>of</strong> general degradati<strong>on</strong>, the method comprises modules for thedetecti<strong>on</strong> <strong>of</strong> acidificati<strong>on</strong> in base-poor mountain streams. The Dutch method c<strong>on</strong>sidersthe percent coverage <strong>of</strong> plant growth forms and the abundance <strong>of</strong> stream type-specificindicator species to assess general stream degradati<strong>on</strong>. In both <strong>methods</strong> the overallquality <strong>of</strong> the watercourse is derived <strong>on</strong> the basis <strong>of</strong> the analysis <strong>of</strong> the entire aquaticflora including phytobenthos.39. The number <strong>of</strong> quality classes, in the <strong>methods</strong> discussed ranges from four toseven. The quality classificati<strong>on</strong> for sites analysed by the British method is indicatedbut a three class system has been proposed based <strong>on</strong> MTR. Here, <strong>on</strong>lyrecommendati<strong>on</strong>s for the interpretati<strong>on</strong> <strong>of</strong> the index value are given.BENTHIC INVERTEBRATESA. Summary <strong>of</strong> the nati<strong>on</strong>al assessment <strong>methods</strong> for rivers usingbenthic invertebrates40. The overview <strong>of</strong> <strong>biological</strong> assessment <strong>methods</strong> using benthic invertebratescomprises 44 schemes applied in 32 European countries. Besides <strong>methods</strong> which willbe used in WFD-compliant m<strong>on</strong>itoring programmes by the EU Member Statesadditi<strong>on</strong>al assessment <strong>methods</strong> <strong>of</strong> specific interest have been included. The range <strong>of</strong>75
countries also covers N<strong>on</strong>-EU Member States. All discussed <strong>methods</strong> are listed in theAnnex III comprising data <strong>on</strong> status and literature references. Detailed descripti<strong>on</strong>s <strong>of</strong>most <strong>methods</strong> comprising the complete set <strong>of</strong> acquired data are available athttp://starwp3.eu-star.at (Waterview Database).41. The following secti<strong>on</strong> provides a short summary <strong>of</strong> the state-<strong>of</strong>-the-art <strong>of</strong><strong>biological</strong> <strong>methods</strong> and watercourse m<strong>on</strong>itoring using benthic macroinvertebrates ineach country. Informati<strong>on</strong> has mainly been taken from Waterview Database (2004)and Birk and Schmedtje (in print).Austria42. For WFD implementati<strong>on</strong> a multimetric method for assessing the ecological status<strong>of</strong> rivers is in preparati<strong>on</strong>. This benthic invertebrate based stressor-specific (organicpolluti<strong>on</strong> and habitat alterati<strong>on</strong>) multimetric index for m<strong>on</strong>itoring running waters inAustria has been elaborated (Ofenböck et al. 2004) and will be finalised by the end <strong>of</strong>2004 covering all Austrian stream types. In this c<strong>on</strong>text it is planned to extend thenati<strong>on</strong>al m<strong>on</strong>itoring network to a maximum <strong>of</strong> 900 sites and to all <strong>biological</strong> qualityelements (benthic invertebrates, macrophytes and phytobenthos, and fish) accordingto their relevance for the surface water type.Belgium43. Applied in Belgium since 1978 (standardised since 1984) the Belgian Biotic Index(BBI) represents a simple, rapid, reliable, low cost and practical assessment-tool forwatercourses using benthic invertebrates The calculati<strong>on</strong> <strong>of</strong> the BBI is performed byusing a table with indicating faunistic groups and number <strong>of</strong> systematic units. Asystematic group involves mostly tax<strong>on</strong>omical groups at genus or family level. Theresulting value <strong>of</strong> the BBI is classified <strong>on</strong> a five-class quality scale ranging fromlightly polluted or unpolluted to very heavily polluted (cf Republic <strong>of</strong> Ireland system).44. The Biotic Sediment Index (BSI) is an adapted versi<strong>on</strong> <strong>of</strong> the Belgian Biotic Indexbased <strong>on</strong> the tax<strong>on</strong>omic diversity <strong>of</strong> benthic macroinvertebrate community and thepresence or absence <strong>of</strong> indicator taxa in a given sediment sample. The degree <strong>of</strong>polluti<strong>on</strong> sensitivity <strong>of</strong> a tax<strong>on</strong> is related to 13 c<strong>on</strong>taminants (heavy metals, organictoxicants) resulting in five polluti<strong>on</strong> tolerance ranks. BSI score can vary between 10and 0, corresp<strong>on</strong>ding with four sediment quality classes.76
Bulgaria44. In Bulgaria, the Danube and its tributaries have been studied <strong>on</strong> the basis <strong>of</strong>benthic invertebrate data for more than twenty years. The nati<strong>on</strong>al method for<strong>biological</strong> water quality assessment <strong>of</strong> running waters is a biotic index based <strong>on</strong> theIrish Quality Rating System. The Saprobic Index was formerly prescribed in theCOMECON 9 agreement, but today it is <strong>on</strong>ly used in the frame <strong>of</strong> scientific analyses(Peev and Gerassimov, 1999).Cyprus45. In Cyprus the biodiversity <strong>of</strong> the macroinvertebrate fauna is being quantifiedaccording to the Sequential Comparis<strong>on</strong> Index (SCI) methodology and an estimate <strong>of</strong>a Species Deficit Score (SDS), comparing the local number <strong>of</strong> species with thenumber <strong>of</strong> species at a reference or upstream area. Organic polluti<strong>on</strong> is beingevaluated according to the method prescribed by the Biological M<strong>on</strong>itoring WorkingParty (BMWP).Czech Republic46. Sapro<strong>biological</strong> m<strong>on</strong>itoring based <strong>on</strong> investigati<strong>on</strong>s <strong>of</strong> the benthic invertebratefauna is used for the standardised assessment <strong>of</strong> organic polluti<strong>on</strong> in Czech rivers. Thedegree <strong>of</strong> polluti<strong>on</strong> is evaluated according to the technical norm SN 75 7716 (1998)and is applied in a large m<strong>on</strong>itoring network (approx. 1450 sites).47. Since 2002 small watercourses have been m<strong>on</strong>itored by using the PERLApredicti<strong>on</strong> system. Here, the observed fauna is compared with an expected streamtype-specific reference fauna in order to assess <strong>biological</strong> quality.48. Besides the PERLA system, a multimetric approach has been elaborated, which isa Czech modificati<strong>on</strong> <strong>of</strong> the AQEM system (Brabec et al., 2004). In this study organicpolluti<strong>on</strong> and morphological degradati<strong>on</strong> have been assessed <strong>on</strong> three small and midsizedstream types. For WFD implementati<strong>on</strong> the applicati<strong>on</strong> <strong>of</strong> both predictive andmultimetric assessment are under discussi<strong>on</strong>.Denmark9 Council for Mutual Ec<strong>on</strong>omic Assistance77
49. The Danish Stream Fauna Index is determined <strong>on</strong> the basis <strong>of</strong> indicator taxa andthe number <strong>of</strong> diversity groups in the total fauna sample (kick samples and handpickedsamples). The first step <strong>of</strong> assessing the quality class is d<strong>on</strong>e by assigning thesampled fauna to <strong>on</strong>e <strong>of</strong> six indicator groups based <strong>on</strong> at least two specimens <strong>of</strong>selected tax<strong>on</strong>omic groups found in the kick samples or <strong>on</strong>e specimen found in thehand-picked sample, respectively. Additi<strong>on</strong>ally, selected species bel<strong>on</strong>g to positive(e.g. Baetidae, Nemoura) or negative (e.g. Erpobdella, Sialis) diversity groups, whichare added up and classified (four ranges in total) within the sec<strong>on</strong>d step <strong>of</strong> assessment.Carrying-out both steps leads directly to <strong>on</strong>e <strong>of</strong> seven quality classes, ranging from'unimpacted' to 'very str<strong>on</strong>gly impacted'.Est<strong>on</strong>ia50. The Est<strong>on</strong>ian quality assessment <strong>of</strong> watercourses is based <strong>on</strong> the Swedish BenthicFauna in Lake Littorals and Running Water - Time Series method. It uses fourselected indicator metrics <strong>of</strong> macroinvertebrate diversity and distributi<strong>on</strong>: Shann<strong>on</strong>'sDiversity Index, ASPT Index, Danish Stream Fauna Index and Acidity Index. Thismultimetric approach leads to an assessment <strong>of</strong> both watercourses (riffle areas) andlittoral z<strong>on</strong>e <strong>of</strong> lakes, resulting in <strong>on</strong>e <strong>of</strong> five quality classes. It is planned to use theratio between observed index value and expected reference value to indicate theextent to which bottom fauna c<strong>on</strong>diti<strong>on</strong>s deviate from an undisturbed (natural) state.Finland51. Assessment is based <strong>on</strong> riffle/ rapid kick net samples with three replicates (Finishsatandard SFS – 5077). A multimetric method for assessing the status <strong>of</strong>macroinvertebrates has been tested. The system under preparati<strong>on</strong> c<strong>on</strong>sists <strong>of</strong> severalmetrics, e.g. number <strong>of</strong> type-specific species, EPT tax<strong>on</strong>s and abundance <strong>of</strong> indicatorspecies.France52. The Standardised Biological Global Index (I.B.G.N.) is widely used in m<strong>on</strong>itoringprogrammes in France since 1992. Benthic invertebrates are usually identified t<strong>of</strong>amily-level, some groups to higher tax<strong>on</strong>omical level. The method embraces 138different taxa to determine the ‘total variety <strong>of</strong> the sample (t)’ split up into 14 varietyclasses. 38 taxa c<strong>on</strong>stitute nine ‘faunal indicator groups (GI)’, which are selected if78
three (or ten, respectively) individuals bel<strong>on</strong>ging to an indicator tax<strong>on</strong> are found in thesample. On the basis <strong>of</strong> an index value-chart the I.B.G.N. is calculated directly -dependent <strong>on</strong> variety class (table rows) and indicator group (table columns) andassigned to 5 quality classes.53. The Oligochaeta Index for Sediment Bioindicati<strong>on</strong> (I.O.B.S.) assesses the generalquality <strong>of</strong> stable and permanent fine sediments <strong>of</strong> natural and artificial watercoursesand indicates their susceptibility to gross organic stress and micropollutants such asmetals and PCBs. To calculate the index 100 individuals have to be identified. Thetotal number <strong>of</strong> taxa (<strong>on</strong>ly Oligochaeta) and the dominant percentage <strong>of</strong> Tubificidaewith or without hair-chaetae are determined. The latter group indicates the effect <strong>of</strong>micropollutants.Germany54. For WFD implementati<strong>on</strong> a multimetric approach for <strong>biological</strong> classificati<strong>on</strong>based <strong>on</strong> benthic invertebrates was developed for selected stream types across Europe(AQEM-Project, Hering et al., 2004). In Germany, this approach is now beingexpanded to cover all stream types that have been identified for WFDimplementati<strong>on</strong>. The method includes modules for the detecti<strong>on</strong> <strong>of</strong> organic polluti<strong>on</strong>,acidificati<strong>on</strong> and general degradati<strong>on</strong>. The method will undergo testing regarding itspracticability in 2005 and 2006.55. Part <strong>of</strong> the multimetric scheme is the Potam<strong>on</strong>-Characterisati<strong>on</strong>-Index, which isspecifically designed for the ecological status assessment <strong>of</strong> large rivers and is based<strong>on</strong> the presence <strong>of</strong> typical species <strong>of</strong> the potam<strong>on</strong> (lower course <strong>of</strong> the river).Greece56. In Greece, no generally applied assessment method exists. The high proporti<strong>on</strong> <strong>of</strong>endemic species necessitates thorough autecological studies prior to the development<strong>of</strong> evaluati<strong>on</strong> methodologies. Additi<strong>on</strong>ally, a sampling network has to be established.57. The European AQEM project generated a multimetric classificati<strong>on</strong> scheme forthree Greek stream types based <strong>on</strong> macroinvertebrate sampling. Its applicati<strong>on</strong> isunder development. The Hellenic Evaluati<strong>on</strong> System is an adaptati<strong>on</strong> <strong>of</strong> the BMWP-ASPT score to Greece c<strong>on</strong>diti<strong>on</strong>s.79
Hungary58. Since 2002 a modificati<strong>on</strong> <strong>of</strong> the British BMWP-ASPT score system is appliedfeaturing newly included taxa and modified scores. Combinati<strong>on</strong> <strong>of</strong> total score andaverage score per tax<strong>on</strong> results in an index value, which is assigned to <strong>on</strong>e <strong>of</strong> fiveclasses <strong>of</strong> watercourse quality. The method is in preliminary phase and practicalexperience and tax<strong>on</strong>omic expertise are advancing.Ireland59. The Quality Rating System used in Ireland relates the relative abundance <strong>of</strong> fivekey groups <strong>of</strong> benthic invertebrates to water quality. In each group taxa <strong>of</strong> similarsensitivity (mainly to organic polluti<strong>on</strong>) are integrated. The index is based primarily<strong>on</strong> individuals identified to family level. Additi<strong>on</strong>ally, the British BMWP system areapplied in Northern Ireland. BMWP includes ASPT.Italy60. The IBE is based <strong>on</strong> the Extended Biotic Index according to (Woodiwiss, 1978)and is a standard method for assessing Italian watercourses. For determinati<strong>on</strong> <strong>of</strong> theIBE value two factors are c<strong>on</strong>sidered: taxa richness (diversity) and presence <strong>of</strong>sensitive taxa (indicator groups). Calculati<strong>on</strong> is performed with a cross-table. Theresulting index reaches values between 0 and 14, the highest number indicating thebest water quality.Latvia61. The standardised Operative Evaluati<strong>on</strong> <strong>of</strong> the Biological Quality <strong>of</strong> Small Streamsis used for <strong>biological</strong> quality c<strong>on</strong>trol <strong>of</strong> small streams with a flow velocity more than0,1 m/s. The Saprobic Index is calculated according to Zelinka and Marvan (1961)and the results are assigned to <strong>on</strong>e <strong>of</strong> five quality classes. Water quality evaluati<strong>on</strong> <strong>of</strong>larger streams in Latvia is d<strong>on</strong>e by the Saprobic Assessment <strong>of</strong> River Water Qualitybased <strong>on</strong> hydro<strong>biological</strong> indicators.Liechtenstein62. The Austrian method Assessment <strong>of</strong> sapro<strong>biological</strong> quality <strong>of</strong> rivers is used inLiechtenstein to assess the impact <strong>of</strong> organic polluti<strong>on</strong> <strong>on</strong> streams. The modularstructure <strong>of</strong> this method allows different procedures to be chosen for specific purposes80
ased <strong>on</strong> increasing temporal (sampling and determinati<strong>on</strong>) effort and the level <strong>of</strong>precisi<strong>on</strong>.Lithuania63. No informati<strong>on</strong>Luxembourg64. The <strong>of</strong>ficial method used by the Envir<strong>on</strong>ment Administrati<strong>on</strong> to assess <strong>biological</strong>water quality in Luxembourg is the French I.B.G.N. Few sites per year are studied andno general and recent maps <strong>of</strong> <strong>biological</strong> water quality for the whole country areavailable at the moment.65. At the 'Public Research Centre - Gabriel Lippmann' a biocoenotic study <strong>on</strong> aquaticbenthic invertebrates has been c<strong>on</strong>ducted since 1994, which primarily aims to studybiodiversity. In this c<strong>on</strong>text the dataset is used to test several indices (am<strong>on</strong>g themBMWP, ASPT and DIN 38 410). Within the next three years it is intended to generatea predictive system (similar to RIVPACS or PERLA) out <strong>of</strong> which a system forecological water quality assessment will be developed.Netherlands66. In the Netherlands a new method to assess the ecological quality <strong>of</strong> runningwaters has recently been developed to fulfill the requirements <strong>of</strong> WFD-compliantm<strong>on</strong>itoring. The scheme enables stream type-specific evaluati<strong>on</strong> based <strong>on</strong> referencec<strong>on</strong>diti<strong>on</strong>s and comprises compositi<strong>on</strong> and abundance metrics.67. General <strong>methods</strong> for ecosystem descripti<strong>on</strong> and assessment that are alreadyapplied in the Netherlands are called AMOEBA. In principle an AMOEBA can bedeveloped for all water types. An important part <strong>of</strong> the approach is the descripti<strong>on</strong> <strong>of</strong>the reference situati<strong>on</strong>. The reference system is quantified by means <strong>of</strong> targetvariables, i.e. organisms, which are representative <strong>of</strong> the different parts <strong>of</strong> the aquaticecosystem. By expressing the present-day values <strong>of</strong> the target variables as apercentage <strong>of</strong> reference values ecological assessment is possible.Norway68. Macroinvertebrates from rivers are used in the assessment <strong>of</strong> organic polluti<strong>on</strong>,acidificati<strong>on</strong>, heavy metal polluti<strong>on</strong> and effects <strong>of</strong> hydropower regulati<strong>on</strong>s. An81
Acidificati<strong>on</strong> Index, based <strong>on</strong> the sensitivity <strong>of</strong> the various taxa, is used to assess theeffects <strong>of</strong> acidificati<strong>on</strong>. The classificati<strong>on</strong> system is modified to cover acidificati<strong>on</strong> <strong>of</strong>organic rivers. In eutrophicati<strong>on</strong> studies, different indices such as the Modified TrentIndex, BMWP, ASTP, Shann<strong>on</strong>-Weaver are used.69. Knowledge <strong>on</strong> Norwegian river macroinvertebrates is based <strong>on</strong> nati<strong>on</strong>alm<strong>on</strong>itoring programs <strong>on</strong> acidificati<strong>on</strong> and liming (22 rivers including <strong>on</strong>ly n<strong>on</strong>-limedsites) and various surveys related to effects <strong>of</strong> local polluti<strong>on</strong> and river regulati<strong>on</strong>s(approx. 900 sites).Poland70. The BMWP system provides a score for each macroinvertebrate family that isprimarily dependant <strong>on</strong> its sensitivity to organic polluti<strong>on</strong>. In use in the UnitedKingdom since the late 1970s, this method is intended to be applied in Poland,operating with a modified list <strong>of</strong> indicator taxa. It is recently elaborated and will so<strong>on</strong>be utilised within a pilot project. To verify the results obtained by calculating theBMWP score, a diversity index expressed as the ratio <strong>of</strong> number <strong>of</strong> families tomacroinvertebrate fauna abundance is determined.Portugal71. For WFD-compliant m<strong>on</strong>itoring the BMWP' will be used which is an adaptati<strong>on</strong> <strong>of</strong>the British Biological M<strong>on</strong>itoring Working Party (BMWP) score system. Themodificati<strong>on</strong>s include the additi<strong>on</strong> <strong>of</strong> new families, changes in some scores anddivisi<strong>on</strong> <strong>of</strong> scores into five classes, representing various degrees <strong>of</strong> organic polluti<strong>on</strong>.Romania72. M<strong>on</strong>itoring <strong>of</strong> aquatic biota throughout Romania is c<strong>on</strong>ducted four times per yearwithin the framework <strong>of</strong> the Nati<strong>on</strong>al Water M<strong>on</strong>itoring System, which started in1978. In the past, <strong>biological</strong> quality assessment was based <strong>on</strong> the Relative LoadMethod (Knöpp, 1955). Now, <strong>biological</strong> quality assessment <strong>of</strong> running waters is based<strong>on</strong> the determinati<strong>on</strong> <strong>of</strong> the Saprobic Index according to Pantle and Buck (1955).Since the beginning <strong>of</strong> 2004 the index scores have been classified in a five-bandscheme following the recommendati<strong>on</strong>s <strong>of</strong> Knoben et al. (1999).82
73. In preparati<strong>on</strong> <strong>of</strong> WFD implementati<strong>on</strong> a nati<strong>on</strong>al stream typology has beendeveloped. In additi<strong>on</strong>, a multimetric assessment method was completed, whichdetermines the <strong>biological</strong> water quality based <strong>on</strong> the effects <strong>of</strong> organic polluti<strong>on</strong>, toxicsubstances and morphological degradati<strong>on</strong>.Spain74. Within the Spanish project GUADALMED a method to assess the ecologicalstatus <strong>of</strong> streams and rivers in the Spanish Mediterranean area has been developed(ECOSTRIMED). The main objective <strong>of</strong> ECOSTRIMED is to provide an integratedquality assessment system for fluvial ecosystems. It includes the riparian habitat andthe <strong>biological</strong> quality <strong>of</strong> the water as the main parameters. Designed as a RapidBioassessment Protocol (RBP) it is performed directly in the field with a shortsampling time schedule.75. The ECOSTRIMED index is calculated by combining the values <strong>of</strong> two differentquality indices: 1) a <strong>biological</strong> index based <strong>on</strong> macroinvertebrates (FBILL orIBMWP), 2) a Riparian Habitat Quality Index (QBR). In accordance with therequirements <strong>of</strong> the WFD the result is presented in <strong>on</strong>e <strong>of</strong> five classes <strong>of</strong> ecologicalstatus.Sweden76. The Time Series as a comp<strong>on</strong>ent <strong>of</strong> the Swedish method Benthic Fauna in LakeLittorals and Running Water uses four selected indicator metrics <strong>of</strong> macroinvertebratediversity and distributi<strong>on</strong>: Shann<strong>on</strong>’s Diversity Index, ASPT Index, Danish StreamFauna Index and Acidity Index according to Hendiks<strong>on</strong> and Medin. This approachleads to an assessment <strong>of</strong> watercourses (riffle areas), resulting in <strong>on</strong>e <strong>of</strong> five c<strong>on</strong>diti<strong>on</strong>classes for each metric. The ratio between observed index value and expectedreference value is used to indicate the extent to which bottom fauna c<strong>on</strong>diti<strong>on</strong>s deviatefrom an undisturbed (natural) state.Switzerland77. Switzerland uses the comp<strong>on</strong>ent Benthos biology <strong>of</strong> the Methods for Investigati<strong>on</strong>and Assessment <strong>of</strong> running waters to evaluate <strong>biological</strong> watercourse quality. Themethod‘s objectives are to gain informati<strong>on</strong> <strong>on</strong> the occurrence <strong>of</strong> comm<strong>on</strong>macroinvertebrate taxa and to appraise and assess impacts <strong>on</strong> its compositi<strong>on</strong>.83
Identificati<strong>on</strong> is predominantly to family level to meet the demands <strong>of</strong> a rapid, lowexpenditure system. The two parts <strong>of</strong> the assessment are the standardised calculati<strong>on</strong><strong>of</strong> two quality indices (1. calculati<strong>on</strong> either according to BBI or I.B.G.N., 2. number<strong>of</strong> scoring taxa) and a verbal characterisati<strong>on</strong> <strong>of</strong> the river status (discussi<strong>on</strong> <strong>of</strong> specialaspects c<strong>on</strong>cerning the invertebrate-community). The values <strong>of</strong> both quality indicesare used to determine the quality class (5-class scheme).United Kingdom78. Widely used by the Envir<strong>on</strong>ment Agency for England and Wales for reportingNati<strong>on</strong>al River Quality surveys since 1996, the Biological GQA method is applied incombinati<strong>on</strong> with chemical examinati<strong>on</strong>s (Chemical GQA). It is based <strong>on</strong> thepresence <strong>of</strong> major groups <strong>of</strong> invertebrates (mostly families). The two indices used forthe classificati<strong>on</strong> are the average BMWP-score per tax<strong>on</strong> (ASPT) and the number <strong>of</strong>scoring taxa (N-taxa, i.e. the number <strong>of</strong> major groups used in the scheme). Havingcalculated these indices, they are compared to those expected in an unpolluted riverby means <strong>of</strong> RIVPACS (River Invertebrate Predicti<strong>on</strong> and Classificati<strong>on</strong> System -computer-based, mathematical model which predicts the river fauna using physicalstream data). This comparis<strong>on</strong> is expressed in the Ecological Quality Index (observed:predicted ratio) for both the number <strong>of</strong> taxa and the ASPT. The resulting EQI-valuesare assigned to <strong>on</strong>e <strong>of</strong> six quality classes. It is planned to include the LoticinvertebrateIndex for Flow Evaluati<strong>on</strong> (LIFE) Index into the GQA scheme.79. In additi<strong>on</strong>, the Acidificati<strong>on</strong> Index is a <strong>biological</strong> classificati<strong>on</strong> scheme forsensitivity to acidificati<strong>on</strong> (index <strong>of</strong> acid c<strong>on</strong>diti<strong>on</strong>s). The System for EvaluatingRivers for C<strong>on</strong>servati<strong>on</strong> (SERCON) is used to identify important rivers forc<strong>on</strong>servati<strong>on</strong> and to m<strong>on</strong>itor river rehabilitati<strong>on</strong> schemes.B. Comparative analysisPressures targeted80. Table 2 lists the percentage <strong>of</strong> assessment <strong>methods</strong> using benthic invertebrates todetect certain anthropogenic pressures. Within the range <strong>of</strong> particular stressorsbiodegradable organic polluti<strong>on</strong> represents the main focus <strong>of</strong> bioassessment inEuropean rivers. All other specific pressures are less prevalent. With nearly 30percent the detecti<strong>on</strong> <strong>of</strong> general degradati<strong>on</strong> (stressor not specified) holds the sec<strong>on</strong>dlargest porti<strong>on</strong>.84
Table 2. Percentage <strong>of</strong> assessment <strong>methods</strong> detecting specific pressures.pressurepercentageOrganic Polluti<strong>on</strong> 48General Degradati<strong>on</strong> 29Morphological Degradati<strong>on</strong> 9Acidificati<strong>on</strong> 9Toxic Substances 5Sampling techniques81. The sampling procedure <strong>of</strong> a large number <strong>of</strong> <strong>methods</strong> applied in m<strong>on</strong>itoringprogrammes using benthic invertebrates is based <strong>on</strong> the Internati<strong>on</strong>al Standard ISO7828 (1985) or the adopted European Norm EN 27828 (1994): Water quality –Methods <strong>of</strong> <strong>biological</strong> sampling - Guidance <strong>on</strong> handnet sampling <strong>of</strong> aquatic benthicmacro-invertebrates. Several <strong>methods</strong> which do not directly refer to theseinternati<strong>on</strong>al standards carry out ‘kick and sweep’ sampling that is regulated bynati<strong>on</strong>al norms/<strong>methods</strong>.82. In general, this technique is the most comm<strong>on</strong> sampling procedure and applied in30 <strong>methods</strong> using a hand-net. The nets used differ in size <strong>of</strong> the opening and mesh.Net-openings specified by the assessment <strong>methods</strong> vary between approximately 600and 900 square centimetres. In half <strong>of</strong> the schemes, animals are retained by meshsizes<strong>of</strong> about 500 µm. Mesh-sizes <strong>of</strong> 1 mm are particularly used in British schemesoperating at family level (Biological GQA, Hungarian adaptati<strong>on</strong> <strong>of</strong> the BMWPscore). Hand-nets <strong>of</strong> less than 350 µm mesh-size are used in <strong>methods</strong> focussing <strong>on</strong>selected orders (e.g. Oligochaetes: Oligochaeta Index for Sediment Bioindicati<strong>on</strong>). Inadditi<strong>on</strong>, small mesh-sizes are in use in some Mediterranean countries (Croatia, Italy,Spain). To sample sandy or silty substrates or sites with large amount <strong>of</strong> detritushydro<strong>biological</strong> sieves are used in Bulgaria with a mesh-size <strong>of</strong> 1.5 mm.83. The procedure <strong>of</strong> quantitative sampling is standardised by the guidance ISO 8265(1988) or EN 28265 (1994): Methods <strong>of</strong> <strong>biological</strong> sampling - Guidance <strong>on</strong> the designand use <strong>of</strong> quantitative samplers for benthic macro-invertebrates <strong>on</strong> st<strong>on</strong>y substratain shallow <strong>freshwater</strong>s. Surber samplers are most comm<strong>on</strong>ly used for quantitative,area-related sampling. The recommendati<strong>on</strong>s <strong>of</strong> this standard for maximum aperture85
size <strong>of</strong> the net range between 250 to 750 µm. The models currently applied in variousnati<strong>on</strong>al watercourse m<strong>on</strong>itoring programmes differ in sampled area (0.01 to 0.12 m²)and mesh-size (100 to 500 µm).84. In deeper streams benthic macroinvertebrates are taken using grabs, dredges andartificial substrates. The applicati<strong>on</strong> <strong>of</strong> these devices is standardised in ISO 9391(1993) or EN ISO 9391 (1995). These are the same standards, as are the previous<strong>on</strong>es, as a result <strong>of</strong> adopti<strong>on</strong> by ISO and CEN. The difference in dates is caused by thedifferent dates <strong>of</strong> publicati<strong>on</strong> by the two organisati<strong>on</strong>s:85. In many European countries large rivers are m<strong>on</strong>itored by utilisati<strong>on</strong> <strong>of</strong>quantitative bottom samplers: Different types such as P<strong>on</strong>ar Grab, Van Veen Grab,Petersen Grab, Birge-Ekman Grab and core samplers are used. All devices sampledefined areas <strong>of</strong> the river bottom ranging from 100 to 500 cm².86. To obtain a qualitative sample <strong>of</strong> the river bed community, dredges representadequate tools in deeper watercourses. Dredges are particularly applied in severalcountries in the Danube catchment (Austria, Bulgaria, Hungary, Romania, Serbia-M<strong>on</strong>tenegro) using mesh-sizes <strong>of</strong> 225 and 500 µm.87. The use <strong>of</strong> artificial substrates allows comparability <strong>of</strong> different sites by providingsimilar habitats is not widely used for m<strong>on</strong>itoring purposes. In m<strong>on</strong>itoring programs<strong>on</strong>ly Moldova (Sapro<strong>biological</strong> assessment based <strong>on</strong> various metrics), Austria(Assessment <strong>of</strong> sapro<strong>biological</strong> quality <strong>of</strong> rivers) and France (I.B.G.N.) employ thesecol<strong>on</strong>isati<strong>on</strong> devices.88. Note that the ISO and CEN standards for sampling invertebrates are currentlyunder revisi<strong>on</strong>. This should make them more WFD compliant, but the timescale forpublicati<strong>on</strong> will inevitable be several years.Sampling frequency89. Sampling frequency in biom<strong>on</strong>itoring programmes using benthic invertebrates asindicators <strong>of</strong> watercourse quality varies from seas<strong>on</strong>al collecti<strong>on</strong>s to proceduresc<strong>on</strong>ducted every five years. Annual sampling is the most comm<strong>on</strong> interval applied inriver m<strong>on</strong>itoring. In particular, programs observing the sapro<strong>biological</strong> water qualityin Latvia, Moldova, Romania and Serbia-M<strong>on</strong>tenegro as well as the nati<strong>on</strong>al Italianm<strong>on</strong>itoring programme based <strong>on</strong> IBE take seas<strong>on</strong>al samples <strong>of</strong> macroinvertebrates.86
This inevitably influences the degree <strong>of</strong> uncertainty <strong>of</strong> the resulting ecologicalclassificati<strong>on</strong>s i.e. the likelihood <strong>of</strong> the banding allocated being accurate.MetricsLevel <strong>of</strong> tax<strong>on</strong>omical resoluti<strong>on</strong>90. The level <strong>of</strong> tax<strong>on</strong>omical resoluti<strong>on</strong> used in watercourse assessment <strong>methods</strong>based <strong>on</strong> macroinvertebrates differs.91. Nearly 60 percent <strong>of</strong> the bioassessment <strong>methods</strong> applied in Europe determine atleast selected orders <strong>of</strong> benthic invertebrates to species- or species groups-level. Thelatter intends to preserve some <strong>of</strong> the species-level informati<strong>on</strong> without the necessityto identify to species (Buffagni, 1997). The remaining approximately 40 percent <strong>of</strong><strong>methods</strong>, identify organisms to genus or family. Table 3 provides an overview <strong>of</strong>tax<strong>on</strong>omical resoluti<strong>on</strong> required in various quality assessment <strong>methods</strong> applied inEurope.Table 3. Tax<strong>on</strong>omical resoluti<strong>on</strong> required by various watercourse assessment <strong>methods</strong>applied in Europe.species-/species groups-levelgenus- and higher levelSaprobic Indices (applied in Austria, Bosnia-Herzegovina, Croatia, Czech Republic, Est<strong>on</strong>ia,Germany, Latvia, Lithuania, Moldova, Romania,Serbia-M<strong>on</strong>tenegro, Slovak Republic, Slovenia)Multimetric Indices (e.g. Austria, Germany andNetherlands)Functi<strong>on</strong>al Indices (PTI – Schöll and Haybach, 2001;LIFE Index – Extence et al., 1999)Acidificati<strong>on</strong> Indices (Germany - Braukmann and Biss,in print; Norway – Raddum, 1999)IOBS (AFNOR, 2002)PERLA (Kokeš et al., 2003)Swedish Benthic Fauna in Lake Littorals and RunningWater (SEPA, 2000)Acidificati<strong>on</strong> Index (Rutt et al., 1990)Belgian Biotic Index (De Pauw and Vanhooren, 1983)BMWP-ASPT Index (Armitage et al., 1983; Alba-Tercedor and Pujante, 2000) applied in Cyprus,Hungary, Spain, Portugal, Poland, United KingdomDanish Stream Fauna Index (Skriver et al., 2000)Extended Biotic Index (Ghetti, 1997)IGBN (AFNOR, 1992)Quality Rating Scheme (McGarrigle et al., 1992)Hellenic Evaluati<strong>on</strong> System (Lazaridou-Dimitriadou etal., 2004)92. Several <strong>methods</strong> demand the identificati<strong>on</strong> <strong>of</strong> genera <strong>on</strong>ly for particular groups <strong>of</strong>organisms (Table 4). The Italian as well as the Belgian index includes all genera <strong>of</strong>the orders Plecoptera, Ephemeroptera, Od<strong>on</strong>ata and the class Hirudinea am<strong>on</strong>gstothers. The identificati<strong>on</strong> <strong>of</strong> selected genera <strong>of</strong> st<strong>on</strong>eflies, gammarids and chir<strong>on</strong>omidsis required by the Danish and Irish schemes primarily mayflies to genera in the latter.In additi<strong>on</strong>, the DSFI comprises indicators <strong>of</strong> the orders megaloptera and coleoptera,and the genus Ancylus. The Irish Quality Rating Scheme c<strong>on</strong>siders individuals <strong>of</strong> a87
water bug genus (Aphelocheirus) and species <strong>of</strong> Baetis rhodani. The British method isbased <strong>on</strong> identificati<strong>on</strong> <strong>of</strong> all genera <strong>of</strong> the family Chir<strong>on</strong>omidae (Ruse, 2000).Table 4. Selected <strong>methods</strong> determining particular organism groups to genus level.MethodBelgian Biotic Index (De Pauw and Vanhooren, 1983)and Biotic Sediment Index (De Pauw and Heylen,2001)Danish Stream Fauna Index (Skriver et al., 2000)Extended Biotic Index (Ghetti, 1997) and Indice aRapporto (Stoch, 1986)Quality Rating Scheme (McGarrigle et al., 1992)Chir<strong>on</strong>omid Pupal Exuviae Technique (Ruse, 2000)Determined generaall genera <strong>of</strong> the phylum/class/order Plathelminthes,Hirudinea, Mollusca, Plecoptera, Ephemeroptera,Od<strong>on</strong>ata, Megaloptera, HemipteraBrachyptera, Capnia, Leuctra, Isogenus, Isoperla,Isoptena, Perlodes, Prot<strong>on</strong>emura, Siph<strong>on</strong>operla,Limnius, Amphinemura, Taeniopteryx, Elmis, Elodes,Ancylus, Asellus, Chir<strong>on</strong>omus, Gammarus, Sialisall genera <strong>of</strong> the class/order Tricladia, Hirudinea,Plecoptera, Ephemeroptera, Od<strong>on</strong>ataLeuctra, Aphelocheirus, Rheotanytarsus, Gammarus,Baetis rhodani, Asellus, Chir<strong>on</strong>omusall genera <strong>of</strong> Chir<strong>on</strong>omidae93. The French Oligochaeta Index for Sediment Bioindicati<strong>on</strong> focuses <strong>on</strong> selectedorders to indicate the quality <strong>of</strong> watercourses combining achievement <strong>of</strong> preciseecological informati<strong>on</strong> through identificati<strong>on</strong> to species or species group level withlow-cost sample processing. In general, this approach allows applicati<strong>on</strong> <strong>of</strong> specificsampling techniques, ensuring maximum coverage <strong>of</strong> the group studied.94. It must be noted that in several assessment <strong>methods</strong> taxa are identified to lowerlevels than required to adequately compute the respective quality index.Record <strong>of</strong> abundance95. In general, there are two alternatives to indicate the abundance <strong>of</strong> particular taxa<strong>of</strong> benthic invertebrates found in the sample: (1) number <strong>of</strong> individuals per area, (2)abundance stated in ranges e.g. logarithmic, (3) abundance not recorded - notrecording is not an estimate <strong>of</strong> abundance.96. The opti<strong>on</strong> with the most substantial informati<strong>on</strong> c<strong>on</strong>tent is the specificati<strong>on</strong> <strong>of</strong> thenumber <strong>of</strong> individuals per area. Nearly 50 percent <strong>of</strong> macroinvertebrate <strong>methods</strong>record the abundance <strong>of</strong> individuals that way. In fact, purely quantitative data requirearea-related sampling procedures by means <strong>of</strong> quadrate samplers, grabs or similardevices. Since these requirements are <strong>on</strong>ly met by a few schemes, abundancestatements based <strong>on</strong> semi-quantitative hand-net sampling are in most cases <strong>of</strong>restricted reliability but they are cheap, practical and.effective.88
97. The use <strong>of</strong> range values to record individual occurrence allows the estimati<strong>on</strong> <strong>of</strong>taxa abundance. Compared to the first opti<strong>on</strong>, this alternative is time saving becausean exact count <strong>of</strong> individual organisms is not necessary. Different abundanceclassificati<strong>on</strong> schemes are in use, the most comm<strong>on</strong> are listed in Table 5.98. The 3-class scheme derives from the well-known publicati<strong>on</strong> <strong>of</strong> Pantle and Buck(1955) and is mostly used in eastern European countries applying the Saprobic Index(Bosnia-Herzegovina, Croatia, Slovenia).99. Two systems to classify abundance in a five-fold scheme exist in Europe: Theclasses <strong>of</strong> the British system are based <strong>on</strong> a logarithmic scale <strong>of</strong> organisms’abundance (Murray-Bligh, 1999). Different from this is the allocati<strong>on</strong> <strong>of</strong> classes in theQuality Rating System as applied by Bulgaria. Here, the presence <strong>of</strong> more than 100individuals <strong>of</strong> a certain tax<strong>on</strong> is assigned to the highest class. Hungary specifiesrelative taxa abundance <strong>of</strong> a sample (five metres secti<strong>on</strong> kicked for 15 minutes). Otherschemes do not specify numerical boundary values but provide <strong>on</strong>ly verbaldescripti<strong>on</strong>s <strong>of</strong> abundance classes (e.g. McGarrigle et al., 1992).100. In German watercourse bioassessment abundance is stated in seven classes.Established by Knöpp (1955) this classificati<strong>on</strong> has been included in the Germanstandard DIN 38 410 (1990, 2003): Determinati<strong>on</strong> <strong>of</strong> Saprobic Index <strong>of</strong> RunningWaters. Bey<strong>on</strong>d its broad applicati<strong>on</strong> in Germany, <strong>methods</strong> in Serbia-M<strong>on</strong>tenegro,Slovakia and Switzerland operate <strong>on</strong> the basis <strong>of</strong> a seven-class abundance scheme.101. Assessment <strong>methods</strong> operating <strong>on</strong> the basis <strong>of</strong> presence/absence data <strong>of</strong>macroinvertebrate taxa do not necessarily need to record taxa abundance. Many bioticindices like I.B.G.N. (France, Luxembourg), IBE (Italy), BMWP-ASPT (e.g. Cyprus,Portugal, Spain, United Kingdom) or BBI (Belgium) are not designed to includeabundance informati<strong>on</strong>. Their outputs may be biased by single organisms drifting intothe sample from upstream reaches. Therefore, the individual systems prescribe toinclude <strong>on</strong>ly taxa that exceed a certain threshold <strong>of</strong> abundance to avoid false results.89
Table 5. Comm<strong>on</strong> abundance classificati<strong>on</strong> schemes used in European watercourseassessment <strong>methods</strong> based <strong>on</strong> benthic invertebratesclass number <strong>of</strong> organisms descripti<strong>on</strong>3-classscheme(Pantle andBuck,1955)1 1 – 10 sporadic3 10 – 100 frequent5 > 100 in massesBulgarian Standard Murray-Bligh (1999) McGarrigle (1992)5-class scheme1 1 – 5 1 – 9 usually absent2 6 – 20 10 – 99 sparse or absent3 21 – 50 100 – 999 present in small numbers4 51 – 100 1,000 – 9,999 comm<strong>on</strong>5 > 100 10,000 + well represented or dominant1 1 single2 2 – 20 sparse7-class schemeKnöpp (1955)3 21 – 40 sparse to medium4 41 – 80 medium5 81 – 160 medium to abundant6 161 – 320 abundant7 > 320 in massesAssessment102. The assessment <strong>of</strong> the <strong>biological</strong> quality <strong>of</strong> running waters is based <strong>on</strong> theanalysis <strong>of</strong> measurable attributes <strong>of</strong> the biotic envir<strong>on</strong>ment. According to the type andscope <strong>of</strong> measured parameters (“metrics“) different categories <strong>of</strong> assessment <strong>methods</strong>can be distinguished (Knoben et al., 1995; Verd<strong>on</strong>schot, 2000):103. Biotic Indices integrate taxa richness and polluti<strong>on</strong> tolerance metrics. Thebasic principle <strong>of</strong> this approach is the assumpti<strong>on</strong> that taxa showing differentsensitivity to disturbance disappear in a certain order as the pressure increases. Inadditi<strong>on</strong>, the number <strong>of</strong> tax<strong>on</strong>omic groups is reduced.104. Extended by abundance informati<strong>on</strong> Saprobic Indices represent specific modes<strong>of</strong> biotic scores. Based <strong>on</strong> the work <strong>of</strong> Kolkwitz and Marss<strong>on</strong> (1902; 1908; 1909)saprobic systems have been revised with regard to quality classificati<strong>on</strong> and90
presentati<strong>on</strong> (Liebmann, 1962), calculati<strong>on</strong> (Pantle and Buck, 1955), indicati<strong>on</strong>(Zelinka and Marvan, 1961) and general scientific framework (Sládeek, 1973). Dueto these modificati<strong>on</strong>s different specificati<strong>on</strong>s <strong>of</strong> the system exist. In Europe 15countries apply Saprobic Indices using different quality elements, class boundaries,indicator lists and calculati<strong>on</strong> formulas. The Saprobic System has been a standardmethod in former COMECON countries. Thus, its applicati<strong>on</strong> is especiallywidespread in the Danube River Basin.105. Apart from detecti<strong>on</strong> <strong>of</strong> organic polluti<strong>on</strong> biotic indices are used to assessacidificati<strong>on</strong> <strong>of</strong> watercourses. The indices applied in Germany (Braukmann and Biss,in print), Norway (Raddum, 1999), Est<strong>on</strong>ia and Sweden (SEPA, 2000) differentiatediverse macroinvertebrate groups <strong>of</strong> gradual sensitivity to acidificati<strong>on</strong>. Organismsbel<strong>on</strong>ging to the same indicator group are summed to determine the acidity-class byexceeding a specific frequency-threshold.106. Diversity Indices combine measurement <strong>of</strong> taxa richness and abundance. Inn<strong>on</strong>-multimetric assessment they are exclusively applied in c<strong>on</strong>necti<strong>on</strong> with scientificm<strong>on</strong>itoring programmes to obtain an integrative picture <strong>of</strong> community structure.Especially, Shann<strong>on</strong> and Weaver (1949) and Simps<strong>on</strong> (1949) diversity are calculated.Results are not directly included in quality classificati<strong>on</strong>.107. Compared to Biotic Indices, which are usually stressor-specific and useful inm<strong>on</strong>itoring water quality changes when the cause <strong>of</strong> the disturbance is known(Johns<strong>on</strong> 1995), Predictive Assessment <strong>of</strong>fers an evaluati<strong>on</strong> focusing <strong>on</strong> shifts in thecompositi<strong>on</strong> <strong>of</strong> entire species communities. Hence, it allows the detecti<strong>on</strong> <strong>of</strong> impacts<strong>on</strong> stream biota caused by any kind <strong>of</strong> pressure, but provides no informati<strong>on</strong> <strong>on</strong> thetype <strong>of</strong> pressure acting. The British RIVPACS System (Wright et al., 2000) is aPredictive Assessment scheme based <strong>on</strong> multivariate analysis techniques. Toimplement the scheme, <strong>biological</strong> data <strong>of</strong> different reference sites have been classifiedaccording to their species assemblage. These classes have been related to a series <strong>of</strong>envir<strong>on</strong>mental watercourse attributes. Based <strong>on</strong> these variables the undisturbedspecies community can be predicted at any site and compared to the communityobserved at this site. Results are presented as Ecological Quality Ratios (EQRs). TheCzech PERLA system (Kokeš et al., 2003) represents a modificati<strong>on</strong> <strong>of</strong> RIVPACSadapted to Czech c<strong>on</strong>diti<strong>on</strong>s.91
108. Process Assessment focuses <strong>on</strong> evaluati<strong>on</strong> <strong>of</strong> tax<strong>on</strong> characteristics such asfuncti<strong>on</strong>al groups and species traits. The Lotic-invertebrate Index for Flow Evaluati<strong>on</strong>(LIFE) assesses the impact <strong>of</strong> variable flows due to regulati<strong>on</strong> or augmentati<strong>on</strong> <strong>on</strong>benthic populati<strong>on</strong>s. Every regularly encountered invertebrate species and family <strong>of</strong>Britain has been assigned to <strong>on</strong>e <strong>of</strong> six groups which are related to certain flowc<strong>on</strong>diti<strong>on</strong>s.109. The definiti<strong>on</strong> <strong>of</strong> distinct reference communities as basis <strong>of</strong> assessment forlarge watercourses is difficult due to substantial anthropogenic influence and theoccurrence <strong>of</strong> newcomer species occupying ecological niches. Here, the c<strong>on</strong>cept <strong>of</strong>Process Assessment is suitable as it appraises the performance <strong>of</strong> ecological functi<strong>on</strong>srather than the presence <strong>of</strong> individual species. The Potam<strong>on</strong>-Characterisati<strong>on</strong>-Index(PTI) thus operates <strong>on</strong> the basis <strong>of</strong> an “open“ tax<strong>on</strong> list in which all species showingpreference to potamal habitats are indicators <strong>of</strong> high quality. By definiti<strong>on</strong> newcomershave low ecological values.110. Rapid Bioassessment represents a combinati<strong>on</strong> <strong>of</strong> <strong>biological</strong> and habitatquality assessment emphasising a low-cost approach through reduced sampling andefficient data analysis. Investigati<strong>on</strong> <strong>of</strong> both biotic and habitat features aims atobtaining an integrated ecological watercourse assessment. In Europe the <strong>on</strong>ly RapidBioassessment Protocol in current usage is the Spanish ECOSTRIMED method, whichcomprises the Spanish modificati<strong>on</strong> <strong>of</strong> the BMWP score.111. A fundamental c<strong>on</strong>cept <strong>of</strong> Multimetric Assessment is to analyse communityhealth composed <strong>of</strong> community structure, community balance and functi<strong>on</strong>al feedinggroups (Barbour et al., 1992). In this c<strong>on</strong>text it represents an integrative approach towater quality assessment combining various metrics like Biotic, Saprobic andDiversity Indices, and Process Assessment measures.112. Within the European research project AQEM (“The Development and Testing<strong>of</strong> an Integrated Assessment System for the Ecological Quality <strong>of</strong> Streams and Riversthroughout Europe using Benthic Macroinvertebrates”) multimetric assessmentsystems using benthic invertebrates have been developed for a limited number <strong>of</strong>stream types in Austria, Czech Republic, Germany, Greece, Italy, Netherlands,Portugal and Sweden (AQEM C<strong>on</strong>sortium, 2002). Based <strong>on</strong> this experience, Germany(Meier et al., in print) and Austria are implementing multimetric assessment at a92
nati<strong>on</strong>al level in 2005. In Luxemburg and Serbia (Tripkovi, 2003) studies to test theAQEM approach have been undertaken or are planned, respectively.113. Comprehensi<strong>on</strong> <strong>of</strong> all essential abiotic and biotic comp<strong>on</strong>ents c<strong>on</strong>stituting thestream ecosystem is aim <strong>of</strong> Ecosystem Comp<strong>on</strong>ents Assessment. In this approachvarious factors affecting the characteristics <strong>of</strong> running waters are involved.Additi<strong>on</strong>ally, the outputs <strong>of</strong> assessment directly support water managers in decisi<strong>on</strong>making.114. In the Netherlands the General method for ecosystem descripti<strong>on</strong> andassessment (AMOEBE) relates physical, chemical and <strong>biological</strong> variables <strong>of</strong> largewater bodies to reference c<strong>on</strong>diti<strong>on</strong>s to derive politically passable target values. Aspecial feature is the integrative visualisati<strong>on</strong> <strong>of</strong> the different parameters.115. The System for Evaluating Rivers for C<strong>on</strong>servati<strong>on</strong> (SERCON) is used toidentify important rivers for c<strong>on</strong>servati<strong>on</strong> and to m<strong>on</strong>itor river rehabilitati<strong>on</strong> schemes.SERCON focuses <strong>on</strong> the physical, chemical and <strong>biological</strong> features <strong>of</strong> river channelsand banks, riparian z<strong>on</strong>es and associated floodplains, and includes catchmentcharacteristics like land-use and human populati<strong>on</strong> density. The system evaluates data<strong>of</strong> 35 attributes, grouped within six c<strong>on</strong>servati<strong>on</strong> criteria: Physical Density,Naturalness, Representativeness, Rarity, Species Richness and Special Features.FISH116. A short descripti<strong>on</strong> <strong>of</strong> the <strong>methods</strong> currently in use and those developed withinthe FAME project is given below.‘Index <strong>of</strong> Biotic Integrity’ (IBI)117. First developed in North America by Karr (1981) the c<strong>on</strong>cept has beenadapted to regi<strong>on</strong>al c<strong>on</strong>diti<strong>on</strong>s in Europe (Belpaire et al., 2000; Kesminas (2000)Appelberg et al., 2002; Oberdorff et al., 2002; Schager and Peter, 2002).118. Most IBI developed world-wide and applied in European countries havepreserved the four original categories: 1, species compositi<strong>on</strong> and diversity, 2, trophiccompositi<strong>on</strong>, 3, fish abundance and 4, reproducti<strong>on</strong> and c<strong>on</strong>diti<strong>on</strong>.119. The <strong>methods</strong> below are IBI fish based <strong>methods</strong> from the FAME project:93
Austria120. MuLFA: Ecological Integrity Assessment Method <strong>of</strong> Melcher and SchmutzMethod proposed by Schmutz et al. (2000) as a multilevel c<strong>on</strong>cept for fish based,river-type-specific assessment <strong>of</strong> ecological integrity (EI) in Austria. This methodtargets the assessment <strong>of</strong> general degradati<strong>on</strong>, through the following metrics: speciesdiversity (type-specific species, species with self-sustaining populati<strong>on</strong>s), speciescompositi<strong>on</strong> (fish regi<strong>on</strong>, number <strong>of</strong> guilds, guild compositi<strong>on</strong>), populati<strong>on</strong> size(density and biomass), reproductive success and recruitment (populati<strong>on</strong> agestructure). Reference c<strong>on</strong>diti<strong>on</strong>s are estimated from historical abiotic and fish data,data <strong>of</strong> reference sites and models. Five levels <strong>of</strong> ecological integrity (EI) and theirdegradati<strong>on</strong> corresp<strong>on</strong>d to the normative definiti<strong>on</strong>s <strong>of</strong> ecological status developedwithin the WFD.Belgium121. IBIP (Wall<strong>on</strong>ia): A fish based index developed for assessment <strong>of</strong> loticecosystem in Wall<strong>on</strong>ia by Kestem<strong>on</strong>t et al. (2000). This method retained the metrics<strong>of</strong> the original IBI (12 metrics) but modifying it to be applicable to the Meuse basin.The metrics were classified into 4 broad categories: species richness and compositi<strong>on</strong>,trophic compositi<strong>on</strong>, fish abundance, and reproductive functi<strong>on</strong>. For a given samplingsite, each metric received a score ranging from <strong>on</strong>e to five points, according to thelevel <strong>of</strong> similarity (low = 1, high = 5) <strong>of</strong> its value to that expected for a fishassemblage experiencing little human influence. The total IBI score was the sum <strong>of</strong>the 12 metric scores and ranged from 12 (worst) to 60 (best). Rati<strong>on</strong>ale for theselecti<strong>on</strong> <strong>of</strong> the 12 metrics has been described in Didier (1997) and Kestem<strong>on</strong>t et al.(2000).122. IBI (for upstream brooks used in Flanders): a method developed by Breine andBelpaire (submited) using a fish dataset from electric fishing surveys in Flandersduring the period 1994-2000. A total <strong>of</strong> 154 sites bel<strong>on</strong>ging to the grayling and troutz<strong>on</strong>e were used to develop a multimetric index to assess upstream brooks in Flanders.All sites had a slope <strong>of</strong> at least 3‰ and a maximum width <strong>of</strong> 4.5 m. The developedIBI c<strong>on</strong>sists <strong>of</strong> a set <strong>of</strong> metrics scored from 0 to 5. These metrics were selected usingunivariate and multivariate analyses, taking into account ecological criteria. Some <strong>of</strong>the selected metrics correlate significantly with the slope <strong>of</strong> the river. Threshold94
values for correlated metrics were defined using the mean trend line through allmetric values. If no significant correlati<strong>on</strong> existed scoring criteria were defined usingthe literature. Five integrity classes were defined. The IBI was tested internally bycomparing the IBI scores and the attributed habitat quality scores. A similarcomparis<strong>on</strong> was d<strong>on</strong>e using an independent set <strong>of</strong> data <strong>of</strong> known habitat quality. Theindividual c<strong>on</strong>tributi<strong>on</strong> <strong>of</strong> the selected metrics was assessed. The developed IBIclearly distinguishes good sites from impacted sites and can separate the heavilyimpacted sites from the fairly impacted. The IBI meets the criteria imposed by theEuropean Water Framework Directive.France123. FBI : Oberdorff et al. (2001) developed a 7 metrics index that can be appliedin different regi<strong>on</strong>s and river types <strong>of</strong> France despite the complex and heterogeneousgeology and climate <strong>of</strong> this country.Germany124. FiBS: A multimetric method for the assessment <strong>of</strong> the ecological status <strong>of</strong>rivers using fish assemblages (Dussling et al. 2004). The method is based <strong>on</strong> thecomparis<strong>on</strong> <strong>of</strong> recent fish samples with rec<strong>on</strong>structed type specific reference fishcommunities. For that purpose in total 18 metrics were selected, which can becategorized into six ecological quality features as follows: inventory <strong>of</strong> species andguilds; abundance <strong>of</strong> species and guilds; age structure; migrati<strong>on</strong> (index-based); fishregi<strong>on</strong> (index-based); dominant species (index based).125. The assessment <strong>of</strong> the ecological river-status with FiBS comprises three steps.In a first step, all metrics are scored according to defined criteria following theapproach <strong>of</strong> the IBI (Karr, 1981). In a sec<strong>on</strong>d step, an assessment <strong>of</strong> each <strong>of</strong> the sixecological quality features is carried out. Finally, in a third step, the overallclassificati<strong>on</strong> <strong>of</strong> the referring sampling site is performed by an algorithm calculating aweighted average from the six quality features assessed. Since 2004, FiBS is beentested nati<strong>on</strong>-wide.95
Sweden126. Swedish fish Index: Appelberg et al (2000) proposed a set <strong>of</strong> metrics based <strong>on</strong>standardised fish sampling, for assessing envir<strong>on</strong>mental disturbances in fishcommunities in Swedish lakes and streams. Reference values for the fish communitymetrics and scoring criteria in relati<strong>on</strong> to regi<strong>on</strong>al and local envir<strong>on</strong>ments wereestimated, using two comprehensive nati<strong>on</strong>al databases comprising fish communitydata from lakes and streams. In c<strong>on</strong>cordance with Minns et al. (1994), the databaseswere assumed to comprise both degraded and reference habitats.English127. IBI: Rahman et al. (2002) developed an index to assess ecological integrity inlowland rivers. The same IBI is also used in other countries as Finland, Italy,Lithuania, Netherlands, Spain and Switzerland.Other Fish Methods128. Czech Republic - Fish Stock assessment CEN/TC 230/WG 2/TG 4N (2001)Water analysis – Sampling <strong>of</strong> Fish with electricity. Revisi<strong>on</strong> <strong>of</strong> Pr EN 14011. 25.October 2001129. Denmark - Udvidet biologisk program. Skriver, J et al (1999)130. Finland - A fish based index for classificati<strong>on</strong> <strong>of</strong> the ecological status <strong>of</strong> riversis under development. In fish sampling <strong>of</strong> rivers, electr<strong>of</strong>ishing according to SFS –EN 14011 (Water analysis – sampling <strong>of</strong> fish with electricity is applied.131. France - Indice Poiss<strong>on</strong> en Riviere (FBI). Oberdorff, T et al (1992)132. Italy – Ichthyological Index (I.I. “Indice Ittico”). Lodi, E. Badino, G. (1993)Austria133. Several fish sampling <strong>methods</strong> are currently used in Austria. The main<strong>methods</strong> are electric fishing (in wadable streams or rivers), electric fishing from aboat, seining, gillnetting and l<strong>on</strong>g-lines (in large rivers, such as The Danube). Inwadable rivers, the number <strong>of</strong> electric fishing devices and the number <strong>of</strong> anodes aredependent <strong>on</strong> river width. Autumn is the preferred sampling seas<strong>on</strong> in wadable rivers.96
In n<strong>on</strong>-wadable or large rivers, the main sampling seas<strong>on</strong> is also in autumn, but alsoin the summer in the Danube.Belgium – Flanders134. The fish populati<strong>on</strong> surveys are standardised both for wadable and n<strong>on</strong>wadablerivers. The principal method <strong>of</strong> fish sampling is electric fishing, but other<strong>methods</strong> such as gillnets, seine netting or fyke nets are also used in large rivers, and insome specific water systems (e.g. in Polder drainage systems).135. In wadable rivers, the number <strong>of</strong> electric fishing devices and the number <strong>of</strong>anodes are dependent <strong>on</strong> river width, from 1 anode for river width smaller than 1.5 mto 4 anodes for rivers <strong>of</strong> 6-8 m wide. Electric fishing is performed in an upstreamdirecti<strong>on</strong>. At each stati<strong>on</strong> (sampled area = 100 m l<strong>on</strong>g), a maximum <strong>of</strong> 200 specimens<strong>of</strong> each species are individually weighed and measured). Captures by fyke nets, seinenetting and/or gill nets are sometimes used to complement the electric fishingcaptures, principally in standing waters (channels).Belgium – Wall<strong>on</strong>ia136. Despite the absence <strong>of</strong> a regular fish-m<strong>on</strong>itoring programme defined at theregi<strong>on</strong>al level, several instituti<strong>on</strong>s (Universities, public administrati<strong>on</strong> resp<strong>on</strong>sible <strong>of</strong>natural resource management) perform frequent fish sampling operati<strong>on</strong>s in Wall<strong>on</strong>ia.Electric fishing is used by all instituti<strong>on</strong>s, with relatively similar, but not standardised,sampling procedure. In additi<strong>on</strong>, fish capture data obtained with gill nets, seinenetting, fake nets or fish pass c<strong>on</strong>trol are also compiled in the regi<strong>on</strong>al fish database.137. In rivers, electric fishing is performed over a distance <strong>of</strong> 150-350 m,regardless <strong>of</strong> river width, with 1-3 passages depending <strong>on</strong> sampling objectives andinstituti<strong>on</strong>s. Stop nets are used as far as possible, but if the water flow is too high orthe river too wide, sampling areas are selected in such a way that natural barriers(small weirs or very shallow riffles) delimit the prospected z<strong>on</strong>es. The preferredsampling seas<strong>on</strong>s are summer and autumn.138. In n<strong>on</strong>-wadable rivers, electric fishing and horiz<strong>on</strong>tal bottom gill nettechniques are combined. Electric fishing is performed from a boat, in an upstream ordownstream directi<strong>on</strong> al<strong>on</strong>g both banks, by a staff <strong>of</strong> 4 pers<strong>on</strong>s including the anodeoperator. Both electric fishing and gill netting are usually performed during daylight,97
ut comparis<strong>on</strong>s have been made with sampling performed during the night,indicating that the abundance, frequency and size <strong>of</strong> species caught vary greatlybetween day and night. Additi<strong>on</strong>al techniques <strong>of</strong> fish sampling in n<strong>on</strong>-wadable riversinclude seining (used in straight canals with width less than 30 m), fyke nets (inc<strong>on</strong>necti<strong>on</strong> between main channel and backwaters), and c<strong>on</strong>trol <strong>of</strong> fish pass and sportangler catches.France139. Electric fishing is the usual method <strong>of</strong> fish sampling employed nati<strong>on</strong>-wide.The preferred seas<strong>on</strong> for sampling is autumn, but sampling in small and mediumsizedwadable rivers is also performed in late spring and summer.140. In streams, fishing is c<strong>on</strong>ducted over the whole river width, moving fromdownstream to upstream. The sampling area is delimited by two stop nets. During <strong>on</strong>epassage (or more), several anodes depending <strong>on</strong> the river width) are moved in thewater and followed by hand-nets (4mm-mesh size) for collecting fishes. Each anode isgenerally followed by 2 hand with suitable vessels for transporting fish.141. In wadable rivers, several sampling protocols have been successively tested:the first <strong>on</strong>e was implemented in 1981. The procedure c<strong>on</strong>sisted <strong>of</strong> “c<strong>on</strong>tinuous banksampling”, the sec<strong>on</strong>d protocol used is “point abundance sampling” (Persat and Copp,1990) and the third protocol was introduced in 1995 and derives from Pouilly (1994)and Capra (1995) and is called “ambience sampling”.Germany142. A standardised German river m<strong>on</strong>itoring system has never been establisheddue to the special situati<strong>on</strong> in Germany where inland fisheries is under theresp<strong>on</strong>sibility <strong>of</strong> Federal States. Each Federal State has its own river m<strong>on</strong>itoringprogrammes and maintains their own database. Only for some large rivers as Rhine orElbe are fish m<strong>on</strong>itoring systems coordinated by the affected Federal States orcountries. For example, the Federal State <strong>of</strong> Baden-Wuerttemberg use the followsampling procedures:143. In wadable rivers, electric fishing is performed using a DC 1,5-7 KW electricgenerator. For a given site, the sampling area is at least 100 m in small headwaterstreams and increases with increasing size and habitat complexity <strong>of</strong> the sampled98
iverin order to obtain a representative sample. One passage is performed. Stop netsare not usually used, but are used in some specific cases. The preferred seas<strong>on</strong> forelectric fishing extends from late summer to early autumn.144. In n<strong>on</strong>-wadable rivers, electric fishing is performed from a boat, usually by 4pers<strong>on</strong>s, with a 7 KW DC generator. The representative method is used.Greece145. In Greece, there is no nati<strong>on</strong>-wide system <strong>of</strong> fish data collecti<strong>on</strong>, and,therefore, there are no nati<strong>on</strong>ally standardised sampling <strong>methods</strong>. The collecti<strong>on</strong> <strong>of</strong>fish data allowing the evaluati<strong>on</strong> <strong>of</strong> the type and magnitude <strong>of</strong> impacts <strong>on</strong> the aquaticenvir<strong>on</strong>ment has never been a sampling objective. As a c<strong>on</strong>sequence, samplingtechniques have not been appropriately standardised for purposes <strong>of</strong> water qualityassessments.146. Although samples have been collected with a variety <strong>of</strong> fishing techniques(gill nets, seine netting, fyke nets, fry nets, fish pass c<strong>on</strong>trol, etc.), electric fishing hasalways been a basic comp<strong>on</strong>ent <strong>of</strong> all riverine investigati<strong>on</strong>s. Data exclusively fromwadable rivers, collected in spring if the investigati<strong>on</strong> is targeted to aspects <strong>of</strong>reproducti<strong>on</strong> and early life stages and in late summer or autumn if the target is thestudy <strong>of</strong> human impacts and threats to endangered species. DC electric generators(300-600 V) are used. The usual sampling practice is <strong>on</strong>e pers<strong>on</strong> operating the anodeproceeds upstream (sampling stretches <strong>of</strong> 40-100 m) and <strong>on</strong>e or two other pers<strong>on</strong>swith hand-nets follow behind. One passage is performed, and no stop nets are used.Lithuania147. Several sampling gears are currently used in Lithuania. The most extensivelyused method is electric fishing, representing 88% <strong>of</strong> the sampling sites, 54% bywading and 34% from a boat. Other <strong>methods</strong> include stati<strong>on</strong>ary gill netting, and theuse <strong>of</strong> drift and dragnets.148. In wadable rivers, electric fishing is performed with a 600 V PDC battery,usually involving 3 pers<strong>on</strong>s <strong>of</strong> whom <strong>on</strong>e operates the anode. The sampling intensitydepends <strong>on</strong> the river size. Usually, <strong>on</strong>e site per 10 km length river segment isinvestigated, with the sampling site covering 100-200 m. For each site, 1-3 passagesare performed (in most cases 2 passages) and no stop nets are used. The preferred99
seas<strong>on</strong>s for sampling are summer and autumn. In n<strong>on</strong>-wadable rivers, electric fishing,gill nets, drift nets and dragnets are used. Electric fishing is performed from a boat,and secti<strong>on</strong>s <strong>of</strong> about 3 m wide and 100-200 m l<strong>on</strong>g al<strong>on</strong>g the banks are sampled.When floating nets are used, about 2 km length segments <strong>of</strong> the main river channelare fished. Bottom gill nets (35-40 m l<strong>on</strong>g for each mesh size, ranging from 14-60mm) are set overnight, for about 10 h.Poland149. There is no systematic m<strong>on</strong>itoring programme for fish fauna in Polish rivers.There are some proposals as to how to c<strong>on</strong>duct such a m<strong>on</strong>itoring programme andwhich instituti<strong>on</strong> can be mainly involved in it. Up to now the Polish AnglersAssociati<strong>on</strong> is the main instituti<strong>on</strong> that collects fish fauna data from the whole Poland.But not all <strong>of</strong> them can be easily used used as a basis for m<strong>on</strong>itoring according topurposes <strong>of</strong> WFD framework.150. Electric fishing is the main sampling method used in Poland for assessing fishcommunity compositi<strong>on</strong> in rivers. Sampling intensity and sampling area aredependent <strong>on</strong> river size. Sampling is usually performed seas<strong>on</strong>ally, from spring toautumn.Portugal151. All data are obtained by electric fishing, 90% from wadable rivers and 10%from a boat, in large rivers.152. In wadable rivers, each site is selected in order to sample a representativesequence <strong>of</strong> habitats (riffle, run and pool). A single passage is performed in upstreamdirecti<strong>on</strong>, without stop nets.Sweden153. Electric fishing is the main sampling method used in Sweden, <strong>on</strong>ly by wading.Stati<strong>on</strong>ary gill nets are occasi<strong>on</strong>ally used in wide river bays.154. The sampling strategy is a standardised, representative <strong>on</strong>e, based <strong>on</strong> thesuccessive removal <strong>of</strong> fish, with 3 passages per sampling site (length <strong>of</strong> the samplingstretch = 30-70 m). The preferred seas<strong>on</strong> is late summer-early autumn (Aug-Sept).The Netherlands100
155. Fish sampling is performed mainly in large lowland rivers (100-300 m wide).Electric fishing (PDC generator, 300 V, 5A) is usually performed from a boat, al<strong>on</strong>gthe banks, by a staff <strong>of</strong> 3 pers<strong>on</strong>s. The prospected area averages 1000 m 2 , e.g. 500 ml<strong>on</strong>g, 2 m wide al<strong>on</strong>g the banks, where the mean water depth is 0.8 m. The preferredseas<strong>on</strong> for electric fishing is from late autumn to early spring. Other techniques,including trawling, fyke and frame nets, are also used in large lowland rivers. Thepreferred seas<strong>on</strong> for trawling extends from April to October. On the other hand, fykeand frame nets are preferably used from spring (April) to autumn (November). Nets <strong>of</strong>5-20 m l<strong>on</strong>g are set <strong>on</strong> the bottom <strong>of</strong> lowland rivers, at a depth <strong>of</strong> 3 m for periodsranging from 12 to 154 h.United Kingdom156. The specific equipement and strategies used are generally regi<strong>on</strong> and sitedependent. Electric fishing is the most comm<strong>on</strong> sampling method used although thegear specificati<strong>on</strong>s, technique <strong>of</strong> applicati<strong>on</strong> and man-power used has been variablebetween Envir<strong>on</strong>mental Agency (EA) area teams. The review <strong>of</strong> the EA M<strong>on</strong>itoringProgramme and recent R&D programmes have attempted to standardise the samplingstrategy and <strong>methods</strong> used for each element <strong>of</strong> the new m<strong>on</strong>itoring programme whilstretaining some flexibility in approach to allow for evoluti<strong>on</strong>. The review is also takingfull c<strong>on</strong>siderati<strong>on</strong> <strong>of</strong> CEN requirements.157. Electric fishing surveys are usually carried out in summer m<strong>on</strong>ths, postspawning seas<strong>on</strong> (June - October). However, some regi<strong>on</strong>al and site-specific variati<strong>on</strong>occurs depending up<strong>on</strong> the purpose <strong>of</strong> the surveys, the accessibility <strong>of</strong> the site and thec<strong>on</strong>diti<strong>on</strong>s for efficient sampling, e.g. weed growth. The new sampling programmehas proposed <strong>methods</strong> to suit different sampling data requirements, different habitatc<strong>on</strong>diti<strong>on</strong>s and the manpower required to undertake them.Agencies in Scotland andNorthern Ireland are working closely with the EA in developing standardize fishassessment <strong>methods</strong>.101
102
Annex VI: Standardizati<strong>on</strong> process and CEN standards relevant tothe WFDA. THE STANDARDIZATION PROCESS1. The process <strong>of</strong> elaborating CEN standards is shown schematically in Figure 1.Essentially this can be broken down into two distinct phases:i. The elaborati<strong>on</strong> <strong>of</strong> an advanced working draft. At this stage the comments <strong>of</strong>interested experts, including those working with ECOSTAT, the relevantcommissi<strong>on</strong>s and the broader scientific community, are welcomed directly. Thisbroad peer review with external experts c<strong>on</strong>tinues through to the submissi<strong>on</strong> <strong>of</strong>the working document as a draft prEN (project European Norm).ii. When the working draft is submitted to the CEN/TC 230 Secretariat as a draftprEN it becomes an <strong>of</strong>ficial document covered by CEN copyright. Subsequentcirculati<strong>on</strong>s are through the nati<strong>on</strong>al member bodies and all comments fromnati<strong>on</strong>al experts are fed back <strong>of</strong>ficially through the same route and in an <strong>of</strong>ficialformat.2. The direct involvement <strong>of</strong> ECOSTAT and other experts is restricted to the firststage. Subsequent involvement <strong>of</strong> ECOSTAT experts can be most successfullymanaged through the nati<strong>on</strong>al member (standards) bodies in individual countries.3. Voting <strong>on</strong> a new work item is by weighted majority and at least 5 member bodiesmust agree to have a practical involvement through nominated nati<strong>on</strong>al experts. WG 2now requires the completi<strong>on</strong> <strong>of</strong> (1.) before requesting a new work item <strong>on</strong> theassumpti<strong>on</strong> that the working document can be circulated with the new work itemproposal (NWIP). The text can then be submitted for CEN <strong>of</strong>ficial procedure as so<strong>on</strong>as the NWIP is approved, such are the time c<strong>on</strong>straints imposed by the CEN CentralSecretariat.103
C<strong>on</strong>sultati<strong>on</strong> open to ECOSTAT &interested expertsTime frame variableInformalproposalAdvancedworkingdocumentNewWorkItemproposal3 year limit imposed by CENbey<strong>on</strong>d here for publicati<strong>on</strong>FormalvotePrEN vote&c ommentsDraftprENComments <strong>on</strong> draft <strong>on</strong>ly throughNati<strong>on</strong>al Member bodyFigure 1. Stages involved in developing a European Norm in CEN.4. At the draft prEN stage CEN/TC 230 including member (standardizati<strong>on</strong>) bodiesare asked to approve the document for prEN voting within 6 weeks. At this stage thevote is either yes or no, but inevitably some comments are received but usually theseare c<strong>on</strong>sidered following the subsequent prEN voting stage.5. At the prEN voting stage, member bodies c<strong>on</strong>sult nati<strong>on</strong>al experts and will votepositively or negatively and provide comments. Where votes are negativeexplanati<strong>on</strong>s for the vote are given.6. All comments received are collated by the relevant task group c<strong>on</strong>venor and an<strong>of</strong>ficial resp<strong>on</strong>se to each and every comment must be given. Comments may begeneral, editorial or technical. These may be accepted or rejected but each and everycomment must be resp<strong>on</strong>ded to giving a reas<strong>on</strong>, where necessary, for rejecti<strong>on</strong>. Thesecomments and the resp<strong>on</strong>ses are circulated with a revised text following the prENstage. Every effort is made to reach c<strong>on</strong>sensus including delaying further procedureuntil outstanding issues can be discussed and resolved at a task group meeting,bearing in mind that meetings are usually <strong>on</strong>ly held annually.7. At the formal vote stage voting is either positive or negative. No further commentsare acceptable with the possible excepti<strong>on</strong> <strong>of</strong> minor editorial changes. Voting at theprEN and formal vote stage are by weighted majority.104
8. Standards, which receive positive support at the formal vote stage, are publishedin the Official Journal <strong>of</strong> the European Uni<strong>on</strong>. At this stage they are automatically theEU reference method and must be published by the nati<strong>on</strong>al member bodies, unlikeISO standards where publicati<strong>on</strong> is discreti<strong>on</strong>ary. CEN does not publish its ownstandards. This is d<strong>on</strong>e through the nati<strong>on</strong>al member bodies.9. The whole process between the acceptance <strong>of</strong> the new work item (NWI) and theformal vote must be completed within 3 years.B. PUBLISHED CEN STANDARDS RELEVANT TO THE IMPLEMENTATION OFTHE WFD AND THE INTERCALIBRATION PROCESS10. A number <strong>of</strong> EN standards exist that are directly relevant to the implementati<strong>on</strong> <strong>of</strong>the WFD and these are tabulated in Table 1.11. Several features <strong>of</strong> this tabulati<strong>on</strong> should be noted. Firstly, not all <strong>of</strong> the standardslisted were elaborated in CEN/TC 230.12. Several <strong>of</strong> the standards are referred to as ISO EN. These standards may havebeen elaborated under a CEN or ISO lead but were subsequently co-adopted by thetwo standards bodies under the Vienna Agreement. The date <strong>of</strong> publicati<strong>on</strong> for theISO and EN may not be the same as processing and publicati<strong>on</strong> <strong>of</strong> the final drafts maynot be identical.13. In comm<strong>on</strong> with ISO, CEN has now adopted a 5 yearly review <strong>of</strong> standards toensure that they remain relevant and fit for purpose. The review encourages memberbodies to give an opini<strong>on</strong> as to whether the standards are still representative <strong>of</strong> thestate <strong>of</strong> the art (c<strong>on</strong>firmati<strong>on</strong>), whether they need to be revised to meet current needsor if they are no l<strong>on</strong>ger necessary in which case they recommend withdrawal.14. An obvious example <strong>of</strong> this process is with the invertebrate sampling standardscited in the WFD. EN 27828 - handnet sampling, EN 28265- quantitative samplersand EN ISO 9391 - deep water sampling -were published under an ISO lead butadopted in CEN. These are under revisi<strong>on</strong> in order to ensure their relevance to WFD.The drafts are being revised in CEN but will be published under an ISO lead, as thesewere originally ISO documents.105
Table 1. List <strong>of</strong> European standards that are relevant to the implementati<strong>on</strong> <strong>of</strong> the WFD andthe intercalibrati<strong>on</strong> process.Reference Title Published CommentEN 25667-1 Water quality –Sampling- Part 1: Guidance <strong>on</strong> the design <strong>of</strong> 1993sampling programmes (ISO 5667-1:1980)EN 25667-2 Water quality – Sampling – Part 2: Guidance <strong>on</strong> sampling 1993techniques (ISO 5667-2:1991)EN 5667-3 Water quality – Sampling – Part 3: Guidance <strong>on</strong> the2003preservati<strong>on</strong> and handling <strong>of</strong> water samplesEN 27828 Water quality – Methods <strong>of</strong> <strong>biological</strong> sampling - Guidance 1994<strong>on</strong> handnet sampling <strong>of</strong> aquatic benthic macro-invertebrates(ISO 7828:1985)EN 28265 Water quality – Methods <strong>of</strong> <strong>biological</strong> sampling – Guidance<strong>on</strong> the design and use <strong>of</strong> quantitative samplers for benthicmacro-invertebrates <strong>on</strong> st<strong>on</strong>y substrata in shallow1994Under revisi<strong>on</strong><strong>freshwater</strong>s(ISO 8265:1988)EN ISO Water quality – Sampling guidance <strong>on</strong> the preservati<strong>on</strong> and 1995Under revisi<strong>on</strong>5667-3EN ISO9391EN ISO5667-16EN ISO8689-1EN ISO8689-2handling <strong>of</strong> samples (ISO 5667-3:1994)Water Quality – Sampling in deep waters for macroinvertebrates– Guidance <strong>on</strong> the use <strong>of</strong> col<strong>on</strong>izati<strong>on</strong>,qualitative and quantitative samples (ISO 9391:1993)Water quality – Sampling – Part 16: Guidance <strong>on</strong> biotesting<strong>of</strong> samples (ISO 5667-16:1998)Water quality – Biological classificati<strong>on</strong> <strong>of</strong> rivers – Part 1:Guidance <strong>on</strong> the interpretati<strong>on</strong> <strong>of</strong> <strong>biological</strong> quality datafrom surveys <strong>of</strong> benthic macro-invertebrates in runningwaters(ISO 8689-1:2000)Water quality – Biological classificati<strong>on</strong> <strong>of</strong> rivers – Part 2:Guidance <strong>on</strong> the presentati<strong>on</strong> <strong>of</strong> <strong>biological</strong> quality datafrom surveys <strong>of</strong> benthic macro-invertebrates (ISO 8689-1:2000)1995199820002000EN 14184 Water quality – Guidance standard for the surveying <strong>of</strong> 2003aquatic macrophytes in running watersEN 13946 Water Quality – Guidance standard for the routine sampling 2003and pre-treatment <strong>of</strong> benthic diatoms from riversEN 14011 Water analysis – Sampling <strong>of</strong> fish with electricity 2003EN 14407 Water quality – Guidance standard for the identificati<strong>on</strong>,enumerati<strong>on</strong> and interpretati<strong>on</strong> <strong>of</strong> benthic diatom samplesfrom running waters2004EN 14614Water quality – Guidace standard for assessing thehydromorlogical features <strong>of</strong> rivers2004Under review106
Annex VII: WFD classificati<strong>on</strong> and intercalibrati<strong>on</strong> requirements1. In order to evaluate the <strong>biological</strong> <strong>methods</strong> in relati<strong>on</strong> to the WFD requirements,we recall the relevant secti<strong>on</strong>s <strong>of</strong> the Directive and the comm<strong>on</strong> agreed interpretati<strong>on</strong>s<strong>of</strong> these secti<strong>on</strong>s.2. In the WFD ecological status <strong>of</strong> surface waters is defined as ”…an expressi<strong>on</strong> <strong>of</strong>the quality <strong>of</strong> the structure and functi<strong>on</strong>ing <strong>of</strong> aquatic ecosystems associated withsurface waters, classified in accordance with Annex V” (Article 2.21). This impliesthat the classificati<strong>on</strong> systems should reflect changes taking place in the structure <strong>of</strong>the <strong>biological</strong> communities and in the overall ecosystem functi<strong>on</strong>ing as resp<strong>on</strong>se toanthropogenic pressures (e.g. nutrient loading, acidificati<strong>on</strong>).3. The WFD, also, stipulates that the ecological quality <strong>of</strong> water bodies should beclassified into five quality classes (high, good, moderate, poor, and bad) using anEcological Quality Ratio (EQR), defined as the ratio between type specific referencec<strong>on</strong>diti<strong>on</strong>s and observed values <strong>of</strong> the relevant <strong>biological</strong> quality elements (Table 1).Guidance <strong>on</strong> how to establish reference c<strong>on</strong>diti<strong>on</strong>s, and <strong>on</strong> classificati<strong>on</strong> <strong>of</strong> ecologicalstatus was prepared within WFD-CIS working groups REFCOND (An<strong>on</strong>ymous,2003a) and ECOSTAT (An<strong>on</strong>ymous, 2004).Table 1. Biological quality elements and metrics required for the classificati<strong>on</strong> <strong>of</strong> the high,good, and moderate ecological quality status <strong>of</strong> different surface waters according to thenormative definiti<strong>on</strong>s described in the Annex V <strong>of</strong> the WFD. 1 = Tax<strong>on</strong>omiccompositi<strong>on</strong>, 2 = Abundance, 3= Biomass, 4 = Plankt<strong>on</strong> blooms, 5= diversity, 6=sensitive taxa (e.g. sensitive vs. insensitive species <strong>of</strong> organisms), 7 = age structure(from Heiskanen et al., 2004).Quality element Rivers LakesPhytoplankt<strong>on</strong> 1, 2, 3*, 4 1, 2, 3, 4Aquatic flora 1, 2 1, 2Benthic invertebrates 1, 2, 5, 6 1, 2, 5, 6Fish 1, 2, 6, 7 1, 2, 6, 7*transparency as a proxy <strong>of</strong> phytoplankt<strong>on</strong> biomass107
108
Annex VIII: Compatibility <strong>of</strong> the nati<strong>on</strong>al classificati<strong>on</strong> <strong>methods</strong> withWFD requirementsTable 1. Summary <strong>of</strong> the informati<strong>on</strong> <strong>on</strong> the compatibility <strong>of</strong> the nati<strong>on</strong>al classificati<strong>on</strong><strong>methods</strong> with the WFD requirements obtained by the Ecostat group WG 2A.Country5 qualityclassesCriteria for WFD compatibilityReference Reference c<strong>on</strong>diti<strong>on</strong>sC<strong>on</strong>diti<strong>on</strong>sWFD compatibleAquatic floraEst<strong>on</strong>ia no inf. no inf. no inf. no inf.Finland no inf. no inf. no inf. no inf.Ireland no inf. no inf. no inf. no inf.Ireland no inf. no inf. no inf. no inf.Latvia no inf. no inf. no inf. no inf.Latvia no inf. no inf. no inf. no inf.Method applicabilityLithuania no inf. no inf. no inf. no inf.Lithuaniano not yet, depending <strong>on</strong>development <strong>of</strong> typologynot yetneeds further elaborati<strong>on</strong> <strong>of</strong>reference c<strong>on</strong>diti<strong>on</strong>sSweden no inf. tests <strong>of</strong> m<strong>on</strong>itoring carriedout in nati<strong>on</strong>al referencelakesnoc<strong>on</strong>sistent with WFD when adatabase <strong>of</strong> lake vegetati<strong>on</strong> iscompletedUK no inf. no no basis for generating the requiredmeasures for the WFD, not relatedto reference c<strong>on</strong>diti<strong>on</strong>s and there isno classificati<strong>on</strong> scheme relating toquality statusSlovenia no inf. no no inf. noBenthic invertebrate faunaCY no inf. no no noLithuania no not yet, depending <strong>on</strong> not yetneeds further elaborati<strong>on</strong> <strong>of</strong>development <strong>of</strong> typologyreference c<strong>on</strong>diti<strong>on</strong>sLatvia no inf. no inf. no inf. no inf.Sweden yes spatially based, best noyesavailable sites for sixecoregi<strong>on</strong>s (types)Ireland* no inf. no inf. no inf. no inf.Norway yes no no Needs further elaborati<strong>on</strong> <strong>of</strong>reference c<strong>on</strong>diti<strong>on</strong>sUK* no inf. temporal referencing,rec<strong>on</strong>structing c<strong>on</strong>d., pH,NO3 and TP for larvalremains in sediment coresamples;spatial referencingyes, indicator assemblages yesidentified for different laketypes based <strong>on</strong> their c<strong>on</strong>d.,can be d<strong>on</strong>e for pH andnutrientsPhytoplankt<strong>on</strong>Latvia no inf. draft versi<strong>on</strong> yesAustria yes m<strong>on</strong>itoring <strong>on</strong> lakes for selected lakes in for selected lakes in Carinthia <strong>on</strong>lyincluding reference lakes Carinthia <strong>on</strong>lyEst<strong>on</strong>ia no inf. no inf. no inf. no inf.Finland no inf. no no inf. no inf.Ireland no inf. no inf. no inf. no inf.Lithuania no inf. no inf. no inf. no inf.Norway yes not yet, depending <strong>on</strong> no inf. no inf.109
development <strong>of</strong> typologySweden Yes, for 3 types <strong>of</strong> lakes no, need a more detailedtypologyUK no inf. no noSlovenia no inf. no noPortugal no no no noSpain no inf. no noFishSpain no inf. no inf. no inf. no inf.Sweden yes not exactly, metrics andtheir reference values arederived using Nati<strong>on</strong>aldatabaseneeds to be revised in terms <strong>of</strong>both metrics and type-specificreference valuesUK no no no basis for generating the requiredmeasures for the WFD. Not relatedto reference c<strong>on</strong>diti<strong>on</strong>s and there isno classificati<strong>on</strong> scheme relating toquality status. Used in isolati<strong>on</strong>will not provide all data requiredby WFDNordiccountriesno inf. no inf. no inf. no inf.Macrophytes and phytobenthosGermany yes yes yes GoodAquatic plants and benthic invertebratesUK** Yes Yes Good* Eutrophicati<strong>on</strong> and acidificati<strong>on</strong>** MultistressorsNote all other <strong>methods</strong> target the classificati<strong>on</strong> <strong>of</strong> eutrophicati<strong>on</strong> impacts110
Annex IX: WFD Comm<strong>on</strong> Metric1. In order to ensure comparability <strong>of</strong> the Ecological Quality Ratio (EQR) scalesbetween the different EU countries and to obtain a comm<strong>on</strong> understanding <strong>of</strong> thegood ecological status <strong>of</strong> surface waters all over EU, the WFD requires for theintercalibrati<strong>on</strong> <strong>of</strong> the classificati<strong>on</strong> results <strong>of</strong> the <strong>biological</strong> m<strong>on</strong>itoring systems. Inpractice, the intercalibrati<strong>on</strong> exercise must establish the values for the boundarybetween the classes <strong>of</strong> high and good status, and for the boundary between good andmoderate status, which shall be c<strong>on</strong>sistent with the normative definiti<strong>on</strong>s <strong>of</strong> thoseclass boundaries given in Annex V <strong>of</strong> the WFD.2. As in the WFD the intercalibrati<strong>on</strong> is a two-phase process, which starts with theestablishment <strong>of</strong> an intercalibrati<strong>on</strong> network c<strong>on</strong>sisting <strong>of</strong> sites representing theboundaries between the quality classes ‘High-Good’ and ‘Good-Moderate’, as based<strong>on</strong> the WFD normative definiti<strong>on</strong>s. In a sec<strong>on</strong>d phase each Member State’sassessment method must be calibrated both in the ecoregi<strong>on</strong> and for the surface watertype to which the system is applicable. The results <strong>of</strong> the sec<strong>on</strong>d phase must be usedto set (EQR) values for relevant class boundaries for each Member States <strong>biological</strong>assessment system.3. The intercalibrati<strong>on</strong> exercise will focus <strong>on</strong> specific type/<strong>biological</strong> qualityelement/ pressure combinati<strong>on</strong>s, which were selected based in data availability withinthe time c<strong>on</strong>strains <strong>of</strong> the exercise. For rivers, the intercalibrati<strong>on</strong> will focus <strong>on</strong> sitesimpacted by organic and/or nutrient loading, river modificati<strong>on</strong> and acidificati<strong>on</strong> asassessed making use <strong>of</strong> macroinvertebrates, fish and benthic algae. For lakes, thefocus will be <strong>on</strong> eutrophicati<strong>on</strong> and acidificati<strong>on</strong> as assessed using, respectively, <strong>of</strong>phytoplankt<strong>on</strong> and macrophytes, and macroinvertebrates and fish respectively. Thedifferent combinati<strong>on</strong>s <strong>of</strong> pressures/ <strong>biological</strong> quality elements are, both for river andlakes, dependant <strong>of</strong> the GIG, the pressure and the type.4. Guidance <strong>on</strong> the intercalibrati<strong>on</strong> process was developed within a drafting groupthat is part <strong>of</strong> the ECOSTAT WG 2A. The guidance foresees an intercalibrati<strong>on</strong>process based in the selecti<strong>on</strong> from three different opti<strong>on</strong>s, and several hybrids <strong>of</strong>these opti<strong>on</strong>s, all firmly based <strong>on</strong> the definiti<strong>on</strong> <strong>of</strong> a protocol for deriving goodecological status class boundary values from the normative definiti<strong>on</strong>s. The choice <strong>of</strong>111
<strong>on</strong>e or other opti<strong>on</strong> depends <strong>on</strong> the degree <strong>of</strong> compliance <strong>of</strong> the nati<strong>on</strong>al assessment<strong>methods</strong> with the WFD requirements, the nature <strong>of</strong> the <strong>methods</strong> for determiningreference c<strong>on</strong>diti<strong>on</strong>s, and the possibility for identifying a comm<strong>on</strong> metric.5. Given the state <strong>of</strong> development <strong>of</strong> the nati<strong>on</strong>al <strong>methods</strong> and their possibledivergences it is expected that the most viable opti<strong>on</strong> involves the use <strong>of</strong> a comm<strong>on</strong>metric identified specifically for the purposes <strong>of</strong> the intercalibrati<strong>on</strong> exercise and towhich the nati<strong>on</strong>al <strong>methods</strong> will be compared with and then adjusted.What is a metric and what is a intercalibrati<strong>on</strong> ‘comm<strong>on</strong> metric’6. A metric is defined in Karr and Chu (1999) as a measurable part or process <strong>of</strong> a<strong>biological</strong> system empirically shown to change in value al<strong>on</strong>g a gradient <strong>of</strong> humaninfluence. It reflects specific and predictable resp<strong>on</strong>ses <strong>of</strong> the community to humanactivities, either to a single factor or to the cumulative effects <strong>of</strong> several or allactivities within a watershed.7. Several metrics types can be distinguished by definiti<strong>on</strong> addressing comparableaspects <strong>of</strong> a community, regardless <strong>of</strong> the stressor to which the metrics areresp<strong>on</strong>ding. The following metric types are distinguished:- Compositi<strong>on</strong> / abundance metrics: all metrics giving the share <strong>of</strong> a tax<strong>on</strong> ortax<strong>on</strong>omic group in relati<strong>on</strong> to the total number <strong>of</strong> individuals counted; allmetrics giving the abundance <strong>of</strong> a tax<strong>on</strong> or tax<strong>on</strong>omic group.- Richness / diversity metrics: all metrics giving the number <strong>of</strong> taxa within acertain tax<strong>on</strong> (including the total number <strong>of</strong> taxa), all diversity indices.- Sensitivity / tolerance metrics: all metrics giving the ratio <strong>of</strong> taxa sensitive andinsensitive to stress in general or to a certain stress-type, either usingpresence/absence or abundance informati<strong>on</strong>.- Functi<strong>on</strong>al metrics: all metrics addressing the characteristics <strong>of</strong> taxa otherthan their sensitivity to stress (species traits, taxa traits, ecological guilds):feeding types, habitat preferences, ecosystem type preferences, currentpreferences, life-history parameters, body-size parameters. These can be based<strong>on</strong> taxa abundance.112
8. For the purpose <strong>of</strong> the WFD intercalibrati<strong>on</strong> exercise it may be necessary toidentify comm<strong>on</strong> metrics (see opti<strong>on</strong> 2 <strong>of</strong> the Guidance <strong>on</strong> the Intercalibrati<strong>on</strong>Process 10 ). This is the case when Member State’s assessment <strong>methods</strong> are not directlycomparable, and involves the agreement <strong>on</strong> a comm<strong>on</strong> WFD method by the MemberStates in a GIG.9. The comm<strong>on</strong> metrics should be indicative <strong>of</strong> the relevant <strong>biological</strong> qualityelement and sensitive to the pressure that is assessed. These may be selected from <strong>on</strong>e<strong>of</strong> the Member State’s existing assessment <strong>methods</strong>, if acceptable for the otherMember States in the GIG, but also can be specifically developed in the GIGs. For thecomm<strong>on</strong> metric, type-specific good status boundary values need to be established inthe GIGs following the applicati<strong>on</strong> <strong>of</strong> an agreed boundary setting procedure using adata set assembled for the purposes <strong>of</strong> the intercalibrati<strong>on</strong> exercise. The results <strong>of</strong> thecomm<strong>on</strong> assessment method will be used as the basis for adjusting the boundary EQRvalues <strong>of</strong> the nati<strong>on</strong>al assessment <strong>methods</strong>.10. The applicability <strong>of</strong> a comm<strong>on</strong> metric is dependent <strong>of</strong> the availability <strong>of</strong> a suitabledata set from which the comm<strong>on</strong> metric(s) can be calculated to enable reliableapplicati<strong>on</strong> <strong>of</strong> the agreed boundary setting procedure, and the availability <strong>of</strong> a means<strong>of</strong> estimating and taking into account differences in the bias <strong>of</strong> the <strong>methods</strong> whenapplied to the data set referred to above.11. In general, comm<strong>on</strong> metrics are <strong>biological</strong> metrics widely applicable within alarger geographical regi<strong>on</strong>, which can be used to derive comparable informati<strong>on</strong>am<strong>on</strong>g different countries and waterbody types. Basic features are the ability indiscriminating different quality classes and the possibility <strong>of</strong> calculating them from awide range <strong>of</strong> geographical c<strong>on</strong>texts, i.e. where different effort is placed <strong>on</strong> them<strong>on</strong>itoring exercise and different expertise is available for tax<strong>on</strong>omic identificati<strong>on</strong>(Buffagni and Erba, 2004).10‘Guidance <strong>on</strong> the Intercalibrati<strong>on</strong> Process’ available at http://113
114
Annex X: Summary <strong>of</strong> the nati<strong>on</strong>al <strong>biological</strong> assessment <strong>methods</strong> forlakes (WFD Intercalibrati<strong>on</strong> metadata January 2004)Austria• WFD compatible? No• Classificati<strong>on</strong> <strong>of</strong> ecological quality status based <strong>on</strong> the comparis<strong>on</strong> <strong>of</strong>reference with present-day trophic state.• The classificati<strong>on</strong> <strong>of</strong> the trophic state is based <strong>on</strong> physico-chemical andphytoplankt<strong>on</strong> parameters. The ecological quality status was classified as'high' or as 'boundary high/good' with moderate to high certainty.• Phytoplankt<strong>on</strong>: Yes; abundance, biomass, indicator taxa, group ratios,chlorophyll-a• Phytobenthos: No• Macrophytes: Yes; 4 out <strong>of</strong> 15; indicator taxa, limit <strong>of</strong> vegetati<strong>on</strong>• Macroalgae: No• Benthic invertebrates: No• Fish: No• Physicochemical quality: Yes; Total phosphorus, nitrate, amm<strong>on</strong>ium,oxygen, secchi depth• Pressure criteria: Yes; Nutrient loadingBelgium• WFD compatible? No• Expert c<strong>on</strong>sultati<strong>on</strong>, occasi<strong>on</strong>al research <strong>of</strong> diatoms, macro invertebrates,macrophytes and site specific physico-chemical parameters• Official <strong>methods</strong> are not yet operati<strong>on</strong>al. Expert agreement is the method, andis a subjective method.• Phytoplankt<strong>on</strong>: No• Phytobenthos: Yes; relative abundance <strong>of</strong> indicator species; relativeabundance (counts <strong>of</strong> 500 valves)• Macrophytes: Yes; type specific species (abundance weighted), disturbanceindicators, growth forms, cover-frequency (Tansley), aquatic vegetati<strong>on</strong>, shorevegetati<strong>on</strong>• Macroalgae: No• Benthic invertebrates: Yes; Tax<strong>on</strong>omic compositi<strong>on</strong>; numbers (Prest<strong>on</strong>scores)• Fish: No• Physicochemical quality: Yes; temperature, salinity, pH, alkalinity, oxygen,absorbance (254 nm, 420 nm), DIC, N-t, P-t, nitrate-N, amm<strong>on</strong>ium-N,phosphate-P, Kj-N, sodium, potassium, calcium, magnesium, ir<strong>on</strong>, sulphate,chloride, silica, COD• Pressure criteria: NoCyprus• WFD compatible? No115
• An integrated holistic evaluati<strong>on</strong> <strong>of</strong> data and informati<strong>on</strong> guided by expertjudgment was applied. The sites were classified in two categories representingecological c<strong>on</strong>diti<strong>on</strong>s in the range <strong>of</strong> high-good; and good-moderate. Formal<strong>methods</strong> are not yet operati<strong>on</strong>al. Expert agreement made, a subjective method.• The classificati<strong>on</strong> was mainly based <strong>on</strong> synthetic evaluati<strong>on</strong> <strong>of</strong> a) 226physicochemical /<strong>biological</strong> parameters integrated into 9 indices b) <strong>on</strong>hydrological regime and c) the existing pressures (mainly based <strong>on</strong> existingregister and Nitrate level)• Phytoplankt<strong>on</strong>: No• Phytobenthos: No• Macrophytes: No• Macroalgae: No• Benthic invertebrates: Yes; The Benthic Saprobity index (BSI) .It isevaluated according to the method <strong>of</strong> the Biological M<strong>on</strong>itoring Workingparty (BMWP). The Biological Diversity index (BDI). It is quantifiedaccording to the Sequential Comparis<strong>on</strong> index (SCI) methodology.• Fish: No• Physicochemical quality: Yes; All menti<strong>on</strong>ed in paragraph 5.3 except for theSalinity, Secchi depth, Total Nitrogen and Suspended Matter. Within thescheme <strong>of</strong> an Integrated Polluti<strong>on</strong> Evaluati<strong>on</strong> Organic and inorganic pollutantsand toxicity were investigated.• Pressure criteria: Yes; data from the register <strong>of</strong> populati<strong>on</strong> and the activitiesin catchments z<strong>on</strong>es (1996) and to partially amended in 2003 the results <strong>of</strong> theIndices. Nutrient loading and organic loading.GermanyWFD compatible? Yes 19 out <strong>of</strong> 24• Trophic method according to LAWA-AK 'Gewaesserbewertung - stehendeGewaesser' (1999). Assessment system according to 'PHYLIB' (BayerischesLandesamt fuer Wasserwirtschaft, Schaumburg et al., 2003. Macrophytes anddiatom Index, Schaumburg et al., 2003).• Trophic and <strong>biological</strong> criteria (total P, chlorophyll a, Secchi depth) expressedas Trophic Index. Trophic and <strong>biological</strong> criteria (phytoplankt<strong>on</strong>, macrophytes, phytobenthos), pressure criteria. Results from macrophytes Index, diatomindex; chloroph,yll a, phytoplankt<strong>on</strong> biovolume, secchi depth, totalphosphorus, total nitrogen and chloride differ <strong>on</strong>ly slightly from those valuesin reference lakes. One site unknown.• Phytoplankt<strong>on</strong>: Yes; Species compositi<strong>on</strong> and abundance (quantitative),chlorophyll a. Or Secchi depth, chlorophyll a. Or epilimnetic chlorophyll ac<strong>on</strong>centrati<strong>on</strong>/, phytoplankt<strong>on</strong> biovolume; diatom remains in the surfacesediment from the deepest point.• Phytobenthos: Yes; 14 out <strong>of</strong> 24; Benthic diatoms: species compositi<strong>on</strong> andabundance, diverse indices. 3 lakes: littoral diatoms• Macrophytes: Yes; 19 out <strong>of</strong> 24; Species compositi<strong>on</strong> and abundance,macrophyte index according to MELZER, reference index (see Schaumburg etal., 2003).Or ecological groups <strong>of</strong> macrophytes indicating the trophic level <strong>of</strong>the lake; abundance <strong>of</strong> the macrophytes (Kohler, 1978); structure <strong>of</strong> the lake116
shore (map); aquatic spermatophyta, pteridophyta, characeae, Bryophyta. 3lakes no informati<strong>on</strong> <strong>on</strong> method.• Macroalgae: Yes; 4 out <strong>of</strong> 24; Characeae <strong>on</strong>ly: same as in Macrophytes. 3lakes no informati<strong>on</strong> <strong>on</strong> method.• Benthic invertebrates: Yes; 8 out <strong>of</strong> 24; Characeae <strong>on</strong>ly: same as inMacrophytes. Abundance <strong>of</strong> the pr<strong>of</strong>undal fauna and boundarylittoral/pr<strong>of</strong>undal-fauna (FITTKAU). Species compositi<strong>on</strong>. 1 lake with noinformati<strong>on</strong> <strong>on</strong> method.• Fish: No• Physicochemical quality: Yes; Temperature, c<strong>on</strong>ductivity, secchi depth, TP,Ca. Or Secchi depth, temperature, oxygen, pH, c<strong>on</strong>ductivity, total phosphorus,soluble phosphorus, nitrate-N, amm<strong>on</strong>ium-N, silicic acid. Total phosphorus(TP), total nitrogen (TN), chloride (Cl) (2 lakes)• Pressure criteria: Yes; 16 out <strong>of</strong> 24; Waste water load, tourism, diffuse loads.Or landuse, waste water load, structure <strong>of</strong> lake shore. In <strong>on</strong>e 1 site noinformati<strong>on</strong> <strong>on</strong> method.Est<strong>on</strong>ia• WFD compatible? Yes• Classificati<strong>on</strong> based <strong>on</strong> TP as main pressure and biol. and physical-chemicalparameters correlating with it. RC for TP are estimated basing <strong>on</strong> morphoedaphicindex (Vighi and Chiaudani, 1985). L<strong>on</strong>g-term changes in biota wereestimated using similarity with 1911-• Depite <strong>of</strong> very poor surrounding sand soils, diminished water transparency andopulent macrovegetati<strong>on</strong> refers to human impact. Est<strong>on</strong>ian team worked outquality limits for different quality classes; species compositi<strong>on</strong> <strong>of</strong> charophytes,relative abundance, coverage, distributi<strong>on</strong> depth• Phytoplankt<strong>on</strong>: Yes; community structure, chl-a c<strong>on</strong>centrati<strong>on</strong>• Phytobenthos: No• Macrophytes: No• Macroalgae: Yes 9out <strong>of</strong> 12; similarity coefficient with 1911-13 data; orspecies compositi<strong>on</strong>, relative abundance, coverage, distributi<strong>on</strong> depth• Benthic invertebrates: Only for 1 site• Fish: Yes;Only for 1 site• Physicochemical quality: Yes; pH, total nitrogen, total phosphorus, Secchitransparency; in <strong>on</strong>e site also BOD7• Pressure criteria: NoSpain• WFD compatible? Yes• OCDE mean Chlorophyll (µg/l) boundary values for trophic classificati<strong>on</strong>(OECD, 1982).• Annual mean chlorophyll values between 3,5 and 7 were selected for thegood/moderate class boundary sites (19 sites); annual mean chlorophyll valuesbetween 1 and 3 (µg/l) were selected for the high/good class boundary sites(Secchi disk, TP around 10 µg/l) (2 sites); annual mean chlorophyll values inthe oligotrophic level selected for the high/good class boundary site. (1site)117
• Phytoplankt<strong>on</strong>: Yes; Clorophyll as alga biomass measure.• Phytobenthos: No• Macrophytes: No• Macroalgae: No• Benthic invertebrates: No• Fish: No• Physicochemical quality: No• Pressure criteria: NoFrance• WFD compatible? No• Based <strong>on</strong> trophic level.• Phytoplankt<strong>on</strong>: No• Phytobenthos: No• Macrophytes: No• Macroalgae: No• Benthic invertebrates: No• Fish: No• Physicochemical quality: Yes; nutrients, chlorophyll, transparency.• Pressure criteria: NoUnited Kingdom• WFD compatible? Yes (13 sites); NO (19 sites)• The 13 compatible sites: SEPA's Standing Water Classificati<strong>on</strong> Scheme (1994,SEPA Internal <str<strong>on</strong>g>Report</str<strong>on</strong>g>). Sediment diatoms to assess the degree <strong>of</strong> floristicchange (diatom species turnover) between core bottom and surface sedimentsample using chord distance dissimilarity measure.• The n<strong>on</strong>-compatible sites: mostly, based <strong>on</strong> definiti<strong>on</strong>s given in Annex V forthe <strong>biological</strong> elements - expert opini<strong>on</strong> (9 sites). Several differentcombinati<strong>on</strong>s <strong>of</strong> these definiti<strong>on</strong>s, expert judgement, pressure informati<strong>on</strong>,ratio <strong>of</strong> reference to current lake total phosphorus c<strong>on</strong>centrati<strong>on</strong> and sedimentdiatoms used to assess the degree <strong>of</strong> floristic change (diatom species turnover)between core bottom and a surface sediment sample.• Boundary criteria have been based <strong>on</strong> an interpretati<strong>on</strong> <strong>of</strong> the normativedefiniti<strong>on</strong>s, which have been related to m<strong>on</strong>itoring methodologies used in theUK.• Phytoplankt<strong>on</strong>: Yes21 out <strong>of</strong> 32; fossil diatom assemblages (14 sites) andOccasi<strong>on</strong>al blooms (7 sites).• Phytobenthos: Yes 22 out <strong>of</strong> 32 sites; fossil Diatom record (14 sites) andabsence <strong>of</strong> bacterial tufts, but occasi<strong>on</strong>al algal mats <strong>of</strong> Cladophora agg (8sites).• Macrophytes: Yes 11 out <strong>of</strong> 32 sites; absence <strong>of</strong> indicator species typical <strong>of</strong>type and abundances lower than expected for a good quality lake <strong>of</strong> this type,species presence and absence and relative abundance DAFOR, speciescompositi<strong>on</strong>.118
• Macroalgae; 8 out <strong>of</strong> 32 sites; periodic growths <strong>of</strong> Cladophora mats,presence <strong>of</strong> nuisance growths <strong>of</strong> indicators such as Cladophora agg.(2 sites).• Benthic invertebrates: 8 out <strong>of</strong> 32 sites; family level invertebrates and logabundance - presence and absence <strong>of</strong> polluti<strong>on</strong> sensitive/tolerant taxa.• Fish: No• Physicochemical quality: 28 out <strong>of</strong> 32 sites; current total phosphorus,hindcast total phosphorus, current acid neutralising capacity and hindcast acidneutralising capacity (13 sites), OECD classificati<strong>on</strong> based <strong>on</strong> totalphosphorus (8 sites), Total Phosphorus (7 sites).• Pressure criteria: 25 out <strong>of</strong> 32 sites; presence / absence / significance <strong>of</strong> fishfarms, other point sources, hydromorphological, recreati<strong>on</strong>al and land usepressures (16 sites), Catchment land-use, improved grassland/evergreenforestry (8 sites), expert opini<strong>on</strong> based <strong>on</strong> knowledge <strong>of</strong> lake (1 site).Ireland• WFD compatible? No• Ireland’s interpretati<strong>on</strong> <strong>of</strong> normative definiti<strong>on</strong>s in Annex V <strong>of</strong> Waterframework Directive.• Several combinati<strong>on</strong>s <strong>of</strong> the elements macrophytes, macroinvertebrates,phytoplankt<strong>on</strong> species compositi<strong>on</strong> and quantity, total phosphorus and otherphysico-chemical data are used for classificati<strong>on</strong>,• Phytoplankt<strong>on</strong>: Yes; 19 out <strong>of</strong> 24 sites; species compositi<strong>on</strong>, biomass andabundance (11 sites), species compositi<strong>on</strong> and abundance (4 sites),Phytoplankt<strong>on</strong> abundance as measured by chlorophyll (3 sites).• Phytobenthos: No• Macrophytes: Yes; 14 out <strong>of</strong> 24; species compositi<strong>on</strong> and abundance.• Macroalgae: Yes; 11 out <strong>of</strong> 24 sites; species compositi<strong>on</strong> (6 sites) andabundance (4 sites), Presence or absence (1 site).• Benthic invertebrates: Yes; 10 out <strong>of</strong> 24 sites; species compositi<strong>on</strong> andabundance.• Fish: No• Physicochemical quality: Yes; 22 out 24sites; total Phosphorus <strong>on</strong>ly (8sites), H+, alkalinity, n<strong>on</strong>-marine sulphate, nitrate, cati<strong>on</strong>s and heavy metalsc<strong>on</strong>centrati<strong>on</strong>s (4 sites), several combinati<strong>on</strong>s <strong>of</strong> nutrients, pH, H+, alkalinity,n<strong>on</strong>-marine sulphate, nitrate, cati<strong>on</strong>s and heavy metals c<strong>on</strong>centrati<strong>on</strong>s,chlorophyll (9 sites).• Pressure criteria: NoLithuania (4expert knowledge <strong>on</strong> level <strong>of</strong> acid depositi<strong>on</strong> in the catchment/regi<strong>on</strong>sites)• WFD compatible? No• Pressure screening, historical and existing m<strong>on</strong>itoring data, expert judgement• Maximum allowable c<strong>on</strong>centrati<strong>on</strong>s, existing <strong>biological</strong> classificati<strong>on</strong> systemfor macroinvertebrates (biotic integrity index)• Phytoplankt<strong>on</strong>: No• Phytobenthos: No• Macrophytes: No119
• Macroalgae: No• Benthic invertebrates: Yes; biotic integrity index• Fish: No• Physicochemical quality: Yes; BOD7, total N, total P• Pressure criteria: Yes; Land use (%), wastewater discharges (approximateamount <strong>of</strong> discharges), recreati<strong>on</strong>al useLatvia• WFD compatible? No• Use <strong>of</strong> reference physico-chemical c<strong>on</strong>diti<strong>on</strong>s (? But reference c<strong>on</strong>diti<strong>on</strong>questi<strong>on</strong>s were all answered with no), statistical analyses <strong>of</strong> physico-chemicalvalues.• Criteria (P total, N total, BOD5, N/NO3, N/NO2, N/NH4, P/PO4, Chlorophylla) the lowest and the highest quartiles were used for approximate defininghigh/good or the good/moderate class boundaries + expert judgement• Phytoplankt<strong>on</strong>: No 5 out <strong>of</strong> 6 sites• Phytobenthos: No• Macrophytes: No• Macroalgae: No• Benthic invertebrates: No• Fish: No• Physicochemical quality: Yes; P total, N total, BOD5, N/NO3, N/NO2,N/NH4, P/PO4, Chlorophyll a• Pressure criteria: NoNetherlands• WFD compatible? Yes• Modificati<strong>on</strong> <strong>of</strong> method presented in Van den Berg et al., (2002). Boundaryhigh/good: statistical variati<strong>on</strong> in data, 90% percentile <strong>of</strong> reference values• good/moderated: class width <strong>of</strong> good is assumed to be similar as class widthfor high.• Phytoplankt<strong>on</strong>: Yes; mean chlorophyll a c<strong>on</strong>centrati<strong>on</strong> (summer period).• Phytobenthos: No• Macrophytes: Yes; 3 out <strong>of</strong> 3 sites; area covered by submerged macrophytes,1 site including charophytes.• Macroalgae: <strong>on</strong>ly 1 site; Charophytes were included in area covered bysubmerged macrophytes.• Benthic invertebrates: No• Fish: No• Physicochemical quality: Yes; total P• Pressure criteria: NoNorway• WFD compatible? No• Nati<strong>on</strong>al classificati<strong>on</strong> system (SFT-guidance 1997:04) combined with expertjudgement120
• Total phosphorus and chlorophyll a combined with expert judgement <strong>of</strong>reference c<strong>on</strong>diti<strong>on</strong>s for these parameters for the type relevant for the site• Phytoplankt<strong>on</strong>: Yes; 21 out <strong>of</strong> 46; mean chlorophyll a c<strong>on</strong>centrati<strong>on</strong>(summer period)• Phytobenthos: No• Macrophytes: Yes; <strong>on</strong>ly 1 lake;• Macroalgae: <strong>on</strong>ly 1 site• Benthic invertebrates: yes; 9 out <strong>of</strong> 46; species compositi<strong>on</strong>, acidificati<strong>on</strong>index based up<strong>on</strong> indicator taxa sensitive to acidificati<strong>on</strong>• Fish: Yes; 8 out <strong>of</strong> 46; species compositi<strong>on</strong>, CPUE and age structure(primarily trout populati<strong>on</strong>s)• Physicochemical quality: Yes; 44 out <strong>of</strong> 46; pH, ANC. Total phosphorus• Pressure criteria: 24 out <strong>of</strong> 46; expert knowledge <strong>on</strong> level <strong>of</strong> acid depositi<strong>on</strong>in the catchment/regi<strong>on</strong>Poland• WFD compatible? No• Lake Quality Evaluati<strong>on</strong> System - method used in routine m<strong>on</strong>itoring <strong>of</strong> Polishlakes Kudelska et al. (1997). Two types <strong>of</strong> criteria: water quality criteria(mainly eutrophicati<strong>on</strong> parameters), morphometric, hydrographic andwatershead criteria.• Phytoplankt<strong>on</strong>: Yes; 22 out <strong>of</strong> 25 sites; quantitative and qualitativecompositi<strong>on</strong>, indicator taxa (in 10 sites) + biomass (chlorophyll a c<strong>on</strong>tent) (in11 sites) + number <strong>of</strong> tax<strong>on</strong>s, indicator taxa, dominance structure (1 site).• Phytobenthos: No• Macrophytes: Yes; 17 out <strong>of</strong> 25 sites; tax<strong>on</strong>omic compositi<strong>on</strong>, area coveredby particular plant community, max. depth <strong>of</strong> plant growth (15 sites),quantitative and qualitative compositi<strong>on</strong>, indicator taxa, biomass (chlorophylla c<strong>on</strong>tent) (1site), indicator taxa <strong>on</strong>ly (1 site).• Macroalgae: Yes; 13 out <strong>of</strong> 25 sites; presence <strong>of</strong> Characeae, area covered byChara community, max. depth <strong>of</strong> plant growth.• Benthic invertebrates: 0nly 1; compositi<strong>on</strong>, indicator taxa.• Fish: No; 20 out <strong>of</strong> 25 sites; qualitative compositi<strong>on</strong> and 1 site also withindicator taxa.• Physicochemical quality: Yes; mainly eutrophicati<strong>on</strong> parameters (oxygenc<strong>on</strong>diti<strong>on</strong>s, N and P compounds, Secchi disc reading, chlorophyll a) and COD-Cr, c<strong>on</strong>ductivity.• Pressure criteria: Yes; land use in catchment area, presence <strong>of</strong> humansettlements, presence <strong>of</strong> sources <strong>of</strong> polluti<strong>on</strong>, tourism.Portugal• WFD compatible? No• C<strong>on</strong>centrati<strong>on</strong> <strong>of</strong> chlorophyll a.• Statistical approach based <strong>on</strong> historical data <strong>of</strong> chlorophyll a.• Phytoplankt<strong>on</strong>: Yes; Chlorophyll a.• Phytobenthos: No121
• Macrophytes: No• Macroalgae: No• Benthic invertebrates: No• Fish: No• Physicochemical quality: No• Pressure criteria: NoSweden• WFD compatible? Yes 2 out <strong>of</strong> 9• Swedish Envir<strong>on</strong>mental Quality Criteria (<str<strong>on</strong>g>Report</str<strong>on</strong>g> 4913, Swedish EPA).• Border class 1 and 2, as deviati<strong>on</strong>s from reference values. Noteutrophied/acidified according to pressure criteria. Border class 2 and 3, asdeviati<strong>on</strong>s from reference values• Phytoplankt<strong>on</strong>: Yes 4 out <strong>of</strong> 9; total biovolume (values for August)• Phytobenthos: No• Macrophytes: No• Macroalgae: No• Benthic invertebrates: Yes; 5out <strong>of</strong> 9; Average Score Per Tax<strong>on</strong>, acidityindex• Fish: <strong>on</strong>ly <strong>on</strong>e site; species number, diversity (Shann<strong>on</strong>-Wieners H), biomass,relative abundance <strong>of</strong> native species, proporti<strong>on</strong> <strong>of</strong> cyprinids, proporti<strong>on</strong> <strong>of</strong>pisc. percids, number <strong>of</strong> acidific.-sensitve species, proporti<strong>on</strong> <strong>of</strong> speciestolerant to low oxygen levels, proporti<strong>on</strong> <strong>of</strong> introduced species.• Physicochemical quality: Yes; pH, total phosphorus, water colour or <strong>on</strong>ly pH• Pressure criteria: Yes; F-factor, percentage agricultural land, percentageclear-cuttingsSloveniaWFD compatible? No• OECD classificati<strong>on</strong>; Eutrophicati<strong>on</strong> <strong>of</strong> waters, M<strong>on</strong>itoring, Assessment andC<strong>on</strong>trol An<strong>on</strong>., OECD Paris, (1982)• N, P annual c<strong>on</strong>c., Ptot.- (SIST EN 1189:1997); N anorg.= Amm<strong>on</strong>ium (SISTEN ISO 11732:1999)+ Nitrate (SIST EN ISO 10304-1:1998) +Nitrite (SISTEN 26777:1996); transparency (Secchi depth), chlorophyll a c<strong>on</strong>centrati<strong>on</strong>(SIST ISO 10260:2001- modif.)• Phytoplankt<strong>on</strong>: Yes; chlorophyll-a c<strong>on</strong>centrati<strong>on</strong>, phytoplankt<strong>on</strong> biomass,bloom frequency.• Phytobenthos: No• Macrophytes: Yes; tax<strong>on</strong>omic compositi<strong>on</strong>, relative abundance.• Macroalgae: Yes; tax<strong>on</strong>omic compositi<strong>on</strong>, relative abundance.• Benthic invertebrates: No• Fish: No• Physicochemical quality: Yes; Secchi depth, Total P, Total inorg. N (Nitrate,Nitrite, Amm<strong>on</strong>ium).• Pressure criteria: No122
Annex XI: Harm<strong>on</strong>isati<strong>on</strong> drafting group membersThis task team will be co-ordinated by JRC Ana Cristina Cardoso, Angelo Soliminiand Guido Premazzi (JRC/ EEWAI). The task members are Fabrice Martinet (FR),Maria Luisa Serrano (ES), Teresa Rafael (PT), and Sebastian Birk (STAR project),Peter Hale (CEN).123
Missi<strong>on</strong> <strong>of</strong> the JRCThe missi<strong>on</strong> <strong>of</strong> the JRC is to provide customer-driven scientific and technical supportfor the c<strong>on</strong>cepti<strong>on</strong>, development, implementati<strong>on</strong> and m<strong>on</strong>itoring <strong>of</strong> EU policies. As aservice <strong>of</strong> the European Commissi<strong>on</strong>, the JRC functi<strong>on</strong>s as a reference centre <strong>of</strong>science and technology for the Uni<strong>on</strong>. Close to the policy-making process, it servesthe comm<strong>on</strong> interest <strong>of</strong> the Member States, while being independent <strong>of</strong> specialinterests, whether private <strong>of</strong> nati<strong>on</strong>al.124

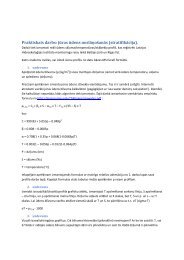

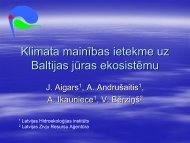
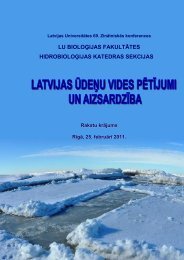
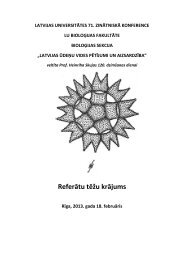
![Accommodation booking form [PDF]](https://img.yumpu.com/39471785/1/184x260/accommodation-booking-form-pdf.jpg?quality=85)