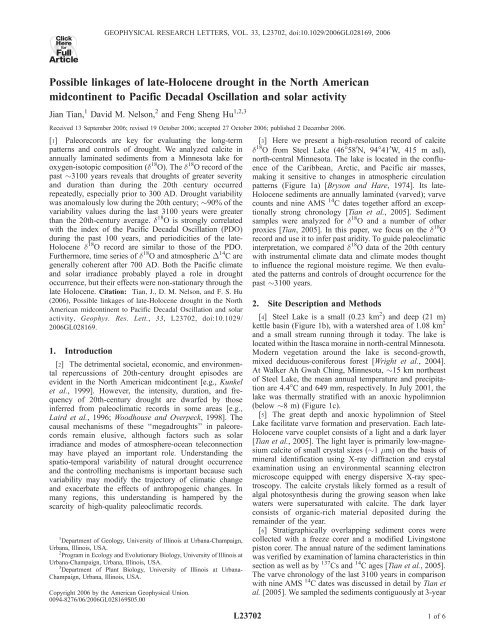
Possible linkages of late-Holocene drought in the North American ...
Possible linkages of late-Holocene drought in the North American ...
Possible linkages of late-Holocene drought in the North American ...

You also want an ePaper? Increase the reach of your titles
YUMPU automatically turns print PDFs into web optimized ePapers that Google loves.
L23702 TIAN ET AL.: MIDWEST DROUGHT HISTORY L23702Figure 2. (a) Detrended (100-year w<strong>in</strong>dow) d 18 O record from Steel Lake, P-AET, and detrended PDO <strong>in</strong>dex <strong>of</strong> <strong>the</strong> 20thcentury. The d 18 O record was shifted backward by 3 years (sample resolution). (b) Cross-correlation between d 18 O and <strong>the</strong>PDO. The correlation improves from r = 0.39 to r = 0.63 (n = 32, p < 0.001) with <strong>the</strong> 3-year shift <strong>in</strong> d 18 O. The 3-year laglikely reflects groundwater <strong>in</strong>fluence on d 18 O.Figure 3. (a) Time series <strong>of</strong> calcite d 18 O from Steel Lake (dotted l<strong>in</strong>e = raw data; thick l<strong>in</strong>e = 3-po<strong>in</strong>t mov<strong>in</strong>g average) <strong>in</strong>comparison with <strong>drought</strong> records from Moon Lake, ND [Laird et al., 1996] and from western United States [Cook et al.,2004]. The horizontal l<strong>in</strong>es represent <strong>the</strong> mean values <strong>of</strong> d 18 O at Steel Lake (past 3100 years) and diatom-<strong>in</strong>ferred sal<strong>in</strong>ity atMoon Lake (past 2300 years). Previously documented <strong>drought</strong>s are labeled d1–d5, as <strong>in</strong> text. (b) Relative variability <strong>of</strong> <strong>the</strong>detrended (100-year w<strong>in</strong>dow) d 18 O data. The horizontal l<strong>in</strong>e represents <strong>the</strong> mean value <strong>of</strong> 20th-century variability. (c) Spectralpatterns <strong>of</strong> <strong>the</strong> detrended d 18 O data from Steele Lake. (d) Wavelet power spectrum <strong>of</strong> <strong>the</strong> d 18 O data from Steele Lake.3<strong>of</strong>6
L23702 TIAN ET AL.: MIDWEST DROUGHT HISTORY L23702Figure 4. Comparison <strong>of</strong> d 18 O and detrended atmosphericD 14 C data for <strong>the</strong> last 3100 years. Grey bars highlight<strong>in</strong>tervals with high d 18 O and low D 14 C values. Note that <strong>the</strong>D 14 C scale is reversed. Well-known solar m<strong>in</strong>ima (D 14 Cmaxima) are labeled: Da – Dalton, Ma – Maunder, Sp –Spörer, Wo – Wolf, Oo – Oort, Gr – Greek, and Ho –Homeric.dur<strong>in</strong>g <strong>the</strong> 1988 <strong>drought</strong> (Figure 3a, d1) and 1930s DustBowl (Figure 3a, d2) was m<strong>in</strong>or compared to that dur<strong>in</strong>gmany o<strong>the</strong>r time <strong>in</strong>tervals both before and after 300 AD.Thus <strong>drought</strong> events <strong>of</strong> greater magnitude than <strong>the</strong> aridityextremes <strong>of</strong> <strong>the</strong> 20th century were not uncommon dur<strong>in</strong>g<strong>the</strong> <strong>late</strong> <strong>Holocene</strong>.[10] In addition to <strong>the</strong> broad patterns, our d 18 O recordsuggests that <strong>the</strong> region was relatively dry dur<strong>in</strong>g <strong>the</strong>Medieval Climate Anomaly (MCA; 1400–1100 AD)and relatively wet dur<strong>in</strong>g <strong>the</strong> Little Ice Age (LIA;1850–1500 AD), but that <strong>the</strong> moisture regime variedgreatly with<strong>in</strong> each <strong>of</strong> <strong>the</strong>se two periods. Severe <strong>drought</strong>occurred dur<strong>in</strong>g <strong>the</strong> MCA, as suggested by <strong>the</strong> high averagevalues and dist<strong>in</strong>ct peaks <strong>in</strong> d 18 O (Figure 3a, d5). However,a prolonged wet period (1180–1250 AD) also occurredwith<strong>in</strong> <strong>the</strong> MCA. The lower average values <strong>of</strong> d 18 Obetween 1850 and 1500 AD suggest that <strong>the</strong> LIA wasgenerally wetter. However, <strong>the</strong> LIA was punctuated by<strong>drought</strong> episodes, as evidenced by several pronouncedd 18 O peaks (Figure 3a, d3 and d4).[11] Some <strong>of</strong> <strong>the</strong> <strong>drought</strong> patterns <strong>in</strong>ferred from <strong>the</strong> SteelLake d 18 O record agree with data from o<strong>the</strong>r sites <strong>in</strong> <strong>the</strong><strong>North</strong> <strong>American</strong> midcont<strong>in</strong>ent. For example, <strong>the</strong> occurrence<strong>of</strong> severe <strong>drought</strong> dur<strong>in</strong>g <strong>the</strong> MCA has been documented <strong>in</strong>paleoclimatic records from <strong>the</strong> Great Pla<strong>in</strong>s [Laird et al.,1996] (Figure 1a, site 1 and Figure 3a), western [Cook et al.,2004] (Figure 3a), and midwestern [Booth et al., 2006]United States. Fur<strong>the</strong>rmore, tree-r<strong>in</strong>g records <strong>in</strong>dicate severe<strong>drought</strong> episodes around 1800 AD <strong>in</strong> <strong>the</strong> central Canadianprairie region [Case and MacDonald, 1995] (Figure 1a, site2) and dur<strong>in</strong>g <strong>the</strong> 16th century <strong>in</strong> <strong>the</strong> sou<strong>the</strong>rn RockyMounta<strong>in</strong>s [Gray et al., 2003] (Figure 1a, site 3). Thussome <strong>of</strong> <strong>the</strong>se <strong>drought</strong> events might have been widespreadacross <strong>the</strong> <strong>North</strong> <strong>American</strong> midcont<strong>in</strong>ent.[12] The tim<strong>in</strong>g <strong>of</strong> a mean-state shift <strong>in</strong> a paleoclimaticrecord depends, <strong>in</strong> part, on <strong>the</strong> length <strong>of</strong> <strong>the</strong> record. Because<strong>of</strong> <strong>the</strong> scarcity <strong>of</strong> high-resolution climatic reconstructionsthat extend beyond <strong>the</strong> past 2000 years from <strong>the</strong> region, it isdifficult to assess <strong>the</strong> spatial extent <strong>of</strong> <strong>the</strong> mean-statehydroclimatic shift around 300 AD, as <strong>in</strong>ferred from <strong>the</strong>Steel Lake record. A high-resolution diatom record <strong>of</strong> <strong>the</strong>past 2300 years from Moon lake <strong>in</strong> eastern <strong>North</strong> Dakota[Laird et al., 1996] also shows that <strong>the</strong> regional climate wasgenerally dry before 300 AD but a mean-state shift appearedto have occurred at 1200 AD (Figure 3a). A mean-state shiftat 300 AD did not occur <strong>in</strong> areas far<strong>the</strong>r to <strong>the</strong> west on <strong>the</strong>basis <strong>of</strong> paleoclimatic records from Foy Lake <strong>in</strong> northwesternMontana [Stevens et al., 2006] (Figure 1a, site 4) andKettle Lake <strong>in</strong> northwestern <strong>North</strong> Dakota [Brown et al.,2005] (Figure 1a, site 5). Discrepancies <strong>in</strong> <strong>the</strong> tim<strong>in</strong>g and/ordirection <strong>of</strong> <strong>late</strong>-<strong>Holocene</strong> hydroclimatic change have beenreported previously [Fritz et al., 2000; Laird et al., 2003],although regional coherency <strong>in</strong> terms <strong>of</strong> <strong>the</strong> tim<strong>in</strong>g <strong>of</strong> majorshifts has also been documented among certa<strong>in</strong> sites [Lairdet al., 2003]. These discrepancies may reflect proxy sensitivitydifferences, spatial heterogeneity <strong>of</strong> climatic change,and/or chronological uncerta<strong>in</strong>ties.[13] To assess <strong>the</strong> relative variability <strong>of</strong> <strong>drought</strong> occurrenceat <strong>the</strong> centennial time scale (Figure 3b), we firstresampled <strong>the</strong> d 18 O data at 5-year resolution for <strong>the</strong> past250 years to match <strong>the</strong> resolution for <strong>the</strong> rema<strong>in</strong>der <strong>of</strong><strong>the</strong> record and <strong>the</strong>n detrended <strong>the</strong> d 18 O time series with a100- year time w<strong>in</strong>dow. Relative variability was calcu<strong>late</strong>das: 1 P jx xj, where x is <strong>the</strong> d 18 O value <strong>of</strong> each sample,nand x <strong>the</strong> mean d 18 O value and n <strong>the</strong> number <strong>of</strong> data po<strong>in</strong>tswith<strong>in</strong> <strong>the</strong> mov<strong>in</strong>g w<strong>in</strong>dow. This measure <strong>of</strong> variability doesnot differentiate <strong>the</strong> frequency and magnitude <strong>of</strong> <strong>drought</strong>based on d 18 O. In addition, because our sample resolution atevery 5 years masks <strong>the</strong> <strong>in</strong>ter-annual variation <strong>in</strong> <strong>the</strong> <strong>drought</strong>regime, <strong>the</strong> relative variability, as def<strong>in</strong>ed here, is at best anapproximation <strong>of</strong> <strong>the</strong> real variability <strong>in</strong> <strong>the</strong> moisture regime.[14] Results <strong>in</strong>dicate much greater variability before1900 AD than after, with particularly pronounced variationdur<strong>in</strong>g certa<strong>in</strong> time <strong>in</strong>tervals (e.g. 1100–1700 AD). Some<strong>of</strong> <strong>the</strong>se periods <strong>of</strong> high variability were probably widespread.For example, <strong>drought</strong> variability at Moon Lake[Laird et al., 1996] was high <strong>in</strong> several time <strong>in</strong>tervals whenvariability was also high at Steel Lake (e.g., around 1600AD, 750 AD, 200 AD, and 200 BC; data not shown).Periods with variability similar to that <strong>of</strong> <strong>the</strong> 20th century atSteel Lake spanned a maximum <strong>of</strong> one to two centuries,and <strong>the</strong>y were <strong>in</strong>termittent among multi-centennial <strong>in</strong>tervals<strong>of</strong> greater variability (Figure 3b). In all, 90% <strong>of</strong> <strong>the</strong>variability values dur<strong>in</strong>g <strong>the</strong> last 3100 years were greaterthan <strong>the</strong> average <strong>of</strong> <strong>the</strong> 20th century. Thus <strong>drought</strong> variabilitywas anomalously low dur<strong>in</strong>g <strong>the</strong> 20th century. Thislow variability was atypical <strong>of</strong> <strong>the</strong> last 3100 years, and itprobably should not be expected as <strong>the</strong> prevail<strong>in</strong>g state <strong>of</strong>variability for <strong>the</strong> future.[15] To help elucidate <strong>the</strong> factors controll<strong>in</strong>g <strong>drought</strong>occurrence, we compared <strong>the</strong> 20th-century d 18 O data fromSteel Lake with several <strong>in</strong>dices <strong>of</strong> climatic modes (e.g.,PDO, AMO, PNA, and ENSO) that are known to <strong>in</strong>fluenceatmospheric circulation and <strong>the</strong> moisture regime <strong>of</strong> <strong>the</strong><strong>North</strong> <strong>American</strong> midcont<strong>in</strong>ent today [e.g., McCabe et al.,2004]. d 18 O is not significantly corre<strong>late</strong>d with <strong>the</strong> <strong>in</strong>dices<strong>of</strong> <strong>the</strong>se climatic modes except <strong>the</strong> PDO, a long-lived ElNiño-like pattern <strong>of</strong> sea surface temperature (SST) variabil-4<strong>of</strong>6
L23702 TIAN ET AL.: MIDWEST DROUGHT HISTORY L23702ity <strong>in</strong> <strong>the</strong> <strong>North</strong> Pacific. As illustrated <strong>in</strong> Figure 2, a highlysignificant, positive correlation (r = 0.63, n = 32, p
L23702 TIAN ET AL.: MIDWEST DROUGHT HISTORY L23702Haigh, J. D. (1996), The impact <strong>of</strong> solar variability on climate, Science,272, 981–984.Hu, F. S., D. Kaufman, S. Yoneji, D. Nelson, A. Shemesh, Y. Huang, J. Tian,G. Bond, B. Clegg, and T. Brown (2003), Cyclic variation and solarforc<strong>in</strong>g <strong>of</strong> <strong>Holocene</strong> climate <strong>in</strong> <strong>the</strong> Alaskan subarctic, Science, 301,1890–1893.Kunkel, K. E., R. A. Pielke, and S. A. Changnon (1999), Temporalfluctuations <strong>in</strong> wea<strong>the</strong>r and climate extremes that cause economic andhuman health impacts: A review, Bull. Am. Meteorol. Soc., 80, 1077–1098.Laird, K. R., S. C. Fritz, K. A. Maasch, and B. F. Cumm<strong>in</strong>g (1996), Greater<strong>drought</strong> <strong>in</strong>tensity and frequency before AD 1200 <strong>in</strong> <strong>the</strong> nor<strong>the</strong>rn GreatPla<strong>in</strong>s, USA, Nature, 384, 552–554.Laird, K. R., B. F. Cumm<strong>in</strong>g, S. Wunsam, J. A. Rusak, R. J. Oglesby,S. C. Fritz, and P. R. Leavitt (2003), Lake sediments record large-scaleshifts <strong>in</strong> moisture regimes across <strong>the</strong> nor<strong>the</strong>rn prairies <strong>of</strong> <strong>North</strong> Americadur<strong>in</strong>g <strong>the</strong> past two millennia, Proc. Natl. Acad. Sci. U. S. A., 100,2483–2488.Mantua, N. J., and S. R. Hare (2002), The Pacific Decadal Oscillation,J. Oceanogr., 58, 35–44.McCabe, G. J., M. A. Palecki, and J. L. Betancourt (2004), Pacific andAtlantic Ocean <strong>in</strong>fluences on multidecadal <strong>drought</strong> frequency <strong>in</strong> <strong>the</strong> UnitedStates, Proc. Natl. Acad. Sci. U. S. A., 101, 4136–4141.M<strong>in</strong>obe, S. (1999), Resonance <strong>in</strong> bidecadal and pentadecadal climate oscillationsover <strong>the</strong> <strong>North</strong> Pacific: Role <strong>in</strong> climatic regime shifts, Geophys.Res. Lett., 26, 855–858.Schulz, M., and M. Mudelsee (2002), REDFIT: Estimat<strong>in</strong>g red-noise spectradirectly from unevenly spaced paleoclimatic time series, Comput.Geosci., 28, 421–426.Sell<strong>in</strong>ger, C. E. (1996), Computer program for estimat<strong>in</strong>g evapotranspirationus<strong>in</strong>g <strong>the</strong> Thornthwaite method, pp.1–9, Great Lakes Environ. Res.Lab., Ann Arbor, Mich.Shen, C., W.-C. Wang, W. Gong, and Z. Hao (2006), A Pacific DecadalOscillation record s<strong>in</strong>ce 1470 AD reconstructed from proxy data <strong>of</strong> summerra<strong>in</strong>fall over eastern Ch<strong>in</strong>a, Geophys. Res. Lett., 33, L03702,doi:10.1029/2005GL024804.Stevens, L. R., J. R. Stone, J. Campbell, and S. C. Fritz (2006), A 2200-yrrecord <strong>of</strong> hydrologic variability from Foy Lake, Montana, USA, <strong>in</strong>ferredfrom diatom and geochemical data, Quat. Res., 65, 264–274.Tian, J. (2005), Varve chronology, proxy calibration, and <strong>Holocene</strong> climate<strong>of</strong> M<strong>in</strong>nesota, Ph.D. <strong>the</strong>sis, Univ. <strong>of</strong> Ill., Urbana, Ill.Tian, J., T. A. Brown, and F. S. Hu (2005), Comparison <strong>of</strong> varve and 14 Cchronologies from Steel Lake, M<strong>in</strong>nesota, USA, <strong>Holocene</strong>, 15, 510–517.T<strong>in</strong>g, M. F., and H. Wang (1997), Summertime US precipitation variabilityand its relation to Pacific sea surface temperature, J. Clim., 10, 1853–1873.Torrence, C., and G. P. Compo (1998), A practical guide to wavelet analysis,Bull. Am. Meteorol. Soc., 79, 61–78.Trenberth, K. E., G. W. Branstator, and P. A. Ark<strong>in</strong> (1988), Orig<strong>in</strong>s <strong>of</strong> <strong>the</strong>1988 <strong>North</strong> <strong>American</strong> <strong>drought</strong>, Science, 242, 1640–1645.Woodhouse, C. A., and J. T. Overpeck (1998), 2000 years <strong>of</strong> <strong>drought</strong>variability <strong>in</strong> <strong>the</strong> central United States, Bull. Am. Meteorol. Soc., 79,2693–2714.Worster, D. (1979), Dust Bowl: The Sou<strong>the</strong>rn Pla<strong>in</strong>s <strong>in</strong> <strong>the</strong> 1930s, 277 pp.,Oxford Univ. Press, New York.Wright, H. E., I. Stefanova, J. Tian, T. A. Brown, and F. S. Hu (2004), Achronological framework for <strong>the</strong> <strong>Holocene</strong> vegetational history <strong>of</strong> centralM<strong>in</strong>nesota: The Steel Lake pollen record, Quat. Sci. Rev., 23, 611 – 626.Yu, Z. C., and E. Ito (1999), <strong>Possible</strong> solar forc<strong>in</strong>g <strong>of</strong> century-scale <strong>drought</strong>frequency <strong>in</strong> <strong>the</strong> nor<strong>the</strong>rn Great Pla<strong>in</strong>s, Geology, 27, 263–266.F. S. Hu and J. Tian, Department <strong>of</strong> Geology, University <strong>of</strong> Ill<strong>in</strong>ois atUrbana-Champaign, 245 National History Build<strong>in</strong>g, 1301 W. Green Street,Urbana, IL 61801, USA. (fshu@life.uiuc.edu)D. M. Nelson, Program <strong>in</strong> Ecology and Evolutionary Biology, University<strong>of</strong> Ill<strong>in</strong>ois at Urbana-Champaign, 265 Morrill Hall, 505 S. Goodw<strong>in</strong>Avenue, Urbana, IL 61801, USA.6<strong>of</strong>6