L22 - Tata AIA Life Insurance
L22 - Tata AIA Life Insurance
L22 - Tata AIA Life Insurance

Create successful ePaper yourself
Turn your PDF publications into a flip-book with our unique Google optimized e-Paper software.
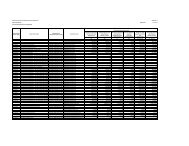
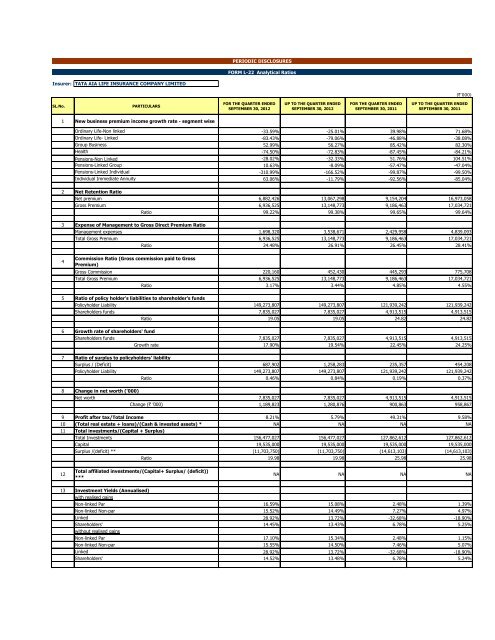
PERIODIC DISCLOSURESFORM L-22 Analytical RatiosInsurer: TATA <strong>AIA</strong> LIFE INSURANCE COMPANY LIMITED(`’000)SL.No.PARTICULARSFOR THE QUARTER ENDEDSEPTEMBER 30, 2012UP TO THE QUARTER ENDEDSEPTEMBER 30, 2012FOR THE QUARTER ENDEDSEPTEMBER 30, 2011UP TO THE QUARTER ENDEDSEPTEMBER 30, 20111 New business premium income growth rate - segment wiseOrdinary <strong>Life</strong>-Non linked -33.59% -25.01% 39.98% 71.68%Ordinary <strong>Life</strong>- Linked -83.43% -79.06% -46.88% -38.08%Group Business 52.99% 56.27% 85.42% 82.30%Health -74.50% -72.83% -87.45% -84.21%Pensions-Non Linked -28.02% -32.33% 51.76% 104.51%Pensions-Linked Group 10.63% -8.09% -57.47% -47.04%Pensions-Linked Individual -310.99% -166.52% -99.87% -99.50%Individual Immediate Annuity 63.06% -11.79% -92.56% -85.04%2 Net Retention RatioNet premium 6,882,426 13,067,298 9,154,204 16,973,058Gross Premium 6,936,525 13,148,773 9,186,463 17,034,721Ratio 99.22% 99.38% 99.65% 99.64%3 Expense of Management to Gross Direct Premium RatioManagement expenses 1,698,320 3,538,671 2,429,958 4,839,093Total Gross Premium 6,936,525 13,148,773 9,186,463 17,034,721Ratio 24.48% 26.91% 26.45% 28.41%4Commission Ratio (Gross commission paid to GrossPremium)Gross Commission 220,160 452,430 445,293 775,708Total Gross Premium 6,936,525 13,148,773 9,186,463 17,034,721Ratio 3.17% 3.44% 4.85% 4.55%5 Ratio of policy holder's liabilities to shareholder's fundsPolicyholder Liability 149,273,807 149,273,807 121,939,242 121,939,242Shareholders funds 7,835,027 7,835,027 4,913,515 4,913,5156 Growth rate of shareholders' fundRatio 19.05 19.05 24.82 24.82Shareholders funds 7,835,027 7,835,027 4,913,515 4,913,5157 Ratio of surplus to policyholders' liabilityGrowth rate 17.90% 19.54% 22.45% 24.25%Surplus / (Deficit) 687,902 1,258,283 235,357 454,208Policyholder Liability 149,273,807 149,273,807 121,939,242 121,939,2428 Change in net worth ('000)Ratio 0.46% 0.84% 0.19% 0.37%Net worth 7,835,027 7,835,027 4,913,515 4,913,515Change (` ’000) 1,189,823 1,280,876 900,863 958,8679 Profit after tax/Total Income 8.21% 5.79% 49.31% 9.58%10 (Total real estate + loans)/(Cash & invested assets) * NA NA NA NA11 Total investments/(Capital + Surplus)Total Investments 156,477,027 156,477,027 127,862,612 127,862,612Capital 19,535,000 19,535,000 19,535,000 19,535,000Surplus /(deficit) ** (11,703,750) (11,703,750) (14,613,103) (14,613,103)Ratio 19.98 19.98 25.98 25.9812Total affiliated investments/(Capital+ Surplus/ (deficit))***NA NA NA NA13 Investment Yields (Annualised)with realised gainsNon-linked Par 16.59% 15.08% 2.48% 1.39%Non-linked Non-par 15.52% 14.49% 7.27% 4.97%Linked 28.92% 13.72% -32.68% -18.90%Shareholders' 14.45% 13.43% 6.78% 5.25%without realised gainsNon-linked Par 17.10% 15.34% 2.48% 1.15%Non-linked Non-par 15.55% 14.50% 7.46% 5.07%Linked 28.92% 13.72% -32.68% -18.90%Shareholders' 14.52% 13.48% 6.78% 5.24%
PERIODIC DISCLOSURESFORM L-22 Analytical RatiosInsurer: TATA <strong>AIA</strong> LIFE INSURANCE COMPANY LIMITED(`’000)SL.No.PARTICULARSFOR THE QUARTER ENDEDSEPTEMBER 30, 2012UP TO THE QUARTER ENDEDSEPTEMBER 30, 2012FOR THE QUARTER ENDEDSEPTEMBER 30, 2011UP TO THE QUARTER ENDEDSEPTEMBER 30, 201114 Conservation RatioOrdinary <strong>Life</strong>-Non linked 85.70% 121.54% 89.09% 88.71%Ordinary <strong>Life</strong>- Linked 56.49% 71.74% 71.92% 75.21%Group Business 56.29% 90.83% 76.40% 84.85%Health 86.19% 104.82% 35.08% 34.22%Pensions Non Linked 9.18% 98.65% 10.83% 15.35%Pensions Linked Group 0.00% 0.00% 0.00% 0.00%Pensions Linked Individual 75.08% 81.24% 82.21% 91.74%Total 63.35% 85.41% 70.37% 74.34%15 Persistency Ratios - By Premium $Non Linked BusinessFor 13th month 74.11% 66.60% 72.02% 63.64%For 25th month 49.48% 46.88% 47.58% 46.07%For 37th month 42.79% 41.55% 52.28% 49.84%For 49th Month 49.96% 47.04% 39.39% 35.10%for 61st month 51.23% 42.82% 44.69% 45.73%Linked BusinessFor 13th month 76.25% 66.68% 78.20% 73.72%For 25th month 62.50% 62.98% 68.81% 66.44%For 37th month 52.15% 45.34% 73.89% 74.37%For 49th Month 35.47% 40.09% 71.76% 69.58%for 61st month 29.83% 29.19% 60.37% 60.37%Persistency Ratios - By Policy $Non Linked BusinessFor 13th month 51.81% 48.33% 43.98% 40.20%For 25th month 24.52% 24.04% 15.74% 15.20%For 37th month 12.49% 11.94% 16.82% 15.04%For 49th Month 14.47% 13.00% 13.49% 11.93%for 61st month 12.12% 10.71% 15.13% 15.53%Linked BusinessFor 13th month 70.62% 65.08% 64.21% 64.99%For 25th month 54.47% 53.77% 53.72% 56.21%For 37th month 46.04% 42.12% 53.42% 48.29%For 49th Month 32.78% 33.18% 45.70% 44.54%for 61st month 32.79% 34.32% 43.70% 46.33%16 NPA RatioGross NPA Ratio NIL NIL NIL NILNet NPA Ratio NIL NIL NIL NILEquity Holding Pattern for <strong>Life</strong> Insurers1 (a) No. of shares (in '000) 1,953,500 1,953,500 1,953,500 1,953,5002 (b) Percentage of shareholding (Indian / Foreign)345Indian 74% 74% 74% 74%Foreign 26% 26% 26% 26%(c) %of Government holding (in case of public sector insurancecompanies)(a) Basic and diluted EPS before extraordinary items (net of taxexpense) for the period (not to be annualized)(b) Basic and diluted EPS after extraordinary items (net of taxexpense) for the period (not to be annualized)NA NA NA NA0.61 0.65 0.47 0.500.61 0.65 0.47 0.506 (iv) Book value per share (`) 4.01 4.01 2.52 2.52* The Company does not have any investment in Real estate and has not advanced any loans; therefore, this ratio cannot be calculated.** Surplus/(deficit) represents profit and loss account debit balance and miscellaneous expenditure to the extent not written off or adjusted*** The Company does not have any affiliated investments and therefore this ratio cannot be calculated$ 1) Persistency ratios have been calculated based on the data as at 30th Sep 2012 for those policies where premiums are due and are based on modal premium.2) Persistency ratios given above are to be read as follows: for e.g., 25th month's for 2012 is based on the new business written from 1st October 2010 to 30th September 2011 and 25th month's for 2011 isbased on the new business written from 1st October 2009 to 30th September 2010 and so on.3) Single pay, riders & group policies are not included in the persistency ratio.