Models in GIS Cartographic models Spatio-temporal models
Models in GIS Cartographic models Spatio-temporal models
Models in GIS Cartographic models Spatio-temporal models

Create successful ePaper yourself
Turn your PDF publications into a flip-book with our unique Google optimized e-Paper software.
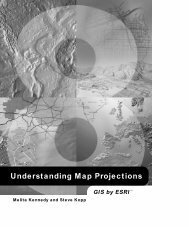
<strong>Models</strong> <strong>in</strong> <strong>GIS</strong>A model is a description of realityIt may be:Dynamic or StaticDynamic spatial <strong>models</strong>Static spatial <strong>models</strong>Spatial <strong>Models</strong>Focus on computer based <strong>models</strong> ofspatial phenomenaThree classes:<strong>Cartographic</strong> <strong>models</strong><strong>Spatio</strong>-<strong>temporal</strong> <strong>models</strong>Network <strong>models</strong><strong>Cartographic</strong> <strong>models</strong>Application of spatial operations such asbuffers, <strong>in</strong>terpolation, reclassification, andoverlay to solve problemsFor example, suitability analyses; see Labs 9 and 10•Often <strong>temporal</strong>ly static; values don’t change dur<strong>in</strong>g themodel period•It may <strong>in</strong>clude a <strong>temporal</strong> component when it compareschange through time (compar<strong>in</strong>g vegetation <strong>in</strong> 1990 tovegetation <strong>in</strong> 2000)<strong>Spatio</strong>-<strong>temporal</strong> <strong>models</strong>•Dynamic <strong>in</strong> both space and time•Time passes explicitly with<strong>in</strong> therunn<strong>in</strong>g of the model•Changes <strong>in</strong> time-driven process operateon spatial variables
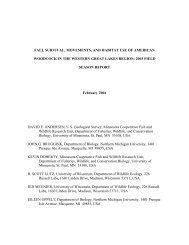
<strong>Cartographic</strong> model<strong>in</strong>gComb<strong>in</strong>e general data sets, functions, and operations <strong>in</strong> asequence to answer questions, typically produc<strong>in</strong>g anoutput map from various <strong>in</strong>put mapsExamples:-distribution of suitable habitats, viable populations-migration route/corridor studies-water distribution systems, natural and constructed-species <strong>in</strong>vasions-mill site selection-harvest schedul<strong>in</strong>g-pollution response plann<strong>in</strong>g<strong>Cartographic</strong> model<strong>in</strong>g<strong>Cartographic</strong><strong>models</strong>Often representedwith flowcharts;graphicallyrepresent<strong>in</strong>g thespatial data,operations andtheir sequenceComb<strong>in</strong>ations as an additiveprocess
Discrete and Cont<strong>in</strong>uous Rank<strong>in</strong>gsThe Basis for Rank<strong>in</strong>gsExample Weight<strong>in</strong>gs – Distance to RoadsExample – slope suitability rank<strong>in</strong>g
Weight<strong>in</strong>gs Among Layers:How do you comb<strong>in</strong>e the rank<strong>in</strong>gsfrom various layers? The relativeweights among your <strong>in</strong>put layerswill substantially affect therelative suitabilities you predict.Determ<strong>in</strong><strong>in</strong>g Weights• Unscaled• Common scale• Client or Expert Survey(iterative)• Rank order weightsRank Order Determ<strong>in</strong>ation of Weights
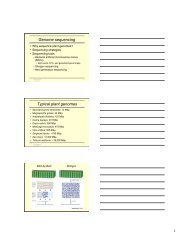
20 operations15 data layers20 operations15 data layers
20 operations15 data layers20 operations15 data layers20 operations15 data layers
20 operations15 data layers20 operations15 data layers