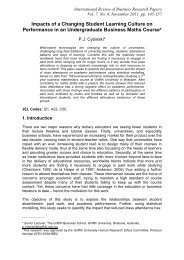
Uzoka and Seleka 21Level 1 –Goal Level 2-criteria Level 3 – VariablesPer<strong>for</strong>mancemeasurement<strong>of</strong> Pr<strong>of</strong>essionalPr<strong>of</strong>essionalDevelopment (PFD)Finance and Budget(FNB)Codes and standards (CDS), position papers(PSP), Technical visits (TCV), Workshops andseminars (WSS), conferences (CFS), Researchand Publications (RPB), Mandatory ContinuingPr<strong>of</strong>essional Development (MCP)Donations/Benevolence (DBV), Pr<strong>of</strong>itableInvestments (PFI), Budget Per<strong>for</strong>mance (BGP),Revenue Generation (RGT)Organization Membership Jobs/IT placement (JIT), Pr<strong>of</strong>essionalServices (MBS) Examination (PFE), Arbitrations (ARB),(PMPO)Membership Drive (MBD), Subscriptions (SBS).Human Resources Staff Recruitment (STR), Staff Training andManagement Development (STD), Staff Compensation(STC), Staff Motivation (STM), StaffPer<strong>for</strong>mance <strong>Evaluation</strong> (SPE)Figure 1 – Hierarchy <strong>of</strong> Per<strong>for</strong>mance Measurement CriteriaMeasurement <strong>of</strong> preferences involves a pairwise comparison <strong>of</strong> decision variables, which areverbal statements about the strength <strong>of</strong> importance <strong>of</strong> a variable over another, representednumerically on an absolute scale. The comparison is done from the top level <strong>of</strong> the hierarchyto the bottom level in order to establish the overall priority index. If two varaiables are <strong>of</strong>equal importance, the rating <strong>of</strong> the comparison is 1. If variable A is strongly more importantthan variable B, then the rating <strong>of</strong> the comparison (AB) could be 7. If A is weakly moreimportant, the rating is 3. The reciprocal <strong>of</strong> the ratings show the converse <strong>of</strong> the relativeimportance. To obtain a fair judgment <strong>of</strong> the comparisons, mean values <strong>of</strong> the comparisonratings made by the seventy two pr<strong>of</strong>essionals were used in <strong>for</strong>mulating the pairwisecomparison (PWC) matrix <strong>of</strong> the variables in levels 2 and 3 <strong>of</strong> Figure 1. The Pairwisecomparison (PWC) matrix <strong>for</strong> the level 2 criteria is shown in Table 3, while that <strong>of</strong> level 3variables (<strong>for</strong> pr<strong>of</strong>essional development) is shown in Table 4.21
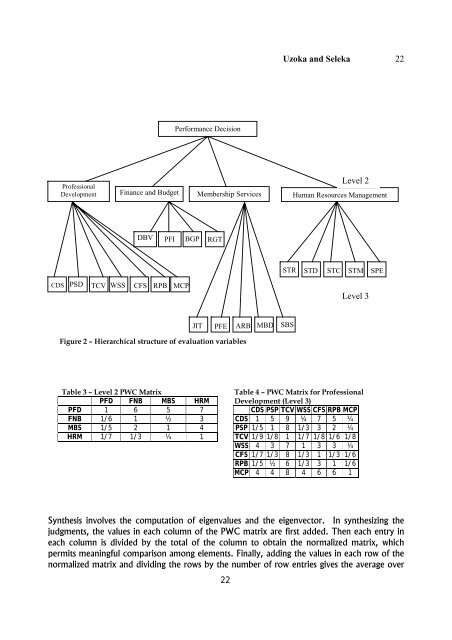
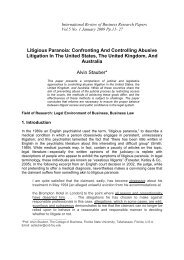
Uzoka and Seleka 22Per<strong>for</strong>mance DecisionLevel 2Pr<strong>of</strong>essionalDevelopment Finance and Budget Membership Services Human Resources ManagementDBVPFIBGPRGTSTR STD STC STM SPECDS PSD TCV WSS CFS RPB MCPLevel 3JIT PFE ARB MBD SBSFigure 2 – Hierarchical structure <strong>of</strong> evaluation variablesTable 3 – Level 2 PWC MatrixPFD FNB MBS HRMPFD 1 6 5 7FNB 1/6 1 ½ 3MBS 1/5 2 1 4HRM 1/7 1/3 ¼ 1Table 4 – PWC Matrix <strong>for</strong> Pr<strong>of</strong>essionalDevelopment (Level 3)CDS PSP TCV WSS CFS RPB MCPCDS 1 5 9 ¼ 7 5 ¼PSP 1/5 1 8 1/3 3 2 ¼TCV 1/9 1/8 1 1/7 1/8 1/6 1/8WSS 4 3 7 1 3 3 ¼CFS 1/7 1/3 8 1/3 1 1/3 1/6RPB 1/5 ½ 6 1/3 3 1 1/6MCP 4 4 8 4 6 6 1Synthesis involves the computation <strong>of</strong> eigenvalues and the eigenvector. In synthesizing thejudgments, the values in each column <strong>of</strong> the PWC matrix are first added. Then each entry ineach column is divided by the total <strong>of</strong> the column to obtain the normalized matrix, whichpermits meaningful comparison among elements. Finally, adding the values in each row <strong>of</strong> thenormalized matrix and dividing the rows by the number <strong>of</strong> row entries gives the average over22