(Wessex) Technology Assessment ChromoQuant⢠(version 1)
(Wessex) Technology Assessment ChromoQuant⢠(version 1)
(Wessex) Technology Assessment ChromoQuant⢠(version 1)

Create successful ePaper yourself
Turn your PDF publications into a flip-book with our unique Google optimized e-Paper software.
National Genetics Reference Laboratory(<strong>Wessex</strong>)<strong>Technology</strong><strong>Assessment</strong>ChromoQuant (<strong>version</strong> 1)in vitro diagnostic test kit foranalysis of commonchromosomal disordersSeptember 2005
Table of ContentsAbstract…...…………………………………………………………………………….…11. Introduction .......................................................................................................... 22. Materials and Methods......................................................................................... 22.1 ChromoQuant (<strong>version</strong> 1) kit composition.............................................................................. 22.2 DNA purification and preparation.............................................................................................. 32.3 Multiplex PCR amplification...................................................................................................... 32.4 Electrophoresis of amplified products ....................................................................................... 42.5 Data analysis and interpretation ............................................................................................... 43. Results .................................................................................................................. 63.1 Marker Information ................................................................................................................... 63.1.1 Marker Heterozygosity ....................................................................................................... 63.1.2 Inconsistent and Inconclusive Ratios.................................................................................. 63.1.3 Individual marker failures ................................................................................................... 73.2 Retrospectively collected tissue samples.................................................................................. 83.2.1 ChromoQuant Results concordant with karyotype .............................................................. 83.2.2 ChromoQuant Result ambiguous but not necessarily discordant with karyotype ................. 83.2.3 ChromoQuant Results discordant with karyotype ............................................................... 83.2.3.1 Discordant results due to limitations of QF PCR technique........................................... 83.2.3.2 Discordant results specific to ChromoQuant................................................................. 93.3 Prospectively collected amniotic fluid samples.......................................................................... 93.3.1 ChromoQuant Results concordant with karyotype .............................................................. 93.3.2 ChromoQuant Result ambiguous but not necessarily discordant with karyotype ................. 93.3.3 ChromoQuant Results discordant with karyotype ............................................................. 103.3.3.1 Discordant results due to limitations of QF PCR technique......................................... 103.3.3.2 Discordant results specific to ChromoQuant............................................................... 103.4 Inclusion of sex chromosome markers.................................................................................... 133.5 Extra markers......................................................................................................................... 143.6 Marker specific problems........................................................................................................ 143.6.1 Marker C (Chr 18 – tube 1) .............................................................................................. 143.6.2 Marker O (Chr 21 – tube 2) .............................................................................................. 143.6.3 Marker P (Chr 21 tube 2) ................................................................................................ 163.6.4 Marker K (Xq/Yq – tube 2)................................................................................................ 173.6.5 Marker Q (Chr X – tube 2)................................................................................................ 183.7 Unequal amplification of markers............................................................................................ 183.8 Effects of DNA extraction method........................................................................................... 213.9 General Comments on ChromoQuant protocol ....................................................................... 224. Conclusions........................................................................................................ 224.1 Marker and Primer Information ............................................................................................... 224.2 Informativity............................................................................................................................ 224.3 Single Marker Assays............................................................................................................. 224.4 Sex Chromosome Markers..................................................................................................... 224.5 Unbalanced Amplification ....................................................................................................... 234.6 DNA Extraction....................................................................................................................... 234.7 ChromoQuant Version 2......................................................................................................... 235. References.......................................................................................................... 246. Appendix 1: Examples of Genotyper traces................................................................ 26
ABSTRACTAt the time of writing (September 2005) ChromoQuant is the first and only prenatal diagnostic testkit available worldwide which is CE marked and therefore compliant with the In Vitro Medical DevicesDirective (98/79/EC). This QF PCR based kit is produced and marketed by Cybergene AB . The kit isCE marked for the prenatal diagnosis of trisomy 13, 18, 21 and sex chromosome aneuploidy. NGRL(<strong>Wessex</strong>) has performed a technology assessment of ChromoQuant <strong>version</strong> 1 by analysingretrospectively collected DNA samples (n=87) from normal controls and a variety of aneuploidsamples and a prospectively collected series of amniotic fluid samples (n=91).Our results can be summarised as follows:· 59% of samples had ChromoQuant results that were concordant with the sample karyotypeand which could have been reported either following initial analysis or after additional analysiswith extra markers to ensure that there were two informative markers for each chromosome.· 35% of samples produced ambiguous results that would have required followup studies dueto skewed allele ratios for individual markers or because of lack of informativity forchromosome X. Single marker assays are not available for ChromoQuant <strong>version</strong> 1 andtherefore these ambiguous results could not be resolved. Additional markers for X and Y werenot available for use with ChromoQuant <strong>version</strong> 1.· 6% of samples produced results that were discordant with the reported karyotype (or we wereunable to verify the karyotype). 70% of these discordant results were due to limitations of theQFPCR technique e.g. low level mosaicism and maternal cell contamination and 30% werespecific to ChromoQuant.· Of the 35% of samples which showed ambiguous results 90% of these problems wereassociated with markers C (Chromosome 18), O and P (Chromosome 21).ChromoQuant <strong>version</strong> 1 is technically easy to use, CE marked and therefore IVD compliant.However, interpretation of results is not straightforward and the kit is unable to cope with variablesample quality, it often produces ambiguous results which cannot be resolved due to the lack of singlemarker assays and the kit has a high failure rate for some markers. Many of these problems havebeen addressed in a revised (ChromoQuant <strong>version</strong> 2) <strong>version</strong> of the kit (see accompanying report fordetails).1
1. INTRODUCTIONInvasive prenatal diagnosis is offered routinely to pregnant women who have been identified ashaving an increased risk of foetal chromosome abnormalities. Pregnancies at high risk are identifiedby serum or ultrasound screening, advanced maternal age or because one parent is known to carry achromosome abnormality. Invasive sampling takes place at either 1012 weeks (chorionic villussampling) or 1520 weeks (amniocentesis) and diagnosis has traditionally been based on karyotypeanalysis which can detect both numerical and structural chromosome abnormalities. The mostcommonly detected abnormalities are trisomies for chromosome 21 (Down syndrome), chromosome18 (Edwards syndrome), chromosome 13 (Patau syndrome) and sex chromosome aneuploidy(leading to syndromes such as Turner (monosomy X) and Klinefelter (XXY)). Karyotype analysis ofchorionic villus (CV) and amniotic fluid (AF) samples requires cell culture to obtain cells at themetaphase stage and skilled analysis of resulting banded chromosome preparations is also essential.Currently the UK average reporting times for full karyotype analysis are 13.5 days for AF (5.5%abnormality detection rate) with a range of 7.2 – 18.9 days and 14.8 days for CV (16.9% abnormalitydetection rate) with a range of 7.9 – 23.6 days (UK NEQAS 2002/2003). In an effort to improvepregnancy management and alleviate maternal anxiety rapid aneuploidy detection techniques arenow being implemented into routine prenatal diagnosis e.g. interphase FISH, quantitative fluorescentPCR (QF PCR), multiplex ligation dependent amplification (MLPA). These tests are usually capable ofdelivering results within 13 days and are viewed as a prelude to, rather than a replacement of, fullkaryotype analysis.Rapid prenatal aneuploidy tests need to fulfil certain criteria: the assay must be accurate and no falsepositive results should be obtained as this could result in the termination of a healthy pregnancy. Thetest should be robust enough to cope with variable sample quality, provide unambiguous results andhave a low failure rate. Ambiguous results have the potential to increase maternal anxiety and cancause delays in reporting while additional investigations are carried out. The test should be adaptableto cope with high sample throughput and test costs should be low since rapid tests are oftenperformed in addition to karyotyping. Ideally, the test should be able to detect maternal cellcontamination (MCC), mosaicism and triploidy (Mann et al., 2004).QF PCR analysis of short tandem repeats (STR) is being used successfully in many UK andEuropean laboratories for the rapid diagnosis of prenatal aneuploidy (e.g. Verma et al., 1998; Pertl etal., 1999; Schmidt et al., 2000; Cirigliano et al., 2001; Levett et al., 2001; Mann et al., 2001).Chromosome specific polymorphic repeat sequences, which vary in length between individuals, areamplified using fluorescent primers. The PCR amplicons are analysed using an automated geneticanalyser capable of 2bp resolution and the representative amount of each allele is quantified bycalculating the ratio of the peak height or area using appropriate software.ChromoQuant is currently (September 2005) the first and only prenatal diagnostic test kit availableworldwide which is CE marked and therefore compliant with the In Vitro Medical Devices Directive(98/79/EC). This QF PCR based kit is produced and marketed by Cybergene AB . The kit is CE markedfor the prenatal diagnosis of trisomy 13, 18, 21 and sex chromosome aneuploidy. NGRL (<strong>Wessex</strong>)has performed a technology assessment of the kit by analysing retrospectively collected DNAsamples (n=87) from normal controls and a variety of aneuploid samples and a prospectivelycollected series of amniotic fluid samples (n=91). All samples were anonymised.2. MATERIALS AND METHODS2.1 ChromoQuant (<strong>version</strong> 1) kit compositionChromoQuant (<strong>version</strong> 1) is supplied with prealiquoted primer mixes frozen in a 12 x 8 stripformat, PCR strip caps, 1X enzyme dilution buffer and 1X QF PCR Buffer. Taq polymerase needs tobe supplied by the user and Cybergene AB recommend the use of Promega Taq (#1661 or 1665).Samples are tested using a 2 tube multiplex where 17 tetranucleotide STRs are analysed in total;four for each of chromosomes 13 & 18 (tube 1) and chromosome 21 (tube 2) and five for the sexchromosomes (distributed between tubes 1 and 2). Each kit will test 48 samples.2
Reagents are stable for 1 year at 18°C and unused primer mix tubes and the QF PCR buffer can bestored in the dark at 18°C. The enzyme dilution buffer can be stored at 4 8°C.2.2 DNA purification and preparationRetrospectively collected DNA samples (normal controls, n=37; trisomy 18, n=16; trisomy 13, n=10;trisomy 21, n=21; sex chromosome aneuploidy, n=7) and DNA samples from 0.75 – 1ml prospectivelycollected amniotic fluid samples (n=91) were tested using ChromoQuant (<strong>version</strong> 1). Reagents forextraction of DNA from amniotic fluid samples are not supplied with the kit. For this evaluation, DNAwas extracted from amniotic fluid using either InstaGene Matrix (BIORAD) or the EZ1 DNA tissue kit(QIAGEN) in conjunction with the BioRobot EZ1 Workstation (QIAGEN). No chorionic villus sampleswere evaluated.The kit recommends the use of 100ng DNA at a concentration of 10 – 20ng/μl. For this evaluation theretrospectively collected DNA samples were quantified and diluted to 10ng/μl and the amniotic fluidDNA samples were tested using 10μl of the InstaGene DNA solution (not quantified).2.3 Multiplex PCR amplificationDNA (100ng) was added to the PCR master mix (25μl final reaction volume) and amplified using thePCR conditions specified in the ChromoQuant protocol:94°C 3 min94°C 30 sec57°C 1 min 26 cycles71°C 2 min71°C 5 min60°C 1 hour4°C HOLDSamples were tested using a 2 tube multiplex where 17 tetranucleotide STRs were analysed in total;four for each of chromosomes 13 & 18 (tube 1) and chromosome 21 (tube 2) and five for the sexchromosomes (distributed between tubes 1 and 2, figure 1). A positive and a negative control wereincluded in each PCR run.3
a) Tube 1Marker Location Chromosome Size bp Colour DyeA Xp22.122.31 X/Y (AMEL)X:104106Y:112114 Green HEXB 18pter18p11.22 18 135185 Green HEXC 18q22.3q23 18 155205 Blue 6FAMD Xq26.1 X 260304 Blue 6FAME 13q11q21.1 13 230326 Green HEXF 18q22.1q22.2 18 330405 Green HEXG 13q14.3q22 13 380445 Blue 6FAMH 13q31q32 13 420475 Yellow NEDI 13q12.113q14.1 13 425470 Green HEXb) Tube 2J 18q12.2q12.3 18 450500 Blue 6FAMMarker Location Chromosome Size bp Colour DyeQ Xq26 X 93119 Blue 6FAMR Yp11.3 Y 206 Blue 6FAMK (PAR 2) Xq/Yq X/Y 190250 Green HEXL 21q21 21 220285 Blue 6FAMN 21q22.221qter 21 260305 Green HEXO 21q22.1 21 435475 Blue 6FAMP 21q22.1 21 445500 Green HEXFigure 1: STR Marker information supplied in ChromoQuant <strong>version</strong> 1. STR marker names, cytogenetic locations,amplified size ranges and fluorescent label for a) tube 1 (analysis of chromosomes 13 and 18) and b) tube 2 (analysisof chromosome 21)2.4 Electrophoresis of amplified productsInstructions supplied with ChromoQuant recommend that PCR amplicons are desalted prior toanalysis. However, laboratories that currently run a QF PCR service do not desalt samples and UKClinical Molecular Genetics Society (CMGS) best practice guidelines advise that no post PCR cleanup is required. Desalting of samples requires postPCR tube transfers which are undesirable and mayincrease the risk of PCR contamination. We evaluated the effect of desalting by testing 32 sampleswith ChromoQuant <strong>version</strong> 1 and analysing them before and after desalting. The results from thesamples analysed directly after PCR and those analysed after desalting using Multiscreen PCR μ96plates (Millipore) were 100% concordant and all allele ratios were accurately preserved. We thereforesuggest that desalting of the samples is not required and the results presented in this report are fromsamples which were not desalted prior to analysis.ChromoQuant is compatible for use with Applied Biosystems® Genetic Analysers that support dyeset D and with the Amersham Biosciences MegaBACE 500 using filter set 2. These analyserssupport the use of 6FAM, HEX, ROX and NED.For this evaluation, amplicons were analysed using an Applied Biosystems 3100 Genetic Analyser. Astandard run module was used which allows analysis of fragments from 90 – 500 nucleotides usingthe ABI GeneScan – 500 [ROX] size standard.2.5 Data analysis and interpretationData were analysed with Genotyper 3.7 (Applied Biosystems) using macros written by NGRL(<strong>Wessex</strong>) to analyse the markers in tubes 1 and 2 (section 2.3). Genotyper 3.7 was used to determinethe size and peak height (and area) of amplicons present within the designated size range for eachmarker. The ratio of the peak heights (as recommended in the ChromoQuant protocol) was calculatedusing the macro and results were then exported into Excel. Data were analysed according to theCMGS best practice guidelines and the ChromoQuant protocol. Allele dosage ratios between 0.8 –4
1.4 were defined as normal (a ratio of 1.5 was considered acceptable if the alleles were separated bymore than 24bp), ratios of >1.8 or 0.8 or < 1.4Trisomic (3 alleles)Expected allele ratio is 1:1:14bp4bpTrisomic (3 alleles)Expected allele ratio is 2:1Result classified as trisomic if alleleratio is> 1.8 or < 0.654bpFigure 2: Interpretation of Data. Allele ratios can be uninformative, normal (2 alleles with a 1:1 ratio), trisomic (3alleles) or trisomic (3 alleles with a 2:1 ratio)5
3. RESULTSRetrospectively collected DNA samples (normal controls, n=37; trisomy 18, n=16; trisomy 13, n=10;trisomy 21, n=21; sex chromosome aneuploidy, n=7) were analysed using ChromoQuant <strong>version</strong>1). DNA had been extracted from a variety of tissues including; lymphoblastoid cell lines, skin,muscle, placenta and villi, cultured amniocytes, fibroblasts, urine, mouthbrush, blood and foetaltissue. DNA samples from prospectively collected amniotic fluid samples (n=91) were also analysed.3.1 Marker Information3.1.1 Marker HeterozygosityThe percentage heterozygosity for the autosomal markers was determined from the analysis of 178samples. Details are shown in table 1.Tube 1Tube 2Marker Location % HeterozygosityB (18) 18pter18p11.22 73C (18) 18q22.3q23 60E (13) 13q11q21.1 92F (18) 18q22.1q22.2 87G (13) 13q14.3q22 86H (13) 13q31q32 78I (13) 13q12.1q14.1 74J (18) 18q12.2q12.3 78L (21) 21q21 84N (21) 21q22.221qter 74O (21) 21q22.1 56P (21) 21q22.1 72Table 1: % Heterozygosity for autosomal markersMarkers C and O showed low heterozygosity (60 and 56% respectively) in our test population. Othermarkers demonstrated greater than 70% heterozygosity. Marker E (chromosome 13) had the highest% heterozygosity (92%).3.1.2 Inconsistent and Inconclusive RatiosTable 2 shows the frequency of inconsistent allele ratios (i.e. one marker allele ratio suggested thepresence of three alleles when other informative markers for the same chromosome demonstratednormal diallelic ratios) and inconclusive allele ratios (i.e. the allele ratio falls between 0.65 and 0.8 orbetween 1.4 and 1.8) detected for each autosomal marker.6
Tube 1Tube 2MarkerMarkerRange(bp)Retrospectively collectedsamples (n=87)InconsistentRatio (%)InconclusiveRatio (%)Prospectively collectedamniotic fluid samples(n=91)InconsistentRatio (%)InconclusiveRatio (%)B (18) 135 – 185 0 0 0 0C (18) 155 – 205 6 1 6.5 8E (13) 230 – 326 0 0 0 1F (18) 330 – 405 2 1 3 1G (13) 380 – 445 0 0 1 0H (13) 420 – 475 0 1 1 0I (13) 425 – 470 0 0 0 1J (18) 450 – 500 0 0 3 0L (21) 220 – 285 1 1 1 0N (21) 260 – 305 0 0 1 0O (21) 435 – 475 0 4 5 6P (21) 445 500 5 14 22 20Table 2: Percentage of inconsistent and inconclusive allele ratios obtained for autosomal markers for retrospectivelyand prospectively collected samplesMarkers C, O and P had the highest frequency of inconsistent or inconclusive allele ratios in bothsample populations.3.1.3 Individual marker failuresThe percentage failure rate for individual markers is shown in table 3. Markers were considered to fallinto this category if they failed to amplify, were too weak/strong to analyse or for technical reasonse.g. bleedthrough. Results from total tube failures are not included.Tube 1Tube 2MarkerMarker Retrospectively collected Prospectively collectedRange samples (n=87) amniotic fluid samples (n=91)(bp) Failure rate (%) Failure rate (%)B (18) 135 – 185 0 0C (18) 155 – 205 1 1E (13) 230 – 326 0 0F (18) 330 – 405 2 2G (13) 380 – 445 0 0H (13) 420 – 475 0 2I (13) 425 – 470 6 2J (18) 450 – 500 1 6L (21) 220 – 285 0 0N (21) 260 – 305 0 0O (21) 435 – 475 6 13P (21) 445 500 8 25Table 3: Percentage failure rates for autosomal markers (total tube failures excluded)7
3.2 Retrospectively collected tissue samplesResults for this section are summarized in table 4.3.2.1 ChromoQuant Results concordant with karyotypeThe results from ChromoQuant <strong>version</strong> 1 were concordant with the karyotype for 54 of the 87samples (62%). 43 of the 54 (80%, 49.4% of samples tested) could be confidently interpreted withoutany further testing being required. The remaining 11 samples (20%) required additional tests to becarried out for the following reasons:· Informativity (n=11)2 had only one informative marker for Chromosome 133 had only one informative marker for Chromosome 186 had only one informative marker for Chromosome 21When these samples were tested with sets of extra markers supplied with <strong>version</strong> 1 (section 3.5)there were at least 2 informative markers for each sample.3.2.2 ChromoQuant Result ambiguous but not necessarily discordant with karyotype27 samples (31%) would have required additional testing to clarify single marker results that eithershowed inconclusive or inconsistent allele ratios. No single marker assays (for markers in tubes 1 and2) are available for use with the ChromoQuant kit and therefore these ambiguous results could not beinvestigated further.· Single Marker anomalies (n=23)The following number of samples would require retesting of single markers:4 marker C (inconsistent allele ratio)1 markers C (inconsistent allele ratio) and O (inconclusive allele ratio)1 markers C and P (inconclusive allele ratios)2 marker F (inconsistent and inconclusive allele ratio)1 marker F (inconsistent allele ratio) and marker P (inconclusive allele ratio)1 marker H (inconclusive allele ratio)1 marker L (inconsistent allele ratio)11 marker P (7 inconclusive allele ratios and 3 inconsistent allele ratios)1 markers P and O (inconclusive allele ratios)· Informativity (n=4)4 samples had no informative markers for Chromosome X (3 were 45, X and one casewas 46, XX). However, additional markers were unavailable for chromosome X at thetime of this evaluation and therefore the absolute concordance of the ChromoQuant<strong>version</strong> 1 result with the karyotype could not be determined. Although 3 cases had thekaryotype 45, X, the number of X markers included in the kit, in our opinion, are notsufficient to be indicative of monosomy X.3.2.3 ChromoQuant Results discordant with karyotypeThe results from ChromoQuant <strong>version</strong> 1 were discordant with the karyotype (or not able to verifykaryotype) for 6 of the 87 samples (6.9%). These discordant results can be divided into those caseswhich would remain discordant if tested using any QF PCR/molecular methodology and those whichare specific to ChromoQuant.3.2.3.1 Discordant results due to limitations of QF PCR technique· 3 samples were reported as very low level mosaics (46,XY/47, XY, +13) (
· 1 sample was reported as having multiple 46, XX metaphases consistent with heavy maternalcell contamination (POC). The foetal karyotype was 47, XY, +13. The ChromoQuant resultwas consistent with a female foetus with a no evidence of trisomy 13. Again the number ofcells exhibiting the foetal karyotype would be too low to be detected using QF PCR or othermolecular techniques.3.2.3.2 Discordant results specific to ChromoQuant· 1 sample had the karyotype 47, XXX. ChromoQuant markers D and K were uninformative andmarker Q had an inconclusive allele ratio and therefore the X chromosome ratio could not beverified. Additional markers for X and Y were unavailable for this evaluation and the karyotypecould not be verified.· 1 sample had the karyotype 47, XYY. The ChromoQuant result showed an inconclusive alleleratio for amelogenin (marker A) and marker K was uninformative. Hence, sex chromosomeratios could not be verified. Additional markers for X and Y were unavailable at the time ofthis evaluation and the karyotype could not be verified.3.3 Prospectively collected amniotic fluid samplesResults for this section are summarized in table 4.3.3.1 ChromoQuant Results concordant with karyotypeResults for the prospectively collected amniotic fluid samples will be presented with the quantitativeanalysis of the sex chromosome markers excluded (see section 3.4). The results from ChromoQuant<strong>version</strong> 1 were concordant with the karyotype for 51 of the 91 samples (56%). 37 of the 51 (72.5 %,40.6% of all samples tested) could be confidently interpreted without any further testing beingrequired. The remaining 14 samples (27.5%) required additional tests to be carried out for thefollowing reasons:· Informativity (n=14)5 had only one informative marker for Chromosome 182 had no informative markers for Chromosome 185 had only one informative marker for Chromosome 211 had no informative markers for Chromosome 211 had only one informative marker for Chromosome 18 and one informative marker forChromosome 21When these samples were tested with the extra sets of markers supplied with ChromoQuant <strong>version</strong> 1(section 3.5) there were at least 2 informative markers present for the chromosome tested. Thereforethe samples were reportable.3.3.2 ChromoQuant Result ambiguous but not necessarily discordant with karyotype36 samples (40%) would have required additional testing to clarify single marker results that eithershowed inconclusive or inconsistent allele ratios. Single marker assays (for markers in tubes 1 and 2)are not available for use with ChromoQuant <strong>version</strong> 1 and therefore these ambiguous results couldnot be investigated further. Two samples required extra tests for single marker anomalies andinformativity· Single Marker anomalies (n= 29)5 marker C (3 inconclusive allele ratios and 2 inconsistent allele ratio)1 markers C (inconsistent allele ratio) and O (inconclusive allele ratio)1 markers C (inconclusive allele ratio) and J (inconsistent allele ratio)3 markers C and P (2 inconclusive and 1 inconsistent allele ratio).1 marker F (inconsistent allele ratio)14 marker P (6 inconclusive allele ratios and 8 inconsistent allele ratios)2 marker O (1 inconclusive allele ratio and 1 inconsistent allele ratio)9
2 markers O (inconclusive allele ratio) and P (inconsistent allele ratio)· Informativity (n=4)1 sample had only one informative marker for Chromosome 21 and no informativemarkers for Chromosome X (2 markers were informative for chromosome 21 after testingwith extra markers)2 samples had no informative markers for chromosome X. Additional markers wereunavailable for chromosome X at the time of this evaluation and therefore the absoluteconcordance of the ChromoQuant result with the karyotype could not be determined. Thishighlights the issue that the number of X markers included in the kit, in our opinion, arenot sufficient to be indicative of monosomy X. The 3 cases which had uninformative Xmarkers (3%) all had the karyotype 46,XX.1 sample had only one informative marker for Chromosome 18 (2 markers wereinformative after testing with extra markers)· Reaction failures (n=5)2 samples required tube 1 to be repeated3 samples required tube 2 to be repeatedWe were unable to obtain results for these samples on two separate occasions.3.3.3 ChromoQuant Results discordant with karyotypeThe results from the ChromoQuant kit were discordant with the reported karyotype (or not able toverify karyotype) for 4 of the 91 samples (4%). These discordant results can be divided into thosecases which would remain discordant if tested using any QF PCR/molecular methodology and thosewhich are specific to ChromoQuant.3.3.3.1 Discordant results due to limitations of QF PCR technique· 1 sample had maternal cell contamination (figure 3) and had been noted as being bloodstained. In the absence of a maternal blood sample it was not possible to verify the foetalkaryotype (46, XX). Although the foetal karyotype could not be verified, one of the benefits ofQF PCR is the ability of the technique to detect MCC and therefore this should not beconsidered as a negative finding.· 1 sample had the karyotype 45,X/ 47,XXX but results from the ChromoQuant kit showednormal allele ratios for informative X markers.· 1 sample had the karyotype 45,X/46,X,r(X) and the results from the ChromoQuant kit showedno informative X markers. Additional markers for X and Y were unavailable at the time of thisevaluation.3.3.3.2 Discordant results specific to ChromoQuant· 1 sample had the karyotype 47,XX,+21. However, the result from the ChromoQuant kit wasambiguous with markers L and N showing allele ratios indicative of trisomy 21, marker Oshowed a normal allele ratio and marker P failed to amplify. On retesting the sample withthree extra Chromosome 21 markers (section 3.5) two were found to have allele ratiosindicative of trisomy 21 but one marker had normal allele ratios. It was not possible to providean unambiguous result for this sample in the absence of single marker assays.10
ResultChromoQuant Result concordant with karyotype:i) no additional tests requiredRetrospectivelycollectedsamples (n=87)54 (62%)43 (80%)Prospectivelycollectedamniotic fluidsamples (n=91)51 (56%)37 (72.5%)ii)extra markers tested for informativity11 (20%)14 (27.5%)ChromoQuant Result ambiguous:i) single marker repeats required:those involving markers C, P or O27 (31%)23 (85%)19 (83%)36 (40%)29 (80.5%)28 (96.5%)ii)informativity (extra X markers)4 (15%)4 (11%)iii)whole tube amplification failures05 (14%)ChromoQuant Result discordant with karyotype:i) Due to limitations of QF PCR technique6 (7%)4 (67%)4 (4.4%)3 (75%)ii)ChromoQuant specific2 (33%)1 (25%)Table 4: Summary of concordance of ChromoQuant result with sample karyotype11
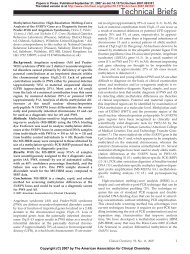
Marker E (Chr 13) Marker I (Chr 13) Marker H (Chr 13)Allele ratio 1.3Allele ratio 1.6Marker J (Chr 18) Marker F (Chr 18)Marker D (Chr X)Allele ratio 1.7 Allele ratio 1.4Figure 3: Genotyper traces showing evidence of a second genotype consistent with maternal cell contamination ofsample CQ67. Highly and slightly skewed allele ratios (examples above) were obtained for all informative markers.Low level (likely to be the maternal contribution) peaks were also observed for some noninformative signals (redstars).12
3.4 Inclusion of sex chromosome markersSome centres consider that it is only appropriate to test for sex chromosome aneuploidy in a subset ofreferrals. Such decisions are usually made at a local level after consultation with clinical colleagues.The ChromoQuant kit could not be used by laboratories where clinicians do not wish to test for sexchromosome imbalances unless agreements were made to specifically exclude sex chromosomemarkers from the data analysis.CMGS best practice guidelines state that:“It is important to be aware that the QFPCR sex chromosome assay (Donaghue et al., 2003)is a highly stringent screen for monosomy X but not a diagnostic test. A result consistent withmonosomy X, where all polymorphic markers have only a single allele peak and no Y sequences arepresent, may represent a normal female homozygous for all markers tested. Therefore it isrecommended that the result is either confirmed using another technique, or that it is reported asbeing consistent with monosomy X with the caveat that there remains a possibility that a normalfemale could give the same genotype.”ChromoQuant <strong>version</strong> 1 only includes the amelogenin marker, a Y specific marker and 3 polymorphicX and Y chromosome markers. In our prospective study of amniotic fluid samples 3% of sampleswere uninformative for the three polymorphic markers (in the absence of the Y chromosomeamelogenin marker and marker R (Yp11.3)) but had normal female karyotypes. In the absence ofadditional X markers for further investigation all such cases would require confirmation by FISH orkaryotype analysis before reporting. In contrast, Donaghue et al., 2003 have described a QF PCR testfor sex chromosome imbalance which can be used independently of an autosomal aneuploidy testand the likelihood of a sample being monosomy X (where all X markers are uninformative and no Ymarkers amplified) has been given a Bayesian probability of 907:1 when using seven X and Ypolymorphic markers. Therefore, we do not consider that there are sufficient numbers of sexchromosome markers in ChromoQuant <strong>version</strong> 1 to thoroughly evaluate sex chromosome imbalance.We also encountered problems with inconclusive and inconsistent allele ratios particularly with markerK. Again in the absence of single marker assays and extra markers it would be difficult to obtainunambiguous results for many samples. Details of marker informativity and numbers of cases wheremarkers gave ambiguous results are shown in table 5.MarkerRetrospectively collectedsamples (n=87)Prospectively collected amnioticfluid samples (n=91)A ( Xp22.122.31)(XY, XXY and XYY)D (Xq26.1)(XX, XXX and XXY)Q (Xq26)(XX, XXX and XXY)K (PAR2 Xq/Yq)40/41 (98%) expected allele ratios1/41 (46,XY) allele ratio 0.5934/48 (71%) expected allele ratios14/48 (29%) were uninformative31/48 (65%) expected allele ratios17/48 (35%) were uninformative73/87 (84%) expected allele ratios14/87 (16%) were uninformative100% expected allele ratios34/48 (71%) expected allele ratios2/48 (4%) inconclusive allele ratio12/48 (25%) were uninformative25/48 (52%) expected allele ratios1/48 (2%) inconclusive allele ratio3/48 (6%) failed to amplify19/48 (40%) were uninformative45/91 (49%) expected allele ratios20/91 (22%) were uninformative14/91 (15%) inconclusive allele ratios8/91 (9%) inconsistent allele ratios4/91 (4%) failed to amplifyTable 5: Summary of details of performance of sex chromosome markers13
3.5 Extra markersThe extra markers supplied with ChromoQuant <strong>version</strong> 1 performed well (table 6). No inconsistent orinconclusive allele ratio results were obtained and the 27 samples that were tested all had at least twoinformative markers for each chromosome when the results were combined with the original test data.Additional markers for Chromosomes X and Y were not supplied with ChromoQuant <strong>version</strong> 1.Marker Location Size Range (bp) LabelChromosome 13D13S252D13S76213q12.113q31q32330 – 360270 – 3206FAMHEXChromosome 18D18S1002D18S976D18S87818q11q1118pter18qter18pter18qter280 – 370171 – 198164 – 1886FAM6FAMHEXChromosome 21D21S1444D21S1435IFNAR21pter21qter21q21.221q22.1232 – 260170 – 210445 – 5006FAMHEXHEX3.6 Marker specific problemsTable 6: Extra marker information for Chromosomes 13, 18 and 21.During this evaluation several markers gave consistently problematic results that preventedunambiguous interpretation of the QF PCR result. The most problematic markers were C, O and Pwhich often showed inconclusive allele ratios. In many cases the allele ratio was so skewed that theresult appeared to be indicative of a tri allelic result (and hence was considered to be an inconsistentallele ratio if other markers for that chromosome showed normal allele ratios). 83% and 96.5% ofsingle marker repeats for the retrospective and prospective samples respectively involved these threemarkers. We assume that this is a technical problem with the kit and is not occurring due to thepresence of polymorphisms at the primer binding sites or sub microscopic duplications since thefrequency of occurrence of these ambiguous results is so high. The sex chromosome marker K(PAR2 Xq/Yq) also showed inconclusive or inconsistent allele ratios in many cases, particularly in theamniotic fluid samples.3.6.1 Marker C (Chr 18 – tube 1)Marker C consistently produced inconsistent and inconclusive allele ratios (7% of retrospectivelycollected samples and 14% of prospectively collected samples). The presence of a nonspecific bluefluorescent signal at 176bp (amniotic fluid samples only) also made analysis problematic as the peakfalls within the range of analysis. Representative Genotyper traces showing examples of the nonspecific signal, inconclusive, inconsistent, informative and uninformative allele ratios are shown infigure 4. The marker was also only informative in 64% of cases.3.6.2 Marker O (Chr 21 – tube 2)Marker O gave a high number of inconsistent and inconclusive allele ratios (4% of retrospectivelycollected samples and 11% of prospectively collected samples). The marker also failed to amplify in6% of retrospectively collected samples and 13% of prospectively collected samples. The marker sizerange is 435475bp and with poor quality DNA the product often failed to amplify. The marker wasalso only informative in 60% of cases.14
a) CQ53 (46,XY): Inconclusive allele ratioArea 0.75, Height 0.69b) CQ93 (46,XY): inconsistent allele ratioArea 0.55, Height 0.56c) CQ94 (46,XX): Uninformatived) CQ96 (46,XY): InformativeArea 1.1, Height 1.0Figure 4: Marker C. Genotyper traces showing examples of a) inconclusive allele ratio, b) inconsistent allele ratio, c)uninformative sample and d) an informative samples with normal allele ratio. The arrow indicated the nonspecificpeak at 176bp which can interfere with analysis.15
3.6.3 Marker P (Chr 21 tube 2)Marker P produced the highest number of inconclusive and inconsistent allele ratio results (19% ofretrospectively collected samples and 42% of prospectively collected samples). The marker alsofailed to amplify in 8% of retrospectively collected samples and 25% of prospectively collectedsamples. As for marker O, the size range is 445500bp which is the largest molecular weight ampliconin tube 2 and the failure rate increased with the poorer quality DNA from the amniotic fluid samples.Figure 5 shows representative Genotyper traces for samples with inconclusive, inconsistent,informative and uninformative allele ratios.a) CQ49 (46,XY): InformativeArea 1.12, Height 1.08b) CQ74 (46,XX): Uninformativec) CQ73 (46,XY): Inconclusive allele ratioArea 1.52, Height 1.5d) CQ72 (46,XY): inconsistent allele ratioArea 2.9, Height 3.0Figure 5: Marker P. Genotyper traces showing examples of a) an informative sample with normal allele ratio b)uninformative sample, c) inconclusive allele ratio and d) inconsistent allele ratio.16
3.6.4 Marker K (Xq/Yq – tube 2)Marker K showed amplification anomalies when using DNA from the amniotic fluid samples.Inconclusive allele ratios were observed in 14 cases. Seven of these cases were male and showednormal amelogenin marker allele ratios. Four of the female samples showed normal allele ratios forone other X marker. One sample was a Turner mosaic and the remaining 2 samples did not haveanother informative sex chromosome marker. Inconsistent allele ratios for marker K were observed in8 cases of which 6 were male and 2 were female. The male samples had normal amelogenin markerallele ratios, one female sample had normal allele ratios for 2 informative X chromosome markers andthe remaining female sample was uninformative for other sex chromosome markers (figure 6).a) CQ 90 (46, XX)Marker K (PAR2 Xq/Yq): inconsistent allele ratio (Height 1.82, Area 1.80) BUTMarker D (Chr X) normal allele ratio (Height 1.1, Area 1.1)Marker Q (Chr X) normal allele ratio (Height 1.02, Area 1.04 )b) CQ31 (46, XY)Marker K (PAR2 Xq/Yq): inconclusive allele ratio (Height 1.72 , Area 1.69) BUTMarker A (Amelogenin) normal allele ratio (Height 1.08, Area 1.11)Figure 6: Marker K. Examples of samples with a) normal female and b) normal male karyotype where marker K hadinconsistent or skewed allele ratios but other sex chromosome markers showed normal allele ratios.17
3.6.5 Marker Q (Chr X – tube 2)There was a nonspecific signal at 99.6bp for marker Q which made interpretation problematic as thepeak falls within the range of analysis. Representative Genotyper traces showing examples of the nonspecific signal for samples which were informative and uninformative are shown in figure 7. This peakonly appeared in DNA samples prepared using the InstaGene matrix.a) CQ 92 (46, XY) b) CQ 95 (46, XX)Figure 7: Marker Q. Example of Genotyper traces showing the presence of the nonspecific signal at 99.6bp (redstar) in a) normal male and b) normal female samples.3.7 Unequal amplification of markersIn general, when running multiplex PCR, the lower molecular weight amplicons amplify moreefficiently than higher molecular weight products. By altering primer concentrations for the variousamplicons it is usually possible to ensure that amplicons of different sizes can be amplified with equalefficiency in the multiplex. During our evaluation we found that the ChromoQuant markers in tube 1and 2 amplified with different efficiencies. For tube 1 (chromosomes 13 and 18) the retrospectivelycollected high quality DNA samples (from cultured cells and tissue samples) produced reliableamplification of all markers but in general marker G amplified more efficiently and markers C, F, I andJ were less efficiently amplified (figure 8a). When lower quality DNA samples from amniotic fluid wereanalysed the higher molecular weight products (markers F, G, H, I and J) did not amplify veryefficiently in relation to the smaller sized products (figure 8b). For markers G and H this did not affectthe analysis because the amplicons were still strong enough to be analysed. However for markers C,F, I and J the amplicons often failed to amplify or were too weak to be reliably analysed (table 3).Unequal amplification of markers was also found in tube 2 (chromosome 21). Using the high qualityDNA from the retrospectively collected DNA samples the markers generally amplified to a level thatenabled analysis. However, in general, the higher molecular weight products from markers O and P(>430bp) were much less efficiently amplified than other markers in the multiplex (figure 8a). Thesemarkers were much more prone to fail to amplify in both the retrospective and prospective samples(table 3). When the DNA samples from the amniotic fluids were analysed the failure rate for thesemarkers increased presumably due to poor DNA quality (figure 8b, table 3). This effect was far greaterfor markers O and P in tube 2.The markers that were amplifying with lower efficiency were also those that often producedinconsistent and inconclusive allele ratios (table 2). It is possible that primer concentration is playing arole in the skewing of the amplification of the alleles for these markers. Unfortunately we were unableto investigate this further since primers for individual markers are not available for this kit.Figure 8: (over page) Examples of Genotyper traces from a) high quality and b) low quality DNA. The markersmarked with red stars in tubes 1: C (Blue), J (Blue), F (Green), and I (Green) and tube 2: O (Blue) and P (Green)amplified with lower efficiency than other markers in the multiplex for high and low quality DNA samples. Howeverwith low quality DNA this often resulted in these markers failing to amplify or being too weak to analyse. Thesemarkers also tended to produce inconclusive or inconsistent allele ratios.18
) Low Quality DNAi) Tube 1ii) Tube 220
3.8 Effects of DNA extraction methodThere was an obvious difference in the quality of the results obtained from the retrospectivelycollected samples and the amniotic fluid samples. We investigated whether the InstaGene method ofDNA extraction was affecting amplification efficiency and the generation of nonspecific signals whenusing ChromoQuant <strong>version</strong> 1. We extracted DNA from 6 amniotic fluid samples using the InstaGenematrix and the BioRobot EZ1 Workstation (QIAGEN). The duplicated samples were analysed using acontrol gene PCR primer set which assesses the integrity and amplifiability of DNA (van Dongen etal., 2003). The control gene PCR set allows amplification of products of 100, 200, 300, 400 and 600bpwith equal intensity in high quality DNA samples. The results are shown in figure 9.600bp400bp300bp200bp100bpIMEZ1IMEZ1IMEZ1IMEZ1IMEZ1IMEZ1CQ229CQ230CQ231CQ232CQ233CQ234Figure 9: Agarose gel showing results of control gene PCR. DNA extracted from 6 amniotic fluid samples (CQ229 –CQ234) using InstaGene matrix (IM) or the BioRobot EZ1 Workstation (EZ1) were amplified using the control genePCR. IM samples amplified to 300bp whereas EZ1 samples amplified to 600bp.The DNA extracted using the BioRobot EZ1 Workstation (QIAGEN) amplified to 600bp but the DNAextracted using the InstaGene matrix only amplified products up to 300bp. Therefore it appears thatthe EZ1 DNA extracted from the amniotic fluid samples may inhibit PCR less than that extractedusing the InstaGene matrix.Although the EZ1 DNA amplified more efficiently in the control gene PCR, there did not appear to beany difference in the amplification efficiency between the two sample preparations when usingChromoQuant <strong>version</strong> 1. However, the nonspecific signals for markers C (Chr 18 tube 1) and Q(Chr X – tube 2) were not found when using the EZ1 DNA samples. In general, less background andfewer nonspecific peaks were detected when using the EZ1 DNA (figure 10).a) EZ1b) InstageneFigure 10: Genotyper traces from sample CQ230 analysed using a) EZ1 DNA or b) Instagene matrix DNA. Redstars indicate the nonspecific peaks that are present using the IM DNA but are absent from the EZ1 samples.21
3.9 General Comments on ChromoQuant protocolAn 8 page protocol is supplied with ChromoQuant <strong>version</strong> 1. In general this was easy to follow butthere were some ambiguous instructions which we felt could be clarified. The amplification protocol isover complex with no PCR master mix being prepared in advance. This requires that 2μl of dilutedTaq polymerase is added to each tube which could lead to pipetting error, possible contamination andvariation in the overall composition of individual PCR reactions. The interpretation section of theprotocol is very limited and no advice is given about what additional followup studies should beundertaken when an ambiguous result is obtained. No clear advice is available for interpretation ofsex chromosome aneuploidy which is more difficult to interpret as the markers are distributedbetween the two tubes. There is also no troubleshooting section or recommended electrophoresisconditions.4. CONCLUSIONSChromoQuant is technically easy to use, CE marked and therefore IVD compliant. However,<strong>version</strong> 1 does not currently fulfil the typical requirements of a rapid prenatal test; it is unable to copewith variable sample quality, it often produces ambiguous results which cannot be resolved due to thelack of single marker assays and the kit has a high failure rate for some markers. Only 59% ofsamples could have been reported using the kit in its current format.4.1 Marker and Primer InformationAt present, no information is made available about the markers other than their G band location.Primer sequences are also not available. This can make interpretation of ambiguous results difficultsince supporting published evidence for causes of ambiguous results (e.g. submicroscopicduplications) cannot be used unless the molecular locations of the markers are known. The lack ofprimer sequences means that information about common polymorphisms which may lie under primerbinding sites cannot be assessed. There is also a possibility that lack of marker information maycause problems for reporting since labs would be unable to report the exact regions that have beenanalysed. This could be particularly important for an inconsistent marker result. Marker (but notprimer) information is available for ChromoQuant <strong>version</strong> 2 which was released in August 2005.4.2 InformativityMarkers C (chromosome 18) and O (chromosome 21) had low heterozygosity (60 and 56%respectively). 13.5 % of samples required testing with additional markers for 18 and 21 so that therewere at least two informative markers present for these chromosomes. These markers havesubsequently been replaced in ChromoQuant <strong>version</strong> 2.4.3 Single Marker AssaysIndividual primer pairs for the markers used in tubes 1 and 2 are currently not available. CMGS bestpractice guidelines recommend that single marker assays should be performed for markers exhibitinginconclusive allele ratios. Where the skewed ratios are caused by primer site polymorphisms theinconclusive result can usually be resolved by retesting the single marker with a lower annealingtemperature in the PCR. In our study severely skewed allele ratios for some markers often resulted inresults consistent with the presence of three alleles. It is possible that these too could be resolvedusing single marker assays. In theory it would be possible to repeat the entire multiplex at a lowertemperature but this would almost certainly be prohibitively expensive with 30% of samples in ourstudy requiring such analysis. Single marker assays will not be available for ChromoQuant <strong>version</strong> 2.4.4 Sex Chromosome MarkersThe inclusion of sex chromosome markers in the kit may be problematic for some labs for the reasonsdiscussed in section 3.4. Although ChromoQuant did accurately detect two cases of sex chromosomeaneuploidy in the retrospectively collected samples an unambiguous result was not possible for 4other cases of sex chromosome aneuploidy; 47, XXX47, XYY45,X / 47, XXX45,X / 46,Xr(X).Three cases that had a karyotype 45, X were shown to be indicative of monosomy X but 4 cases withnormal female karyotypes were also shown to be indicative of monosomy X. In our opinion there are22
insufficient polymorphic sex chromosome markers included in the kit for it to be used as a robustdiagnostic screen for monosomy X. We feel that the sex chromosome markers should be madeavailable as a separate PCR and that additional autosomal markers could then be added to tubes 1and 2 and additional sex chromosome markers could be added to the new reaction. The lack of extraX and Y chromosome markers meant that ambiguous results could not be resolved. Although extra Xand Y markers are available in ChromoQuant <strong>version</strong> 2 there are still sex chromosome markersdistributed between tubes 1 and 2.4.5 Unbalanced AmplificationThe amplification efficiency of markers varied and although for higher quality of DNA this did notrepresent any problem, for the lower quality DNA samples markers C, F, I, J, O, and P often failed toamplify or amplified with skewed allele ratios. This was particularly a problem for markers C, P and Owith 90.4% of skewed allele ratio results and 27% of all marker failures involving these three markers.If the multiplex conditions had been optimized to allow markers to be amplified with the sameefficiency these problems may not have been encountered. Markers C, O and P have been replacedin ChromoQuant <strong>version</strong> 2.4.6 DNA ExtractionThe method of DNA extraction appeared to have an effect on the quality of the results obtained.When using DNA extracted from amniotic fluid samples we found that, in general, less backgroundand fewer nonspecific peaks were detected when using the EZ1 DNA.4.7 ChromoQuant Version 2ChromoQuant <strong>version</strong> 2 was released in August 2005 and has a number of improvements includingthe replacement of markers C, P and O. A preliminary report is attached.23
5. REFERENCESCirigliano V, Ejarque M, Canadas M P, Lloveras E, Plaja A, Perez M M, Fuster C, Egozcue J (2001)Clinical application of multiplex quantitative fluorescent polymerase chain reaction (QFPCR) for therapid prenatal detection of common chromosome aneuploidies. Mol Hum Reprod 7(10): 10016.Clinical Molecular Genetics Society (UK) best practice guidelines for QF PCR for the diagnosis ofaneuploidy. (http://www.cmgs.org/BPG/Guidelines/2004/QFPCR.htm)Donaghue C, Roberts A, Mann K, Mackie Ogilvie C (2003) Development and targeted application ofrapid QF PCR test for sex chromosome imbalance. Prenat Diagn 23: 201210.Donaghue C, Mann K, Docherty Z, Mackie Ogilvie C (2005) Detection of mosaicism for primarytrisomies in prenatal samples by QF PCR and karyotype analysis. Prenat Diagn 25: 6572Levett L J, Liddle, S Meredith R (2001) A largescale evaluation of amnioPCR for the rapid prenataldiagnosis of fetal trisomy. Ultrasound Obstet Gynecol 17(2): 1158.Mann K, Donaghue C, Fox SP, Mackie Ogilvie C (2004) Strategies for the rapid prenatal diagnosis ofchromosomal aneuploidy. Eur J Hum Genet 12(11): 90715Mann K, Fox S P, Abbs S J, Yau S C, Scriven P N, Docherty Z, Ogilvie C M (2001) Development andimplementation of a new rapid aneuploidy diagnostic service within the UK National Health Serviceand implications for the future of prenatal diagnosis. Lancet 358(9287): 105761.Pertl B, Kopp S, Kroisel P M, Tului L, Brambati B, Adinolfi M (1999) Rapid detection of chromosomeaneuploidies by quantitative fluorescence PCR: first application on 247 chorionic villus samples. JMed Genet 36(4): 3003.Schmidt W, Jenderny J, Hecher K, Hackeloer B J, Kerber S, Kochhan L, Held K R (2000) Detection ofaneuploidy in chromosomes X, Y, 13, 18 and 21 by QFPCR in 662 selected pregnancies at risk. MolHum Reprod 6(9): 85560.van Dongen JJM, Langerak AW, Bruggemann M, Evans PA, Hummel M, Lavender FL, Delabesse E,Davi F, Schuuring E, GarciaSanz R, van Krieken JHJM, Droese J, Gonzalez D, Bastard C, White HE,Spaargaren M, Gonzalez M, Parreira A, Smith JL, Morgan GJ, Kneba M, Macintyre EA (2003) Designand standardization of PCR primers and protocols for detection of clonal immunoglobulin and Tcellreceptor gene recombinations in suspect lymphoproliferations: report of the BIOMED2 ConcertedAction BMH4CT983936. Leukemia 17(12): 22572317 [Section 10].Verma L, Macdonald F, Leedham P, Mcconachie M, Dhanjal S, Hulten M (1998). Rapid and simpleprenatal DNA diagnosis of Down's syndrome. Lancet 352(9121): 912.24
6. APPENDIX 1EXAMPLES OF GENOTYPER TRACES FROM CHROMOQUANT VERSION 126
National Genetics Reference Laboratory (<strong>Wessex</strong>)Salisbury District HospitalSalisbury SP2 8BJ, UKwww.ngrl.org.uk