Issues with Efficacy Analysis of Clinical Trial Data ... - PharmaSUG
Issues with Efficacy Analysis of Clinical Trial Data ... - PharmaSUG
Issues with Efficacy Analysis of Clinical Trial Data ... - PharmaSUG

You also want an ePaper? Increase the reach of your titles
YUMPU automatically turns print PDFs into web optimized ePapers that Google loves.
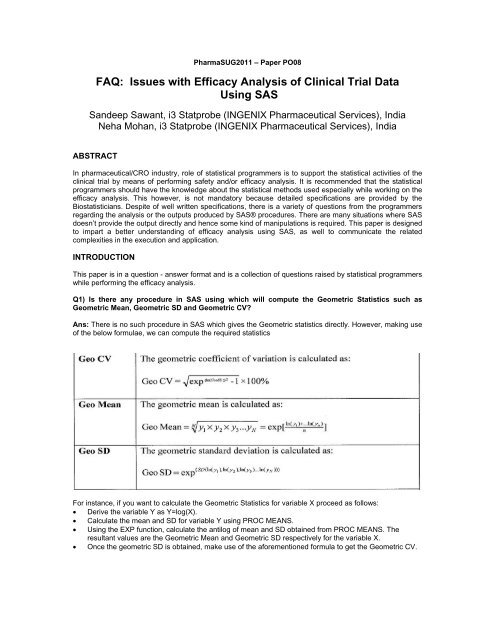
<strong>PharmaSUG</strong>2011 – Paper PO08FAQ: <strong>Issues</strong> <strong>with</strong> <strong>Efficacy</strong> <strong>Analysis</strong> <strong>of</strong> <strong>Clinical</strong> <strong>Trial</strong> <strong>Data</strong>Using SASSandeep Sawant, i3 Statprobe (INGENIX Pharmaceutical Services), IndiaNeha Mohan, i3 Statprobe (INGENIX Pharmaceutical Services), IndiaABSTRACTIn pharmaceutical/CRO industry, role <strong>of</strong> statistical programmers is to support the statistical activities <strong>of</strong> theclinical trial by means <strong>of</strong> performing safety and/or efficacy analysis. It is recommended that the statisticalprogrammers should have the knowledge about the statistical methods used especially while working on theefficacy analysis. This however, is not mandatory because detailed specifications are provided by theBiostatisticians. Despite <strong>of</strong> well written specifications, there is a variety <strong>of</strong> questions from the programmersregarding the analysis or the outputs produced by SAS® procedures. There are many situations where SASdoesn’t provide the output directly and hence some kind <strong>of</strong> manipulations is required. This paper is designedto impart a better understanding <strong>of</strong> efficacy analysis using SAS, as well to communicate the relatedcomplexities in the execution and application.INTRODUCTIONThis paper is in a question - answer format and is a collection <strong>of</strong> questions raised by statistical programmerswhile performing the efficacy analysis.Q1) Is there any procedure in SAS using which will compute the Geometric Statistics such asGeometric Mean, Geometric SD and Geometric CV?Ans: There is no such procedure in SAS which gives the Geometric statistics directly. However, making use<strong>of</strong> the below formulae, we can compute the required statisticsFor instance, if you want to calculate the Geometric Statistics for variable X proceed as follows:• Derive the variable Y as Y=log(X).• Calculate the mean and SD for variable Y using PROC MEANS.• Using the EXP function, calculate the antilog <strong>of</strong> mean and SD obtained from PROC MEANS. Theresultant values are the Geometric Mean and Geometric SD respectively for the variable X.• Once the geometric SD is obtained, make use <strong>of</strong> the aforementioned formula to get the Geometric CV.
Q2) I am calculating 95% CI for the mean using PROC MEANS. In my dataset, all the values areidentical. The output from PROC MEANS has missing values for both upper and lower limits. In thisscenario, what values should be presented for the upper and lower limits in the output?Ans: When the dataset contains all identical values, this value becomes the point estimate for mean. Hereboth the upper as well as the lower limit for CI <strong>of</strong> the mean is the same as that identical value. This fact hasnot been taken into consideration while computing CI in PROC MEANS. Hence, it is recommended to usePROC UNIVARIATE <strong>with</strong> CIBASIC options whenever 95% CI for means is required. PROC UNIVARIATEtakes into account this special data case while calculating the same.Q3) How do I check if my data follows normal distribution?Ans: Use PROC UNIVARIATE <strong>with</strong> NORMAL option.SAS produces p-value for four normality tests viz Shapiro-Wilk, Kolmogorov-Smirnov, Cramer-Von Misesand Anderson-Darling. Consult <strong>with</strong> the statistician for any preference for a particular test. If there is nopreference, all the four tests should be used for conclusion. If the p-values from all the four tests are greaterthan 0.05 (or desired level <strong>of</strong> significance), you can conclude that the data follows normal distribution. If atleast one p-value is less than 0.05 (or desired level <strong>of</strong> significance) , it would indicate that your data doesn’tfollow normal distribution.Q4) While computing the Pearson’s correlation coefficient I get a missing value. What may be thereason and what value should be presented on the table?Ans: This happens when one <strong>of</strong> the variables contains identical values (which mean zero variance).Correlation is defined as covariance divided by product <strong>of</strong> SD <strong>of</strong> the two variables for which correlation isneeded. Hence, no variance (SD=0) for one <strong>of</strong> the variable results in missing correlation. In this situation,display the correlation as NC (Not Computable).Q5) I want to calculate the CI for proportion <strong>of</strong> subject achieving Complete Response (CR) fortreatment arm A. However in my dataset, out <strong>of</strong> 10 subjects receiving treatment A, no subject hasachieved CR. I am using PROC FREQ <strong>with</strong> BINOMIAL option. I get the CI for proportion <strong>of</strong> subjectsnot achieving CR but I need the CI for proportion <strong>of</strong> subjects achieving CR. How should I calculateit?Ans: You can make use <strong>of</strong> ZEROS option in PROC FREQ.Create a dataset for counts and add a dummy record in your dataset to indicate that no subjects haveachieved CR as followsTreatment Response CountA CR 0A No-CR 10Use PROC FREQ <strong>with</strong> WEIGHT statement and ZEROS option (i.e. WEIGHT count/ ZEROS). This willprovide the CI for the subjects achieving CR despite <strong>of</strong> data containing No-CR.Q6) My dataset contains both the responses Yes/No. I want the CI for binomial proportion, forresponders i.e. for Yes. However, PROC FREQ is providing the CI for NO.Ans: PROC FREQ computes the CI for the lower level <strong>of</strong> the variable (when sorted alphabetically). In thegiven scenario, CI will get computed for the lowest level i.e. No. If you need the CI for the level ‘Yes’ thenplease correct the BINOMIAL option to BINOMIAL(LEVEL=2). This will compute the CI for the second level<strong>of</strong> the variable holding Yes/No values, i.e. CI for responders (Yes).Q7) When should I use Chi-Square and when to use Fisher’s test?Ans: Both these tests are used for analysis <strong>of</strong> 2X2 (or more) contingency tables. Fishers test is mostappropriate, if the expected frequency <strong>of</strong> any <strong>of</strong> the cell group is less than 5. In order to get the expectedfrequency use OUTEXP option in TABLE statement. If all the expected frequencies are more than 5 useChi-square test.
Q8) I am using Mc-Nemar test. However, corresponding p-value is not getting calculated and there isa note in the log indicating that one <strong>of</strong> the variable has less than 2 non-missing levels. What shouldI do?Ans: Mc-Nemar’s test is used for analysis <strong>of</strong> aXb tables where both a and b are greater than 1 i.e. tableshould be at least 2X2. If some <strong>of</strong> the cell frequencies are missing, add dummy records <strong>with</strong> zero counts asfollows to complete the 2 X 2 table.Treatment Response CountA CR 0A No-CR 10B CR 0B No-CR 10Use PROC FREQ <strong>with</strong> WEIGHT statement and ZEROS option (i.e. WEIGHT count/ ZEROS). This willcreate 2X2 tables and the p-value will get calculated.Q9) I am using CMH test and have been asked to use alternative hypothesis as “Row Mean ScoresDiffer”. However, I get a different p-value than the validation programmer. We both are using thesame data for PROC FREQ?Ans: The reason for the difference in the p-values could be due to the differences in the order in which thevariables are listed in the table statement.When you use CMH <strong>with</strong> “Row Mean Scores Differ” as alternative hypothesis, make sure that the desiredvariable appears in rows in the 2X2 table. Suppose we want to find out the association between treatmentand response across the country. Make sure that the treatment variable appears in rows and response incolumn for the country. This can be obtained as Tables Country*Treatment*Response/CMH in PROCFREQ.Q10) We are checking association between occurrence <strong>of</strong> AE and Treatment using Chi-Square test.10 Subjects have received Treatment A and 10 subjects have received Treatment B. In AE dataset, 9subjects from treatment arm A have reported AE and 8 subjects from treatment B have reported AE.I am creating the binary variable in AE dataset to indicate occurrence <strong>of</strong> AE. However, I get differentp-value than validation programmer.Ans: Make sure that missing responses are set as non-responders i.e. 1 subject from treatment A who hasnot experience an AE should be treated as non-responder and 2 subject from treatment B who has notexperience an AE should be treated as non-responder. Basically, all the treated subjects should have thebinary flag instead <strong>of</strong> creating the binary flags in AE. This data then passed to PROC FREQ will give the p-value.Q11) What are Semi-Log plots?Ans: In semi-log plot, the data is plotted on logarithmic scale. However, the data is not log-transformed. Theaxis can be converted to logarithmic scale by using LOGBASE=10 option in AXIS statement.Q12) What are Sphegetti plots?Ans: Sphegetti plots are 3D plots <strong>with</strong> data for different individuals (subjects/patients) plotted on the samepage. For e.g. Plasma concentration plotted on y-axis, time-points on x-axis for 10 subjects will constitute asphegetti plot. This can be plotted using the statement PLOT plasma*time=subjid in the PROC GPLOT.Q13) Is there a difference between Box plot and Box-Whisker Plot?Ans: In box plot, the upper and lower end <strong>of</strong> the box is extended to the minimum and maximum values <strong>of</strong>the data. On the other hand in a box-whisker plot, the upper and lower ends are extended till 1.5 interquartilesrange and the values beyond those points are denoted by a specified symbol. Box plots can beplotted using I=BOX00 option and Box-whisker plot can be plotted using I=BOX option in the SYMBOLstatement.
Q14) I have been asked to use PROC TTEST for comparing means <strong>of</strong> two treatment groups. Theresultant TTEST generates two p-values - one <strong>with</strong> equal variance and the other <strong>with</strong> unequalvariance. Which p-value should be used?Ans: You need to first check if the variances <strong>of</strong> the two groups are the same. This can be checked using thep-value from “Equality <strong>of</strong> Variance” section. If p
Q21) To generate KM plot using PROC GPLOT, I am using the survival probabilities from OUTSURVdataset generated through PROC LIFETEST. I expect the plot to match the one generated throughplot=(S) option in PROC LIFETEST. However this is not the case. What could be the reason?Ans: If you look at the OUTSURV dataset, you will notice that some <strong>of</strong> the time values have missingprobabilities. If you use this data directly for plotting KM plot, time points <strong>with</strong> missing probabilities will bedropped; hence the difference. To avoid this, sort the data by time variable <strong>with</strong>in the strata and retain theprevious non-missing probability values in place <strong>of</strong> missing ones. Use these derived probabilities to produceKM plot.CONCLUSIONI have tried covering some <strong>of</strong> the questions asked by statistical programmers which they have faced whileperforming the statistical analysis because <strong>of</strong> various data cases or the way SAS produces the output.Though the question list is not exhaustive, this paper should serve as a basis for understanding the topic <strong>of</strong>efficacy analysis and the related complexities.ACKNOWLEDGMENTSI thank all my colleagues for guiding this work and carefully reviewing the paper <strong>with</strong> comments andsuggestions.CONTACT INFORMATIONYour comments and questions are valued and encouraged. Contact the author at:Sandeep Sawanti3 Statprobe, , a division <strong>of</strong> Ingenix Pharmaceutical Services, Inc.7 th Floor, Corporate Center,Opp. To VITS Hotel,Andheri-Kurla Road,Andheri (E)- 400059Mumbai, IndiaWork Phone: +91-22-30554032E- mail: sandeep.sawant@i3global.comSAS and all other SAS Institute Inc. product or service names are registered trademarks or trademarks <strong>of</strong>SAS Institute Inc. in the USA and other countries. ® indicates USA registration.