Network analysis to analyse complex agroecosystems
Network analysis to analyse complex agroecosystems
Network analysis to analyse complex agroecosystems

You also want an ePaper? Increase the reach of your titles
YUMPU automatically turns print PDFs into web optimized ePapers that Google loves.
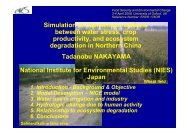
<strong>Network</strong> <strong>analysis</strong> <strong>to</strong> <strong>analyse</strong><br />
<strong>complex</strong> agroecosystems<br />
Mariana Rufino, Pytrik Reidsma, Santiago LópezRidaura, Pablo Tit<strong>to</strong>nell, Ken Giller<br />
Plant Production System Group
The context<br />
� Ruralpoor farm households<br />
� Food security (primary goal)<br />
� Risk (income and/or consumption)<br />
� (Scarce) resources
Population (People per Km 2 )<br />
0 2<br />
3 10<br />
11 20<br />
21 50<br />
51 100<br />
101 200<br />
201 500<br />
501 1000<br />
>1000<br />
Tigray <br />
Ethiopia<br />
Kakamega <br />
Kenya<br />
Murewa <br />
Zimbabwe<br />
Source FAO
The Highlands of Tigray Northern<br />
Ethiopia
Communal farming Murewa NE Zimbabwe
The Highlands of Western Kenya
The objectives<br />
� To test:<br />
� Whether ecological network <strong>analysis</strong> was applicable <strong>to</strong> agro<br />
ecosystems<br />
� Whether their application provide insights in<strong>to</strong> current<br />
performance and development across environments<br />
� To reflect<br />
� Whether the results of the applications were informative<br />
enough <strong>to</strong> contribute <strong>to</strong> discussion on sustainable<br />
livelihoods
The system definition – the network<br />
� The unit of <strong>analysis</strong> > the farm household<br />
� <strong>Network</strong> compartments > the farming activities<br />
� Difference with ecosystems > human agency<br />
� Resource flows > purposively managed<br />
� Currency > Nitrogen<br />
� Timescale > year
Using existing information<br />
� Farm typology + household data<br />
� Resource flow mapping<br />
� Observations and farmers interviews<br />
� Field measurements<br />
� Existing information from:<br />
� Tigray – Northern Ethiopia (n=50)<br />
� Kakamega – Western Kenya (n=15)<br />
� Murewa – NE Zimbabwe (n=50)
Conceptualising the network<br />
For each<br />
farm<br />
type<br />
Pasture<br />
Maize<br />
Fodder crops<br />
Fertiliser + seeds<br />
Manure<br />
s<strong>to</strong>rage<br />
Maize<br />
Compost<br />
Feed<br />
Waste<br />
Excreta<br />
Maize<br />
Household<br />
Grain<br />
Food<br />
Vegetables<br />
Animal products<br />
Chicken<br />
Feed<br />
Cattle<br />
Ground<br />
nuts<br />
Food crops<br />
Excreta<br />
Products<br />
Goats<br />
Food<br />
Lives<strong>to</strong>ck<br />
Excreta<br />
Feed
The network <strong>analysis</strong><br />
� Ecological network <strong>analysis</strong><br />
� Leontief (1951) inputoutput <strong>analysis</strong> in economics<br />
� Hannon (1973) application in Ecology<br />
� J.T. Finn (1976, 1980)<br />
� R.E. Ulanowicz (1980, 1986, 1997,…)<br />
� B.C. Patten, B.D. Fath, S.E. Jørgensen and others
The indices of the network <strong>analysis</strong><br />
� System size (activity)<br />
� System structure and organisation<br />
� Efficiency measures<br />
� A measure of growth and development<br />
� Ascendency
Agroecosystems as networks<br />
Roles (#)<br />
12<br />
10<br />
8<br />
6<br />
4<br />
2<br />
0<br />
0 2 4 6 8 10 12 14<br />
Connectivity (flows node 1 )<br />
A window of vitality<br />
Random networks<br />
Natural ecosystems<br />
Agroecosystems<br />
Effective # of nodes<br />
14<br />
12<br />
10<br />
8<br />
6<br />
4<br />
2<br />
0<br />
Natural ecosystems<br />
Agroecosystems<br />
0 5 10 15 20 25 30 35 40 45<br />
Effective # of flows<br />
After Zorach and Ulanowicz (2003) Complexity 8, 6876
Size and organisation<br />
Measure of growth & development (A)<br />
2000<br />
1500<br />
1000<br />
500<br />
0<br />
Kakamega<br />
Murewa<br />
Tigray<br />
0 500 1000 1500<br />
2000<br />
1500<br />
1000<br />
500<br />
0<br />
0.5 1 1.5 2<br />
Measure of size (T) Measure of organisation (AMI)<br />
Ascendency = T x AMI
Size and organisation<br />
Measure of growth & development (A)<br />
2000<br />
1500<br />
1000<br />
500<br />
0<br />
Kakamega<br />
Murewa<br />
Tigray<br />
lives<strong>to</strong>ck<br />
0 500 1000 1500<br />
2000<br />
1500<br />
1000<br />
500<br />
0<br />
0.5 1 1.5 2<br />
Measure of size (T) Measure of organisation (AMI)<br />
Ascendency = T x AMI
Capacity<br />
Inputs (Φ I )<br />
Exports (ΦE)<br />
Dissipations (Φs)<br />
Pathway redundancy (Φo)<br />
Ascendency (A)<br />
5000<br />
4000<br />
3000<br />
2000<br />
1000<br />
0<br />
farm types ><br />
P M W P M M W P M W<br />
Tigray<br />
Ethiopia<br />
Ascendency = size x organisation<br />
Overhead<br />
Murewa<br />
Zimbabwe<br />
Currency: kg N fhh 1 y 1 bits<br />
Kakamega<br />
Kenya
Relationship <strong>to</strong> food selfsufficiency<br />
Food selfsufficiency<br />
4.0<br />
3.0<br />
2.0<br />
1.0<br />
0.0<br />
other<br />
Ethiopia<br />
0 500 1000 1500 2000<br />
4.0<br />
3.0<br />
2.0<br />
1.0<br />
0.0<br />
0 10 20 30 40 50 60 70<br />
Ascendency <strong>Network</strong> organisation<br />
Food selfsufficiency = Food produced/food needed
Relationship with productivity<br />
Biomass (t ha 1 )<br />
12.0<br />
8.0<br />
4.0<br />
0.0<br />
0 400 800 1200 1600<br />
Biomass (t ha 1 )<br />
12.0<br />
Ascendency (kg N fhh 1 y 1 bits) <strong>Network</strong> organisation<br />
8.0<br />
4.0<br />
0.0<br />
0 10 20 30 40 50 60 70
Relationship with productivity<br />
Biomass (t ha 1 )<br />
12.0<br />
8.0<br />
4.0<br />
0.0<br />
0 400 800 1200 1600<br />
Biomass (t ha 1 )<br />
12.0<br />
8.0<br />
4.0<br />
others<br />
KakamegaKenya<br />
0.0<br />
0 10 20 30 40 50 60 70<br />
Ascendency (kg N fhh 1 y 1 bits) <strong>Network</strong> organisation
N cycling (% of <strong>to</strong>tal)<br />
Elements of stability and resilience<br />
12.0<br />
9.0<br />
6.0<br />
3.0<br />
0.0<br />
Nutrient cycling Dependency<br />
0 300 600 900 1200 1500<br />
1.0<br />
0.8<br />
Fraction of N<br />
imported<br />
0.5<br />
0.3<br />
0.0<br />
Ascendency (size x organisation)<br />
0 300 600 900 1200 1500
Elements of stability and resilience<br />
N cycling (% of <strong>to</strong>tal)<br />
12.0<br />
8.0<br />
4.0<br />
0.0<br />
Nutrient cycling Dependency<br />
0 10 20 30 40 50 60 70<br />
Fraction of N<br />
imported<br />
1.0<br />
0.8<br />
0.6<br />
0.4<br />
0.2<br />
0.0<br />
<strong>Network</strong> organisation<br />
0 10 20 30 40 50 60 70
Ascendency / overhead<br />
5000<br />
4000<br />
3000<br />
2000<br />
1000<br />
0<br />
farm types ><br />
P M W P M M W P M W<br />
5000<br />
Current systems 4000<br />
Without lives<strong>to</strong>ck<br />
3000<br />
2000<br />
1000<br />
0<br />
P M W P M M W P M W<br />
Tigray Murewa Kakamega Tigray Murewa Kakamega
Ascendency / overhead<br />
5000<br />
4000<br />
3000<br />
2000<br />
1000<br />
0<br />
30%<br />
10%<br />
5000<br />
Current systems 4000<br />
Without lives<strong>to</strong>ck<br />
44%<br />
3000<br />
2000<br />
~10%<br />
1000<br />
P M W P M M W P M W<br />
0<br />
Self<br />
insurance<br />
P M W P M M W P M W<br />
Tigray Murewa Kakamega Tigray Murewa Kakamega
From the <strong>analysis</strong>:<br />
� The household and the lives<strong>to</strong>ck are the most<br />
important sinks for N (key nodes)<br />
� Lives<strong>to</strong>ck represent a ‘nonproductive cost’<br />
…but also selfinsurance<br />
…and a driver for nutrient cycling<br />
� Agroecosystems are refined networks
Conclusions<br />
� NA is useful <strong>to</strong> <strong>analyse</strong> agroecosystems properties:<br />
e.g. allowed <strong>to</strong> identify elements of productivity, stability and<br />
resilience<br />
� Results can contribute <strong>to</strong> discussions on livelihoods<br />
because NA includes:<br />
� The rural family and their primary goals<br />
� The natural resources (constraints and opportunities)<br />
� And shows the effects of human agency (adaptive management)
Thanks<br />
and the contribution of:<br />
Huib Hengsdijk, Jan Verhagen, Shamie Zingore and Luke Latham<br />
© Wageningen UR