Sustained Elevation of Circulating Growth and Differentiation Factor ...
Sustained Elevation of Circulating Growth and Differentiation Factor ...
Sustained Elevation of Circulating Growth and Differentiation Factor ...

Create successful ePaper yourself
Turn your PDF publications into a flip-book with our unique Google optimized e-Paper software.
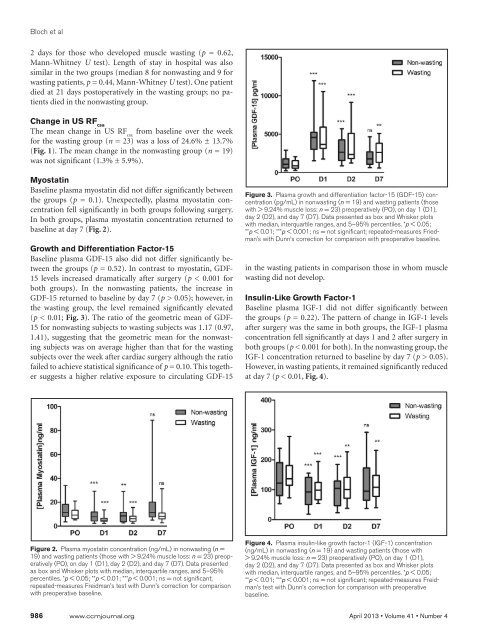
Bloch et al2 days for those who developed muscle wasting (p = 0.62,Mann-Whitney U test). Length <strong>of</strong> stay in hospital was alsosimilar in the two groups (median 8 for nonwasting <strong>and</strong> 9 forwasting patients, p = 0.44, Mann-Whitney U test). One patientdied at 21 days postoperatively in the wasting group; no patientsdied in the nonwasting group.Change in US RF csaThe mean change in US RF csafrom baseline over the weekfor the wasting group (n = 23) was a loss <strong>of</strong> 24.6% ± 13.7%(Fig. 1). The mean change in the nonwasting group (n = 19)was not significant (1.3% ± 5.9%).MyostatinBaseline plasma myostatin did not differ significantly betweenthe groups (p = 0.1). Unexpectedly, plasma myostatin concentrationfell significantly in both groups following surgery.In both groups, plasma myostatin concentration returned tobaseline at day 7 (Fig. 2).<strong>Growth</strong> <strong>and</strong> <strong>Differentiation</strong> <strong>Factor</strong>-15Baseline plasma GDF-15 also did not differ significantly betweenthe groups (p = 0.52). In contrast to myostatin, GDF-15 levels increased dramatically after surgery (p < 0.001 forboth groups). In the nonwasting patients, the increase inGDF-15 returned to baseline by day 7 (p > 0.05); however, inthe wasting group, the level remained significantly elevated(p < 0.01; Fig. 3). The ratio <strong>of</strong> the geometric mean <strong>of</strong> GDF-15 for nonwasting subjects to wasting subjects was 1.17 (0.97,1.41), suggesting that the geometric mean for the nonwastingsubjects was on average higher than that for the wastingsubjects over the week after cardiac surgery although the rati<strong>of</strong>ailed to achieve statistical significance <strong>of</strong> p = 0.10. This togethersuggests a higher relative exposure to circulating GDF-15Figure 3. Plasma growth <strong>and</strong> differentiation factor-15 (GDF-15) concentration(pg/mL) in nonwasting (n = 19) <strong>and</strong> wasting patients (thosewith > 9.24% muscle loss: n = 23) preoperatively (PO), on day 1 (D1),day 2 (D2), <strong>and</strong> day 7 (D7). Data presented as box <strong>and</strong> Whisker plotswith median, interquartile ranges, <strong>and</strong> 5–95% percentiles. *p < 0.05;**p < 0.01; ***p < 0.001; ns = not significant; repeated-measures Friedman’swith Dunn’s correction for comparison with preoperative baseline.in the wasting patients in comparison those in whom musclewasting did not develop.Insulin-Like <strong>Growth</strong> <strong>Factor</strong>-1Baseline plasma IGF-1 did not differ significantly betweenthe groups (p = 0.22). The pattern <strong>of</strong> change in IGF-1 levelsafter surgery was the same in both groups, the IGF-1 plasmaconcentration fell significantly at days 1 <strong>and</strong> 2 after surgery inboth groups (p < 0.001 for both). In the nonwasting group, theIGF-1 concentration returned to baseline by day 7 (p > 0.05).However, in wasting patients, it remained significantly reducedat day 7 (p < 0.01, Fig. 4).Figure 2. Plasma myostatin concentration (ng/mL) in nonwasting (n =19) <strong>and</strong> wasting patients (those with > 9.24% muscle loss: n = 23) preoperatively(PO), on day 1 (D1), day 2 (D2), <strong>and</strong> day 7 (D7). Data presentedas box <strong>and</strong> Whisker plots with median, interquartile ranges, <strong>and</strong> 5–95%percentiles. *p < 0.05; **p < 0.01; ***p < 0.001; ns = not significant;repeated-measures Freidman’s test with Dunn’s correction for comparisonwith preoperative baseline.Figure 4. Plasma insulin-like growth factor-1 (IGF-1) concentration(ng/mL) in nonwasting (n = 19) <strong>and</strong> wasting patients (those with> 9.24% muscle loss: n = 23) preoperatively (PO), on day 1 (D1),day 2 (D2), <strong>and</strong> day 7 (D7). Data presented as box <strong>and</strong> Whisker plotswith median, interquartile ranges, <strong>and</strong> 5–95% percentiles. *p < 0.05;**p < 0.01; ***p < 0.001; ns = not significant; repeated-measures Freidman’stest with Dunn’s correction for comparison with preoperativebaseline.986 www.ccmjournal.org April 2013 • Volume 41 • Number 4